| Param | Original file | Final file |
|---|---|---|
| Filename | modeM0/AS1A14_113T09_9000006574_57514cztM0_level2.fits | modeM0/AS1A14_113T09_9000006574_57514cztM0_level2_quad_clean.evt |
| Size (bytes) | 592,646,400 | 108,368,640 |
| Size | 565.2 MB | 103.3 MB |
| Events in quadrant A | 3,547,298 | 729,798 |
| Events in quadrant B | 5,803,785 | 748,367 |
| Events in quadrant C | 6,996,477 | 625,538 |
| Events in quadrant D | 4,991,522 | 640,602 |
| Mode SS | |||
|---|---|---|---|
| Quadrant | BADHDUFLAG | Total packets | Discarded packets |
| A | 0 | 154 | 0 |
| B | 0 | 154 | 0 |
| C | 0 | 154 | 0 |
| D | 0 | 154 | 0 |
| Mode M0 | |||
|---|---|---|---|
| Quadrant | BADHDUFLAG | Total packets | Discarded packets |
| A | 0 | 16362 | 0 |
| B | 0 | 22555 | 0 |
| C | 0 | 26226 | 2 |
| D | 0 | 20255 | 0 |
| Quadrant | Total seconds | Saturated seconds | Saturation percentage |
|---|---|---|---|
| A | 7718 | 45 | 0.583053% |
| B | 7719 | 493 | 6.386838% |
| C | 7718 | 912 | 11.816533% |
| D | 7718 | 329 | 4.262762% |
Noise dominated data is calculated using 1-second bins in cleaned event files. If a bin has >2000 counts, and if more than 50% of those come from <1% of pixels, then it is considered to be noise-dominated and hence unusable.
| Quadrant | # 1 sec bins | Bins with >0 counts | Bins with >2000 counts | High rate bins dominated by noise | Noise dominated (total time) | Noise dominated (detector-on time) | Marked lightcurve |
|---|---|---|---|---|---|---|---|
| A | 7718 | 7718 | 14 | 14 | 0.18% | 0.18% | 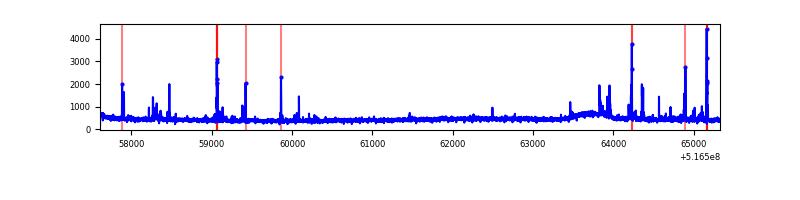 |
| B | 7719 | 7719 | 283 | 283 | 3.67% | 3.67% | 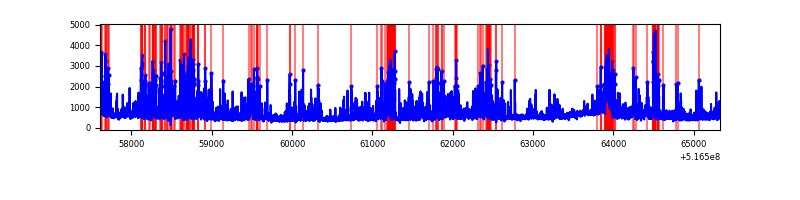 |
| C | 7718 | 7718 | 810 | 810 | 10.49% | 10.49% | 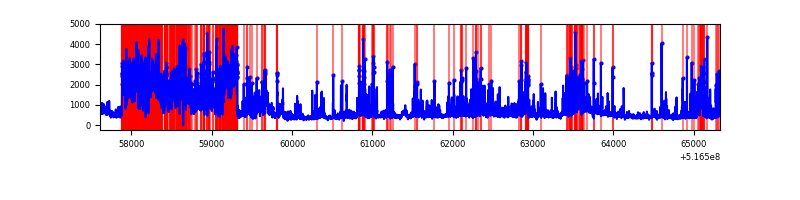 |
| D | 7718 | 7717 | 282 | 282 | 3.65% | 3.65% | 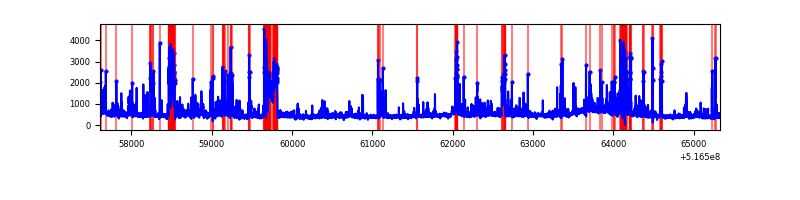 |
Top three noisy pixels from each quadrant. If the there are fewer than three noisy pixels in the level2.evt file, extra rows are filled as -1
| Pixel properties | Quadrant properties | ||||||
|---|---|---|---|---|---|---|---|
| Quadrant | DetID | PixID | Counts | Sigma | Mean | Median | Sigma |
| A | 3 | 245 | 70676 | 342.28 | 837 | 816 | 204.1 |
| A | 3 | 14 | 67862 | 328.5 | 837 | 816 | 204.1 |
| A | 7 | 14 | 59429 | 287.18 | 837 | 816 | 204.1 |
| B | 4 | 206 | 1467596 | 8525.62 | 809 | 780 | 172.0 |
| B | 2 | 249 | 510457 | 2962.41 | 809 | 780 | 172.0 |
| B | 5 | 185 | 212408 | 1230.05 | 809 | 780 | 172.0 |
| C | 9 | 38 | 2217772 | 10573.45 | 771 | 760 | 209.7 |
| C | 15 | 224 | 1475174 | 7031.83 | 771 | 760 | 209.7 |
| C | 6 | 223 | 80405 | 379.84 | 771 | 760 | 209.7 |
| D | 8 | 240 | 603039 | 2671.96 | 798 | 762 | 225.4 |
| D | 12 | 128 | 493724 | 2186.99 | 798 | 762 | 225.4 |
| D | 7 | 96 | 326440 | 1444.85 | 798 | 762 | 225.4 |
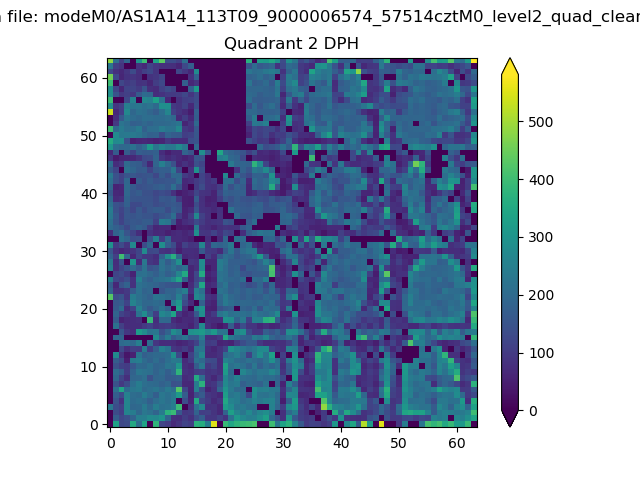
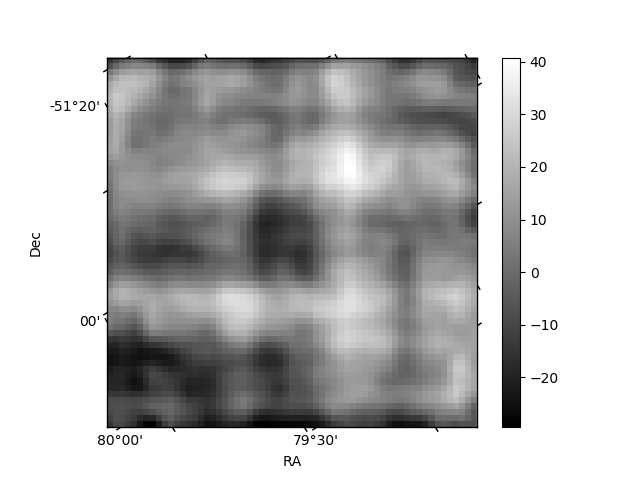
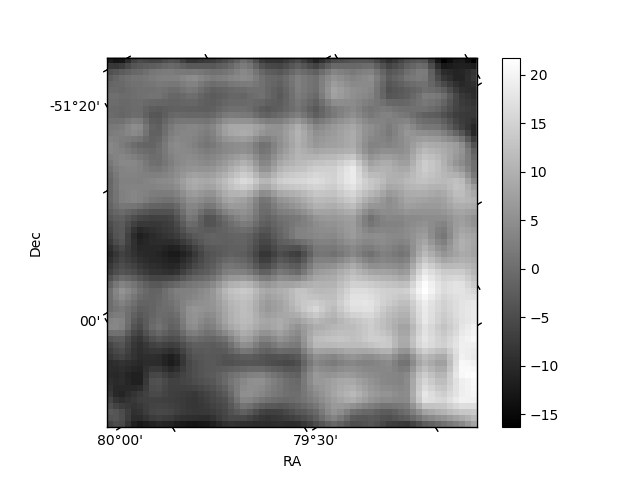
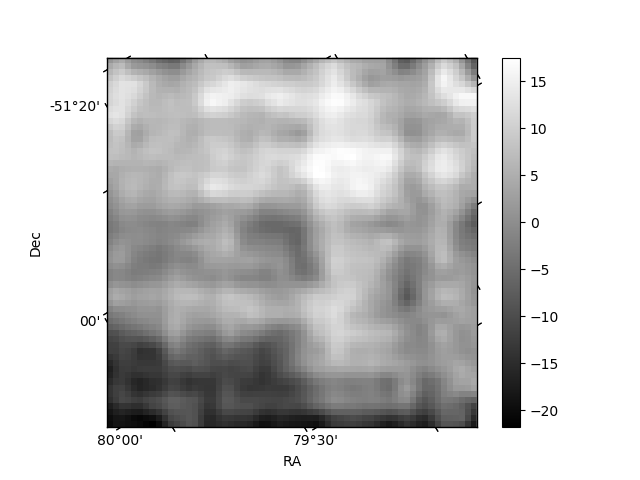
Histogram calculated using DETX and DETY for each event in the final _common_clean file
| Quadrant A | 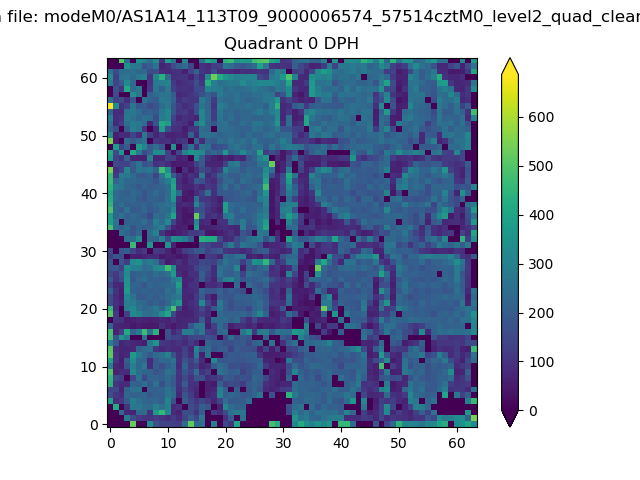 |
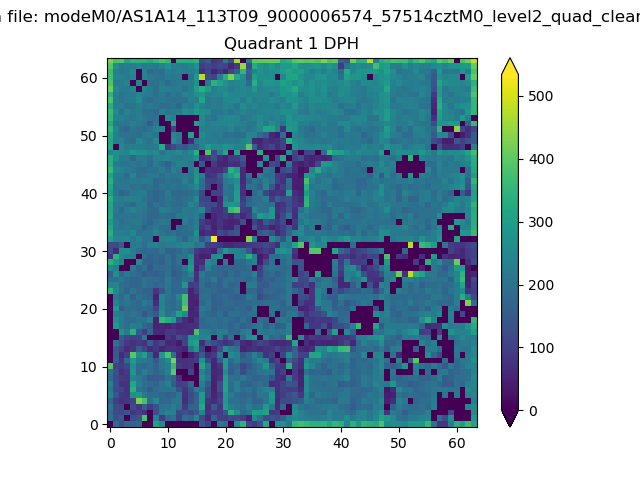 |
Quadrant B |
|---|---|---|---|
| Quadrant D | 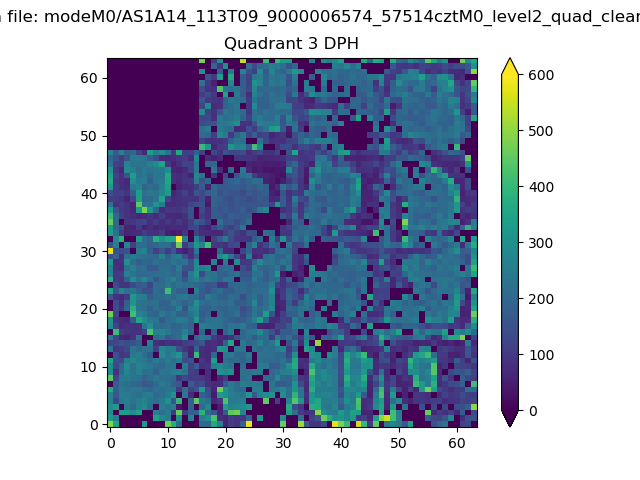 |
 |
Quadrant C |
| Plot type | Count rate plots | Images |
|---|---|---|
| Comparison with Poisson distribution Blue bars denote a histogram of data divided into 1 sec bins. Red curve is a Poisson curve with rate = median count rate of data. |
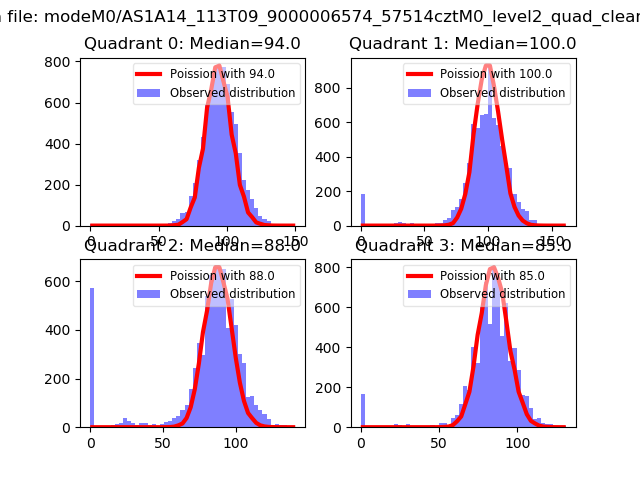 |
 |
| Quadrant-wise count rates Data is divided into 100 sec bins |
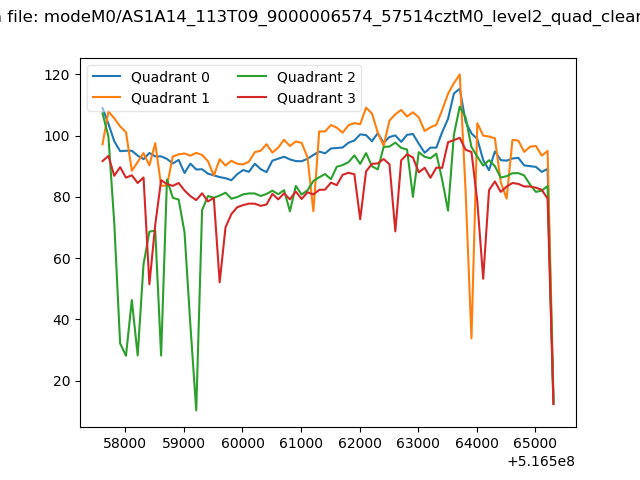 |
|
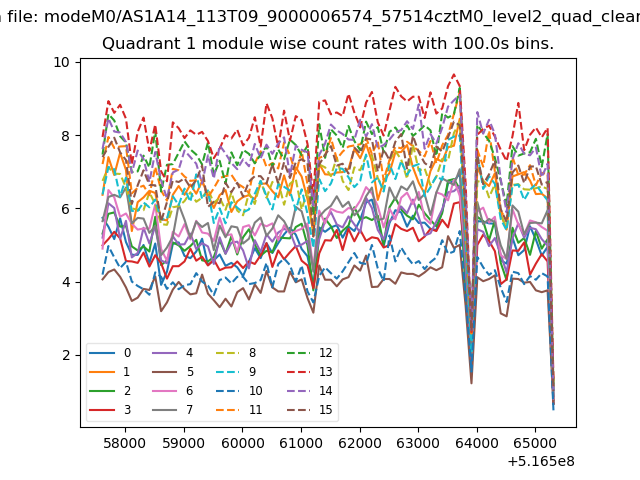
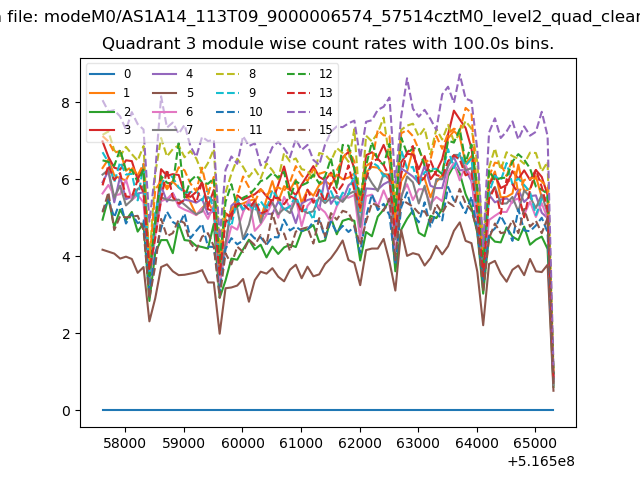
| Module-wise count rates for Quadrant A Data is divided into 100 sec bins |
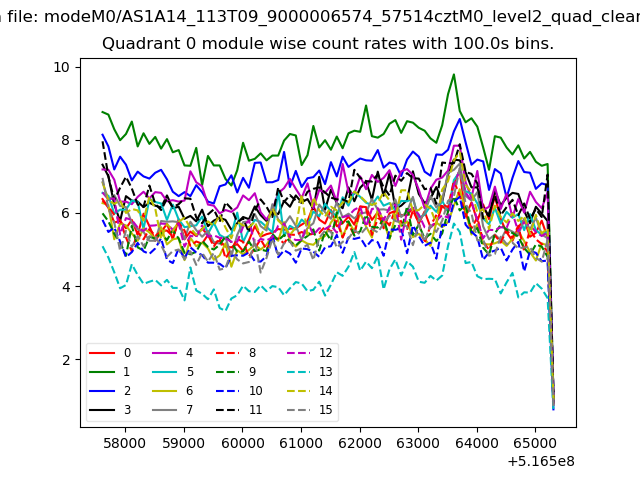 |
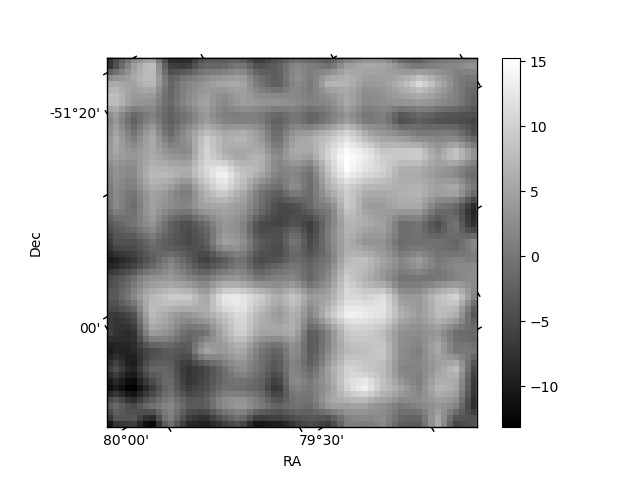 |
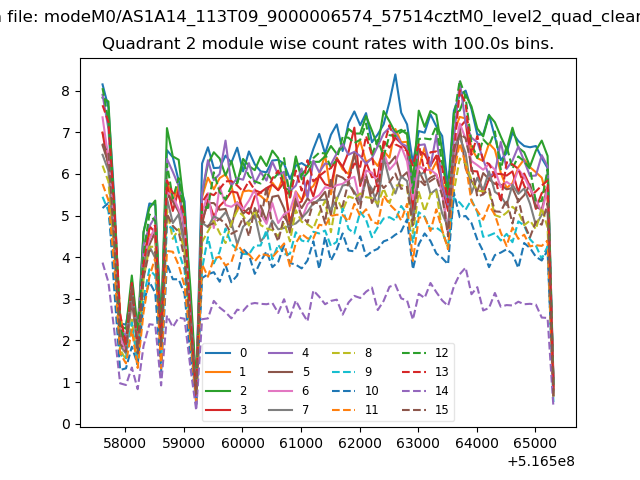
| Module-wise count rates for Quadrant B Data is divided into 100 sec bins |
 |
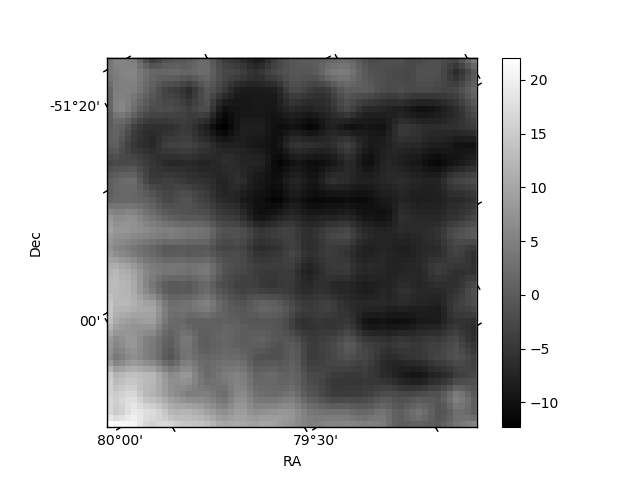 |
| Module-wise count rates for Quadrant C Data is divided into 100 sec bins |
 |
 |
| Module-wise count rates for Quadrant D Data is divided into 100 sec bins |
 |
 |
| Parameter | Plot |
|---|---|
| CZT HV Monitor | 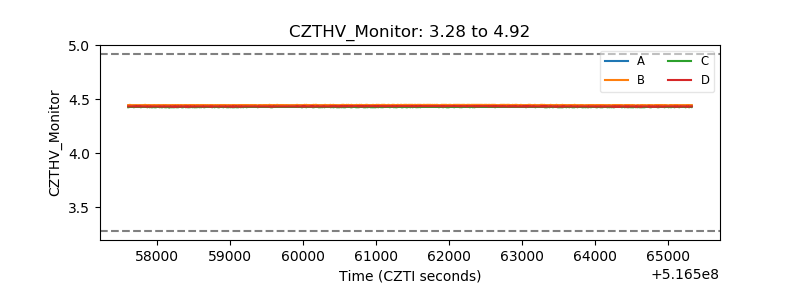 |
| D_VDD | 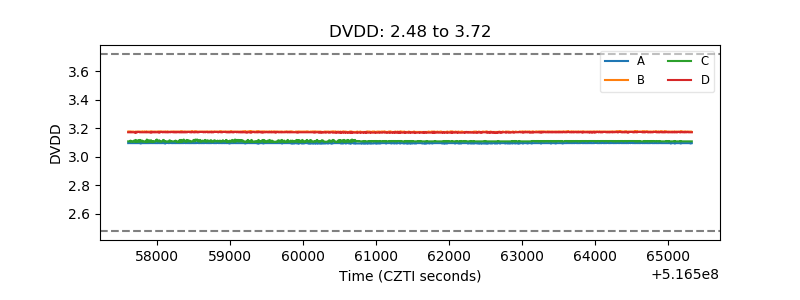 |
| Temperature 1 | 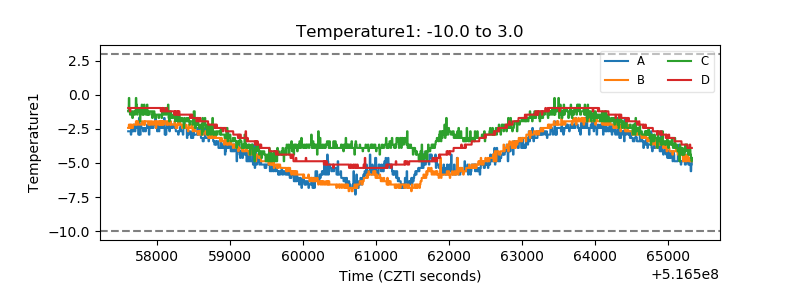 |
| Veto HV Monitor |  |
| Veto LLD | 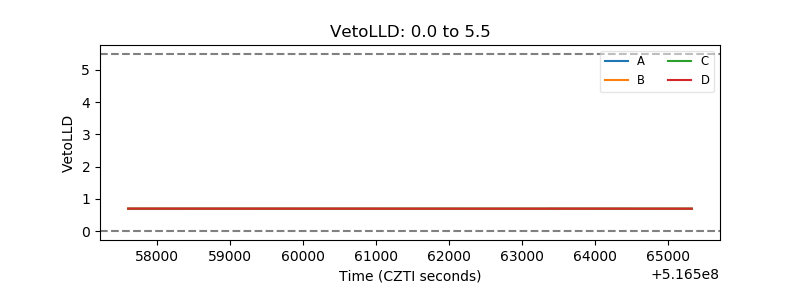 |
| Alpha Counter | 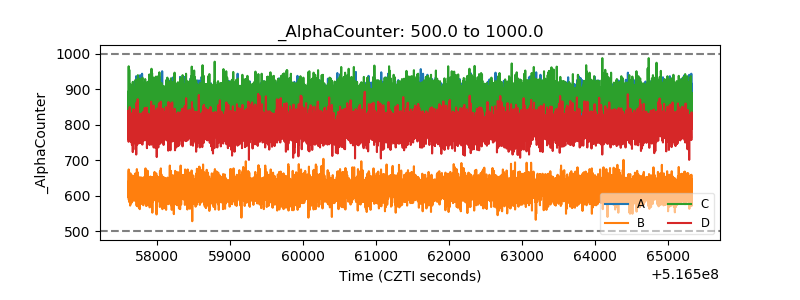 |
| _CPM_Rate | 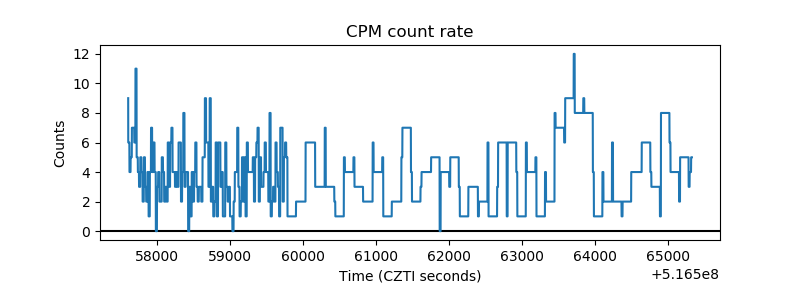 |
| CZT Counter | 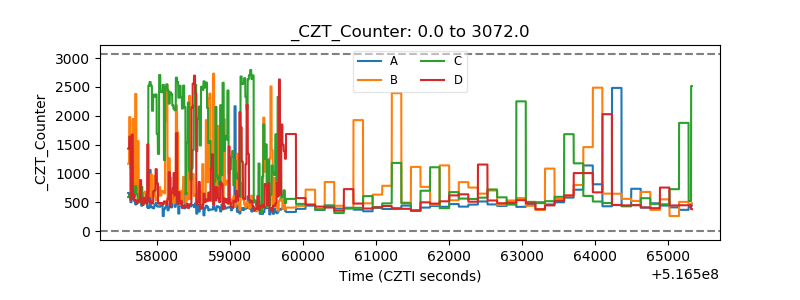 |
| +2.5 Volts monitor |  |
| +5 Volts monitor |  |
| _ROLL_ROT | 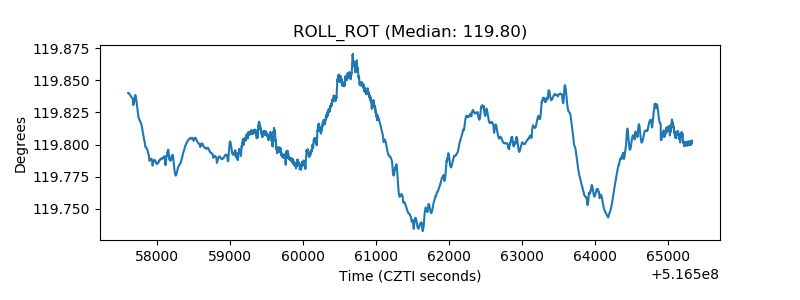 |
| _Roll_DEC | 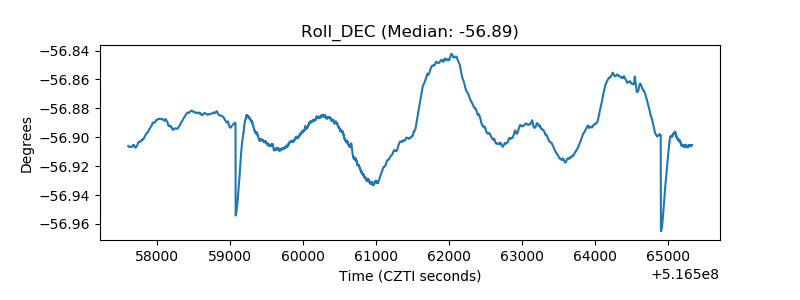 |
| _Roll_RA | 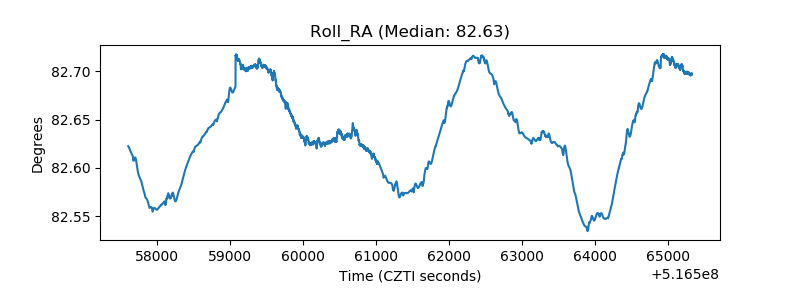 |
| Veto Counter | 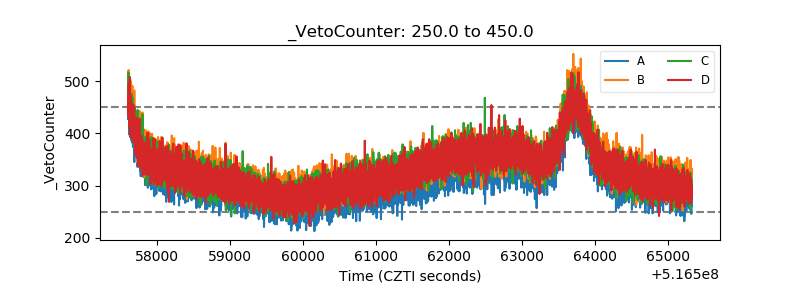 |