| Param | Original file | Final file |
|---|---|---|
| Filename | modeM0/AS1A14_113T09_9000006574_57515cztM0_level2.fits | modeM0/AS1A14_113T09_9000006574_57515cztM0_level2_quad_clean.evt |
| Size (bytes) | 523,762,560 | 104,814,720 |
| Size | 499.5 MB | 100.0 MB |
| Events in quadrant A | 3,419,320 | 705,805 |
| Events in quadrant B | 4,102,004 | 746,377 |
| Events in quadrant C | 6,497,842 | 623,060 |
| Events in quadrant D | 4,785,012 | 575,594 |
| Mode SS | |||
|---|---|---|---|
| Quadrant | BADHDUFLAG | Total packets | Discarded packets |
| A | 0 | 150 | 0 |
| B | 0 | 150 | 0 |
| C | 0 | 150 | 0 |
| D | 0 | 150 | 0 |
| Mode M0 | |||
|---|---|---|---|
| Quadrant | BADHDUFLAG | Total packets | Discarded packets |
| A | 0 | 15856 | 0 |
| B | 0 | 17361 | 0 |
| C | 0 | 24710 | 0 |
| D | 0 | 19826 | 0 |
| Quadrant | Total seconds | Saturated seconds | Saturation percentage |
|---|---|---|---|
| A | 7509 | 45 | 0.599281% |
| B | 7510 | 161 | 2.143808% |
| C | 7510 | 769 | 10.239680% |
| D | 7510 | 772 | 10.279627% |
Noise dominated data is calculated using 1-second bins in cleaned event files. If a bin has >2000 counts, and if more than 50% of those come from <1% of pixels, then it is considered to be noise-dominated and hence unusable.
| Quadrant | # 1 sec bins | Bins with >0 counts | Bins with >2000 counts | High rate bins dominated by noise | Noise dominated (total time) | Noise dominated (detector-on time) | Marked lightcurve |
|---|---|---|---|---|---|---|---|
| A | 7509 | 7509 | 16 | 16 | 0.21% | 0.21% | 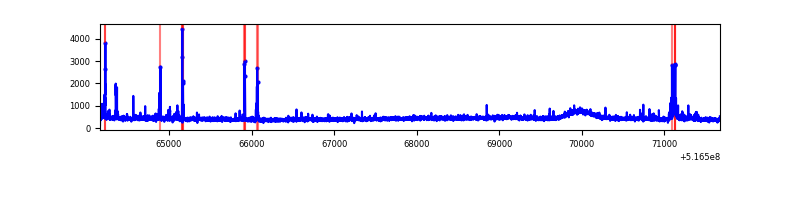 |
| B | 7510 | 7510 | 65 | 65 | 0.87% | 0.87% | 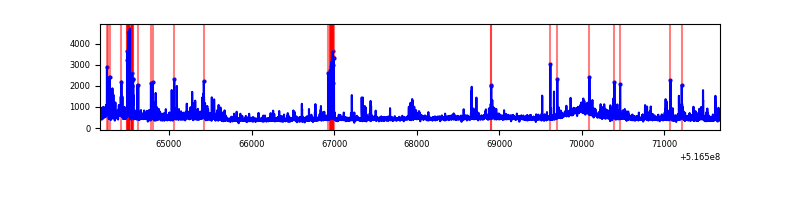 |
| C | 7510 | 7510 | 586 | 586 | 7.80% | 7.80% | 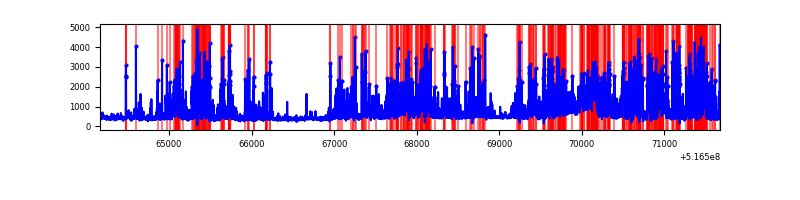 |
| D | 7510 | 7510 | 372 | 372 | 4.95% | 4.95% | 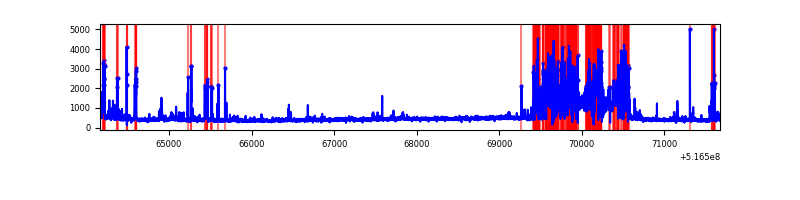 |
Top three noisy pixels from each quadrant. If the there are fewer than three noisy pixels in the level2.evt file, extra rows are filled as -1
| Pixel properties | Quadrant properties | ||||||
|---|---|---|---|---|---|---|---|
| Quadrant | DetID | PixID | Counts | Sigma | Mean | Median | Sigma |
| A | 13 | 248 | 117997 | 584.72 | 810 | 784 | 200.5 |
| A | 3 | 245 | 77572 | 383.06 | 810 | 784 | 200.5 |
| A | 3 | 14 | 53865 | 264.8 | 810 | 784 | 200.5 |
| B | 4 | 206 | 406823 | 2379.73 | 795 | 765 | 170.6 |
| B | 5 | 185 | 125467 | 730.82 | 795 | 765 | 170.6 |
| B | 0 | 245 | 91535 | 531.96 | 795 | 765 | 170.6 |
| C | 15 | 224 | 3382812 | 16671.47 | 749 | 742 | 202.9 |
| C | 12 | 252 | 46023 | 223.21 | 749 | 742 | 202.9 |
| C | 6 | 223 | 45338 | 219.83 | 749 | 742 | 202.9 |
| D | 8 | 240 | 1588060 | 7766.62 | 719 | 683 | 204.4 |
| D | 7 | 96 | 67227 | 325.58 | 719 | 683 | 204.4 |
| D | 5 | 173 | 62686 | 303.36 | 719 | 683 | 204.4 |
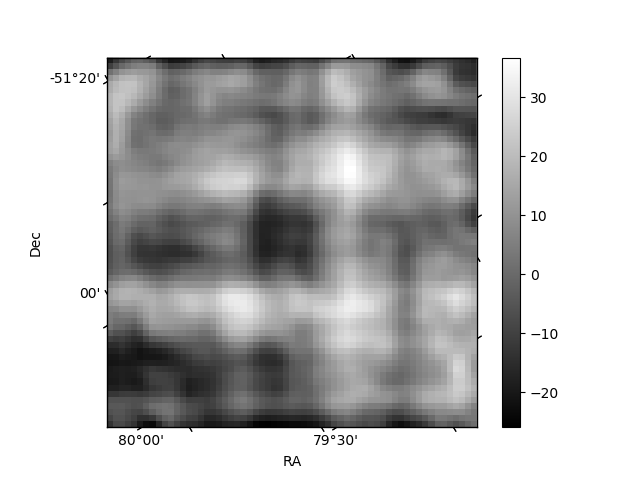
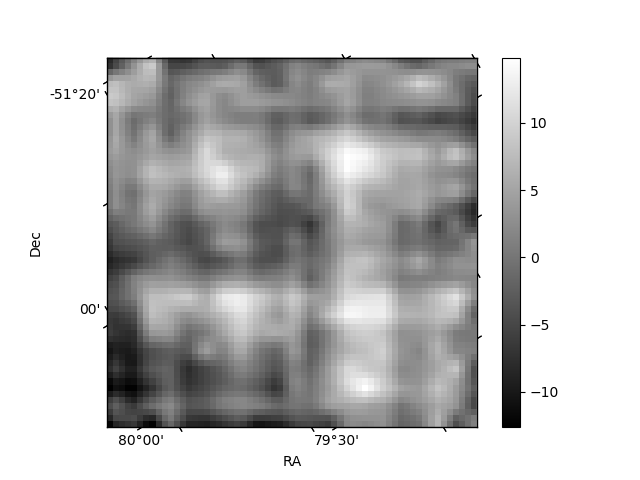
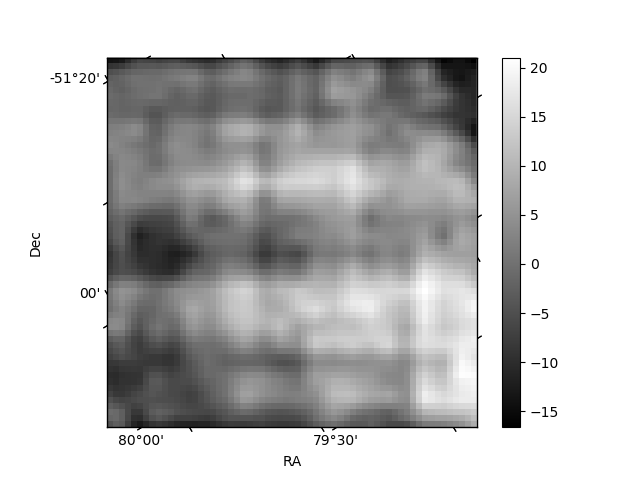
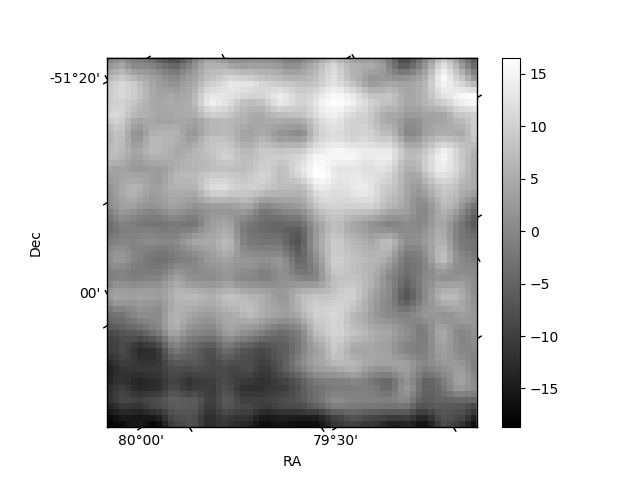
Histogram calculated using DETX and DETY for each event in the final _common_clean file
| Quadrant A | 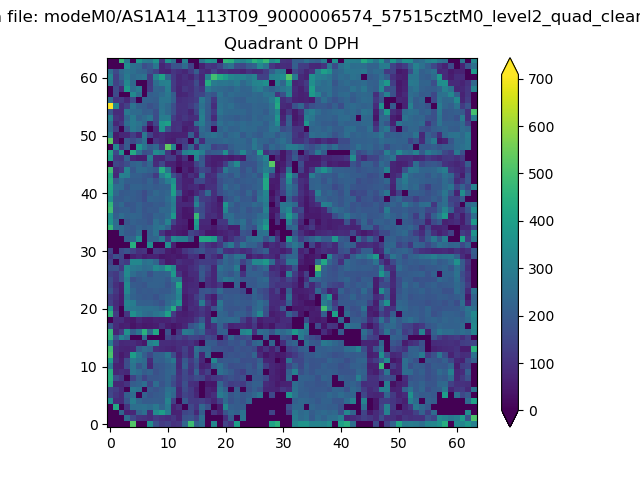 |
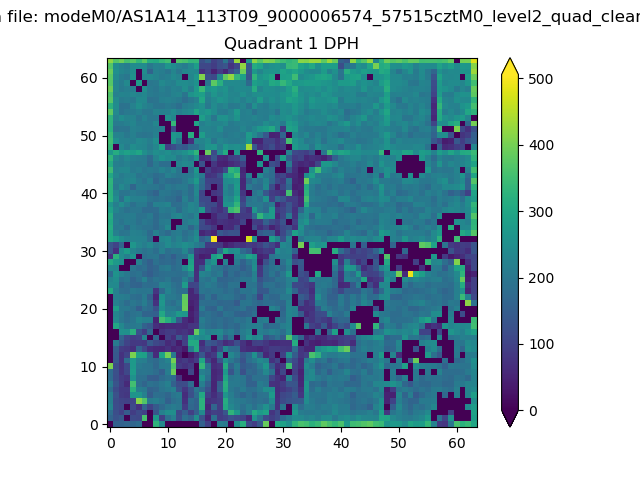 |
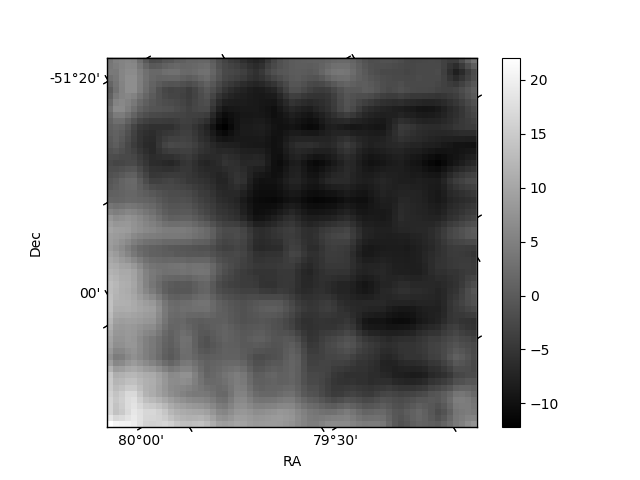
Quadrant B |
|---|---|---|---|
| Quadrant D | 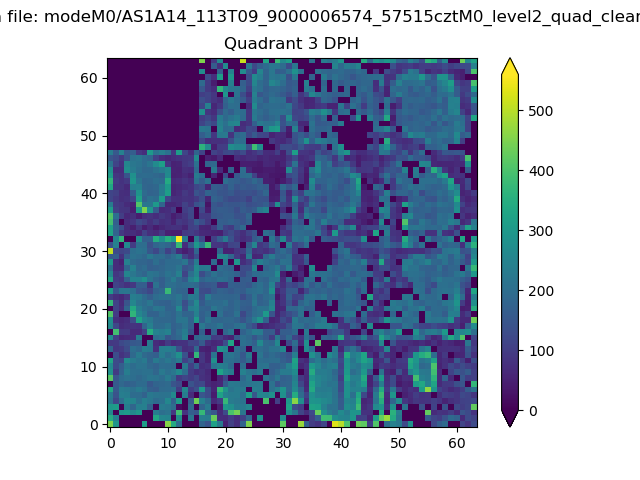 |
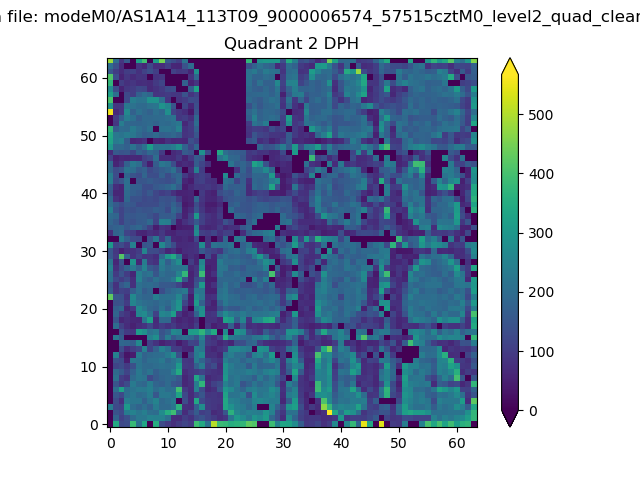 |
Quadrant C |
| Plot type | Count rate plots | Images |
|---|---|---|
| Comparison with Poisson distribution Blue bars denote a histogram of data divided into 1 sec bins. Red curve is a Poisson curve with rate = median count rate of data. |
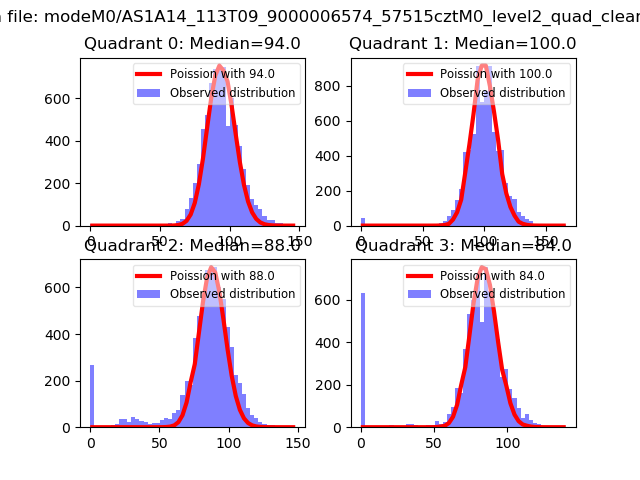 |
 |
| Quadrant-wise count rates Data is divided into 100 sec bins |
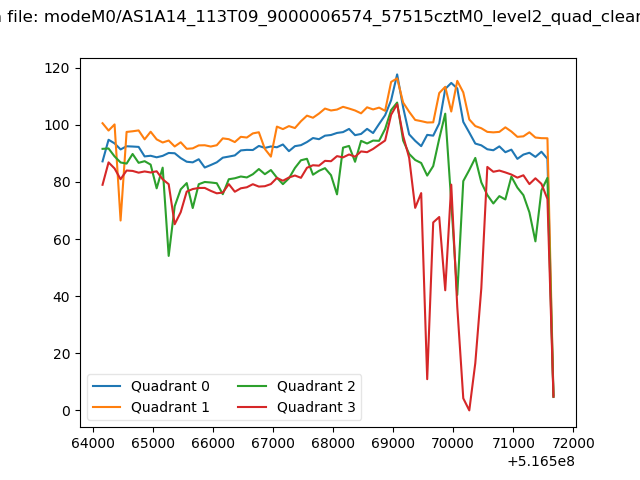 |
|
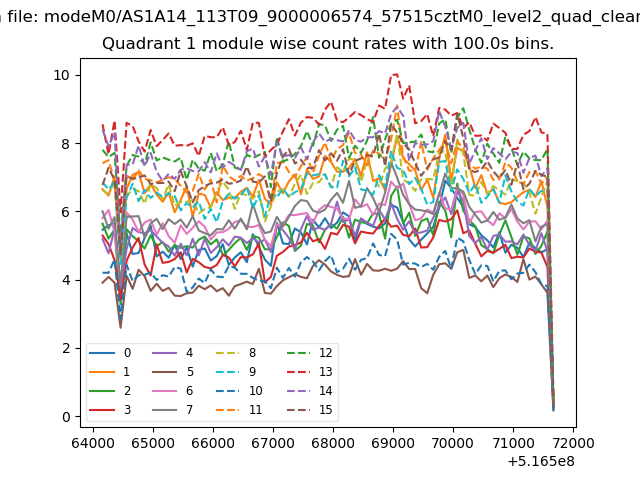
| Module-wise count rates for Quadrant A Data is divided into 100 sec bins |
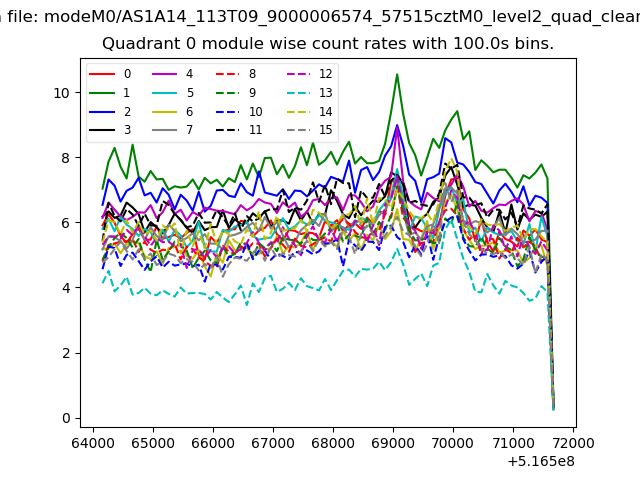 |
 |
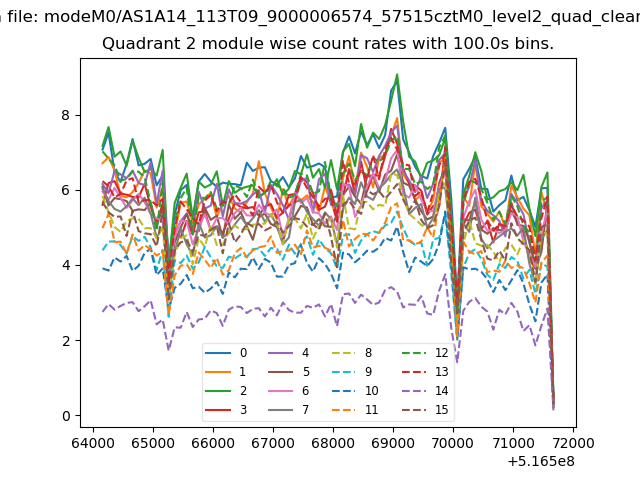
| Module-wise count rates for Quadrant B Data is divided into 100 sec bins |
 |
 |
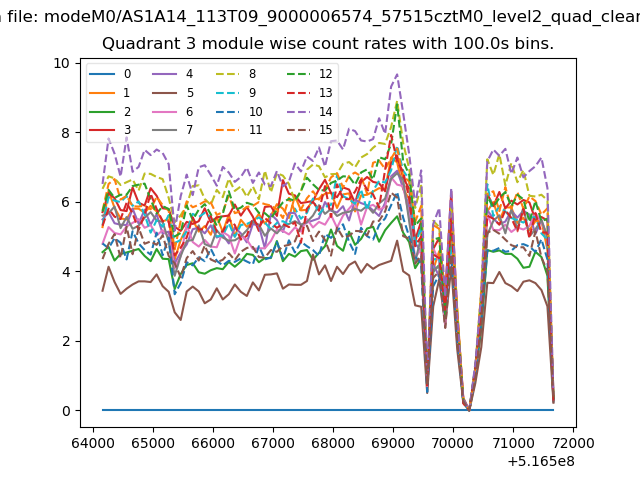
| Module-wise count rates for Quadrant C Data is divided into 100 sec bins |
 |
 |
| Module-wise count rates for Quadrant D Data is divided into 100 sec bins |
 |
 |
| Parameter | Plot |
|---|---|
| CZT HV Monitor | 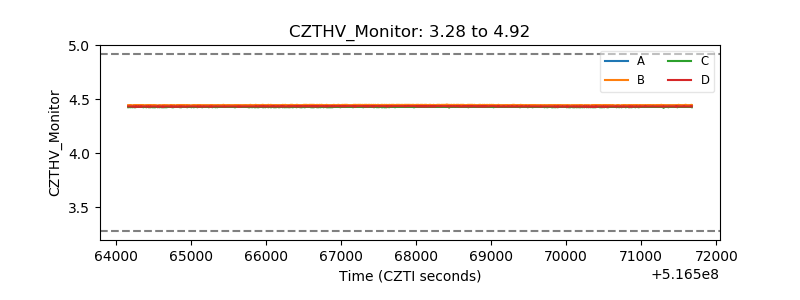 |
| D_VDD | 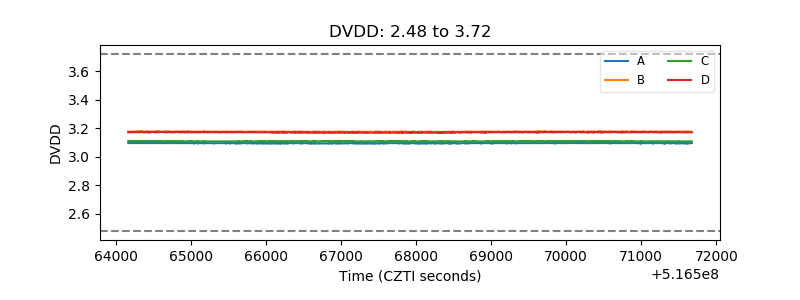 |
| Temperature 1 | 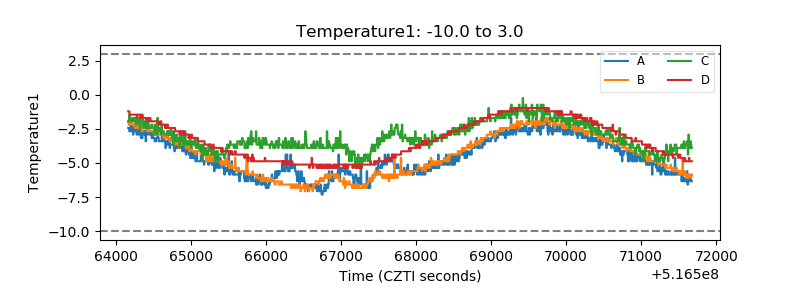 |
| Veto HV Monitor | 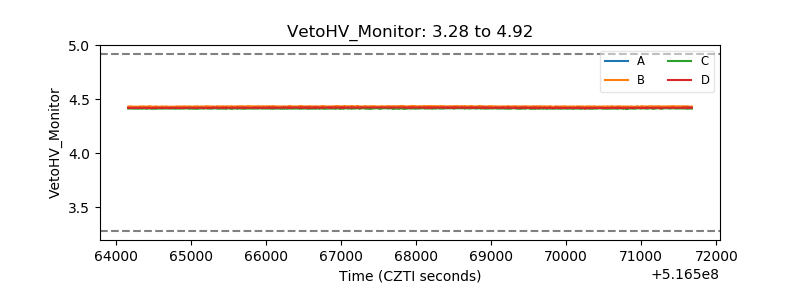 |
| Veto LLD | 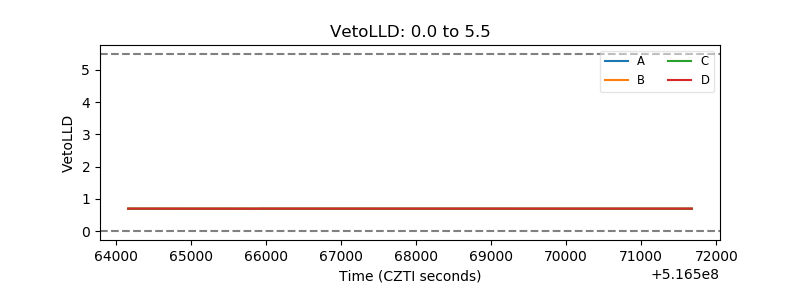 |
| Alpha Counter | 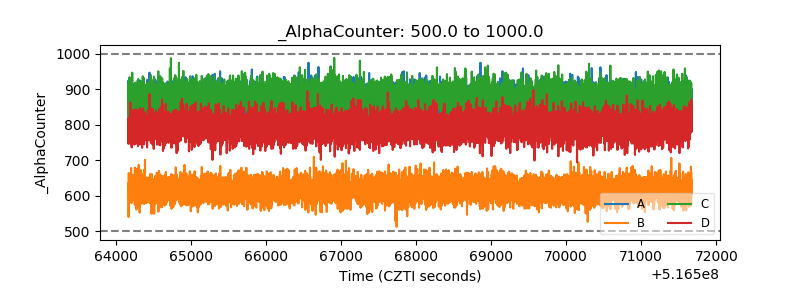 |
| _CPM_Rate | 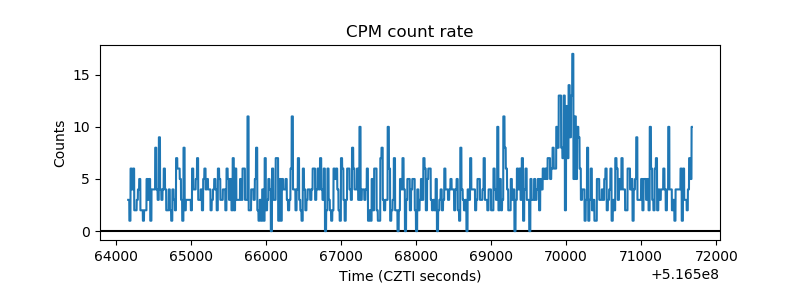 |
| CZT Counter | 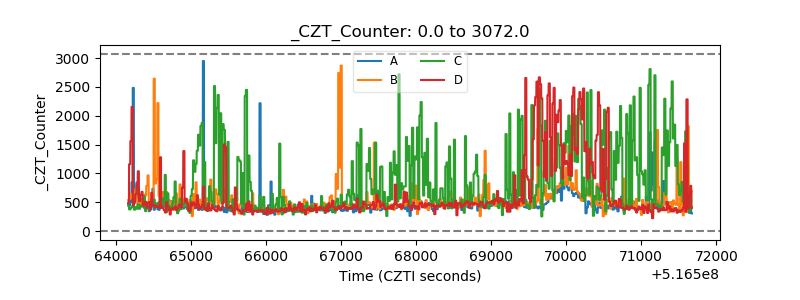 |
| +2.5 Volts monitor | 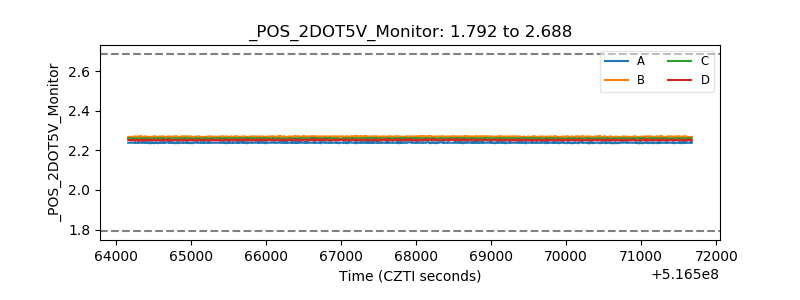 |
| +5 Volts monitor |  |
| _ROLL_ROT | 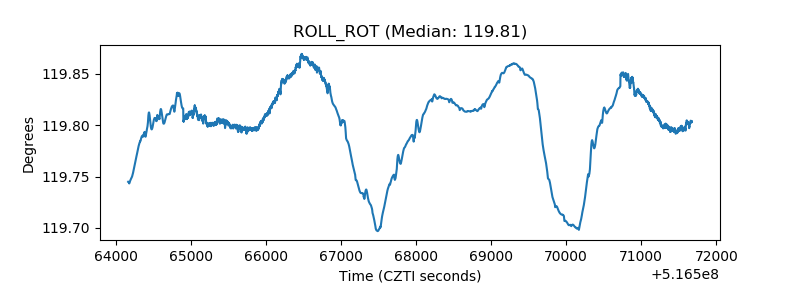 |
| _Roll_DEC | 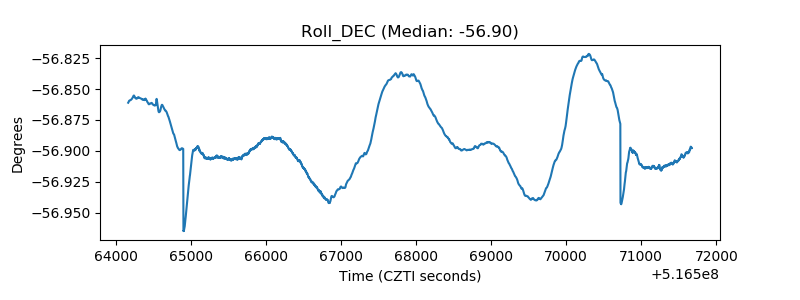 |
| _Roll_RA | 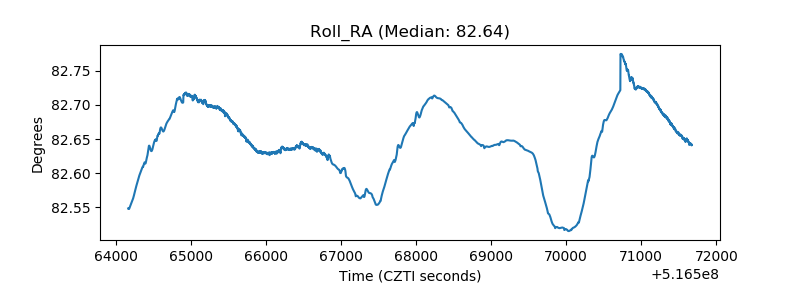 |
| Veto Counter | 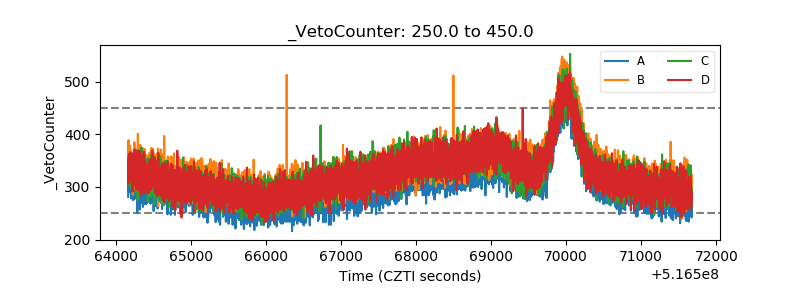 |