| Param | Original file | Final file |
|---|---|---|
| Filename | modeM0/AS1A14_113T09_9000006574_57518cztM0_level2.fits | modeM0/AS1A14_113T09_9000006574_57518cztM0_level2_quad_clean.evt |
| Size (bytes) | 1,269,838,080 | 274,236,480 |
| Size | 1.2 GB | 261.5 MB |
| Events in quadrant A | 8,678,650 | 1,870,331 |
| Events in quadrant B | 9,392,892 | 1,915,507 |
| Events in quadrant C | 14,688,196 | 1,637,242 |
| Events in quadrant D | 12,775,816 | 1,572,169 |
| Mode SS | |||
|---|---|---|---|
| Quadrant | BADHDUFLAG | Total packets | Discarded packets |
| A | 0 | 384 | 0 |
| B | 0 | 384 | 0 |
| C | 0 | 384 | 0 |
| D | 0 | 384 | 0 |
| Mode M9 | |||
|---|---|---|---|
| Quadrant | BADHDUFLAG | Total packets | Discarded packets |
| A | 0 | 15 | 0 |
| B | 0 | 15 | 0 |
| C | 0 | 15 | 0 |
| D | 0 | 15 | 0 |
| Mode M0 | |||
|---|---|---|---|
| Quadrant | BADHDUFLAG | Total packets | Discarded packets |
| A | 0 | 40368 | 3 |
| B | 0 | 41264 | 3 |
| C | 0 | 56844 | 3 |
| D | 0 | 51480 | 3 |
| Quadrant | Total seconds | Saturated seconds | Saturation percentage |
|---|---|---|---|
| A | 18985 | 140 | 0.737424% |
| B | 18986 | 280 | 1.474771% |
| C | 18986 | 1372 | 7.226377% |
| D | 18986 | 1232 | 6.488992% |
Noise dominated data is calculated using 1-second bins in cleaned event files. If a bin has >2000 counts, and if more than 50% of those come from <1% of pixels, then it is considered to be noise-dominated and hence unusable.
| Quadrant | # 1 sec bins | Bins with >0 counts | Bins with >2000 counts | High rate bins dominated by noise | Noise dominated (total time) | Noise dominated (detector-on time) | Marked lightcurve |
|---|---|---|---|---|---|---|---|
| A | 20416 | 18988 | 17 | 17 | 0.08% | 0.09% | 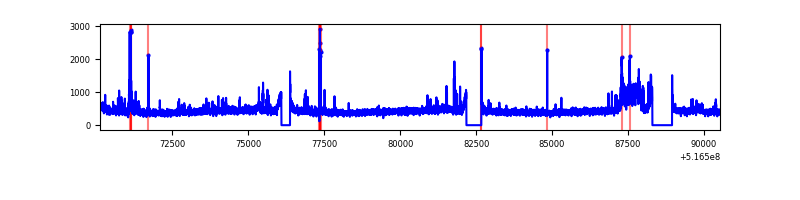 |
| B | 20417 | 18989 | 41 | 41 | 0.20% | 0.22% | 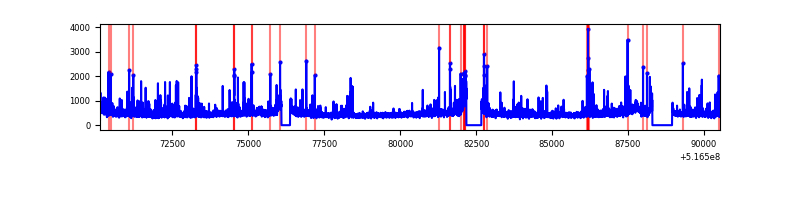 |
| C | 20417 | 18989 | 1035 | 1035 | 5.07% | 5.45% | 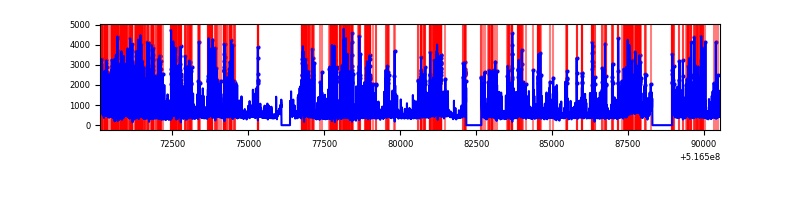 |
| D | 20417 | 18989 | 763 | 763 | 3.74% | 4.02% | 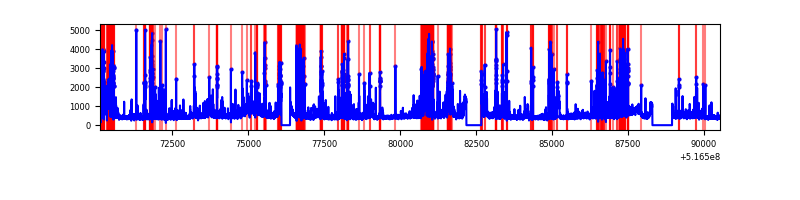 |
Top three noisy pixels from each quadrant. If the there are fewer than three noisy pixels in the level2.evt file, extra rows are filled as -1
| Pixel properties | Quadrant properties | ||||||
|---|---|---|---|---|---|---|---|
| Quadrant | DetID | PixID | Counts | Sigma | Mean | Median | Sigma |
| A | 3 | 14 | 325278 | 631.13 | 2073 | 2022 | 512.2 |
| A | 13 | 248 | 121877 | 234.01 | 2073 | 2022 | 512.2 |
| A | 7 | 14 | 101610 | 194.44 | 2073 | 2022 | 512.2 |
| B | 4 | 206 | 535483 | 1238.1 | 2025 | 1946 | 430.9 |
| B | 7 | 252 | 136420 | 312.05 | 2025 | 1946 | 430.9 |
| B | 2 | 249 | 136284 | 311.74 | 2025 | 1946 | 430.9 |
| C | 15 | 224 | 6438392 | 12167.49 | 1940 | 1918 | 529.0 |
| C | 14 | 246 | 169568 | 316.92 | 1940 | 1918 | 529.0 |
| C | 14 | 254 | 159299 | 297.51 | 1940 | 1918 | 529.0 |
| D | 8 | 240 | 2874805 | 5196.85 | 1935 | 1844 | 552.8 |
| D | 15 | 142 | 678287 | 1223.61 | 1935 | 1844 | 552.8 |
| D | 2 | 31 | 499686 | 900.54 | 1935 | 1844 | 552.8 |
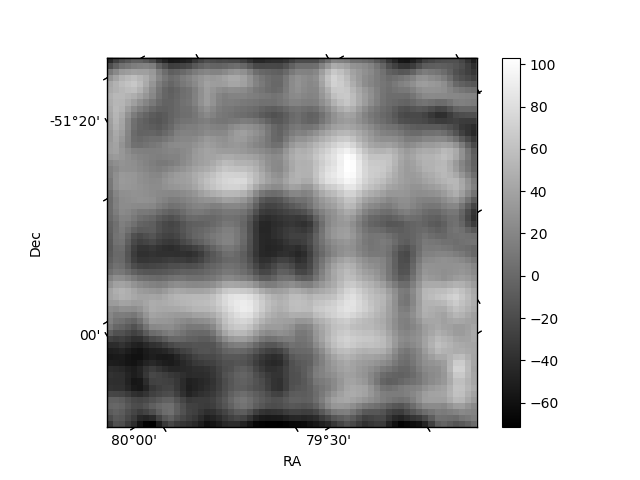
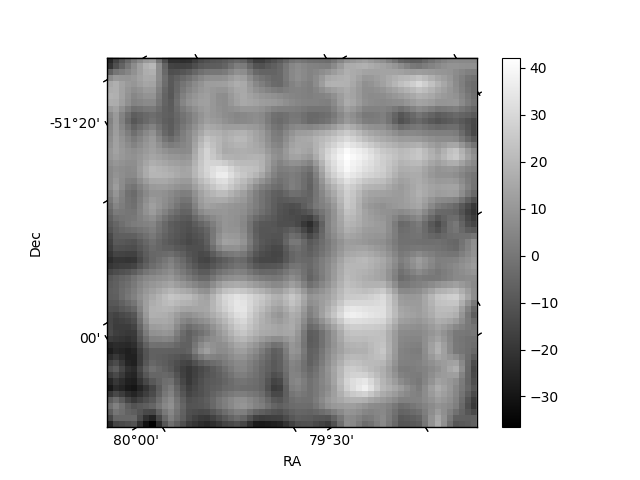
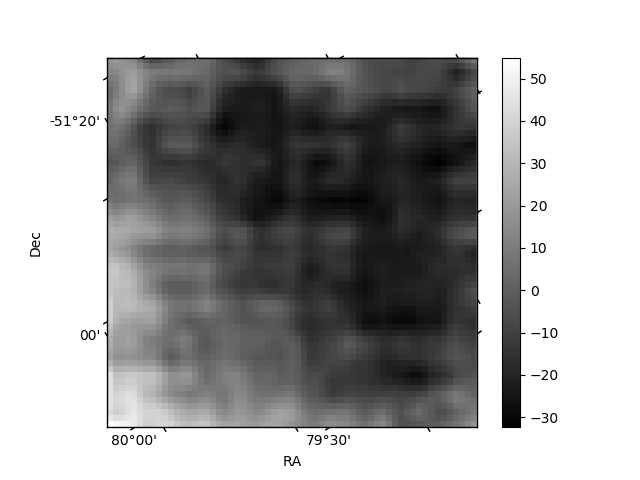
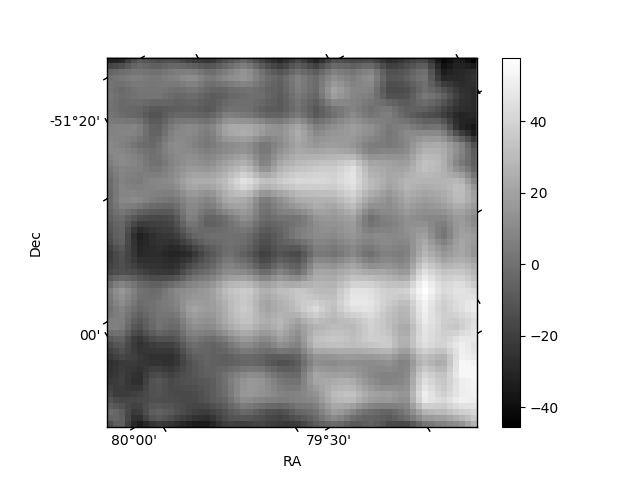
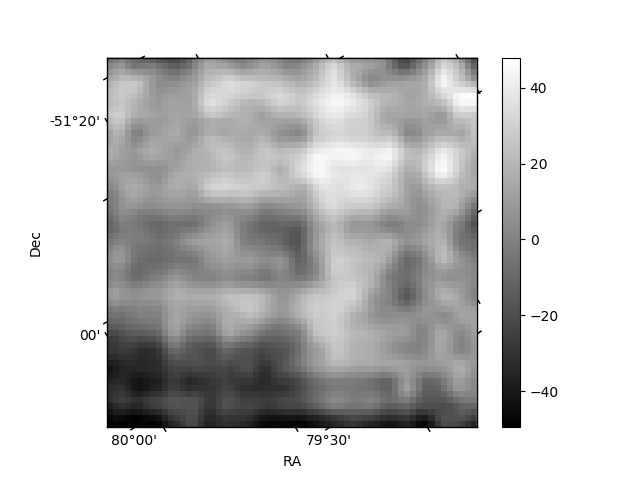
Histogram calculated using DETX and DETY for each event in the final _common_clean file
| Quadrant A | 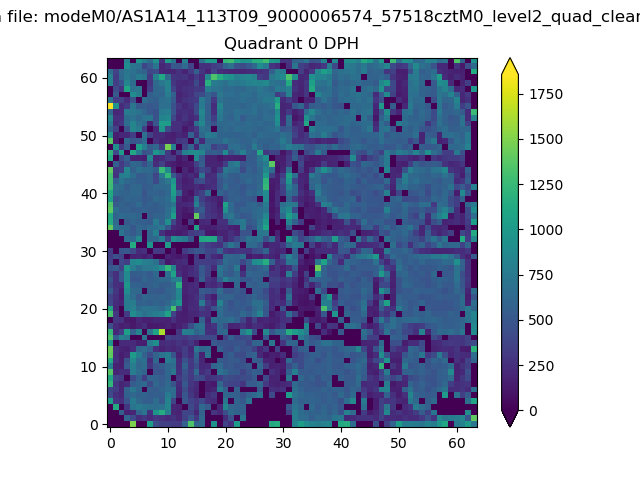 |
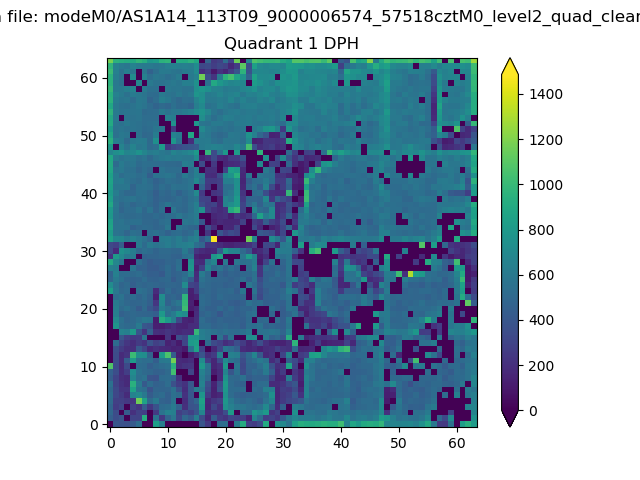 |
Quadrant B |
|---|---|---|---|
| Quadrant D | 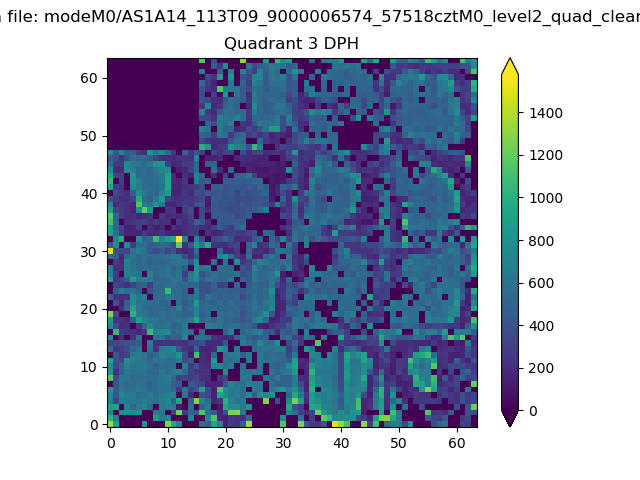 |
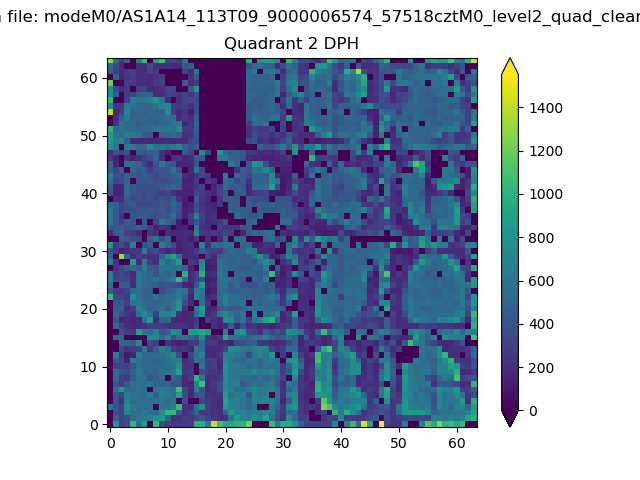 |
Quadrant C |
| Plot type | Count rate plots | Images |
|---|---|---|
| Comparison with Poisson distribution Blue bars denote a histogram of data divided into 1 sec bins. Red curve is a Poisson curve with rate = median count rate of data. |
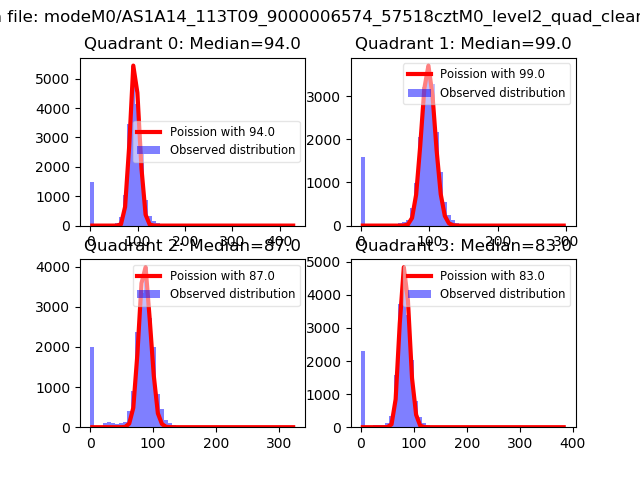 |
 |
| Quadrant-wise count rates Data is divided into 100 sec bins |
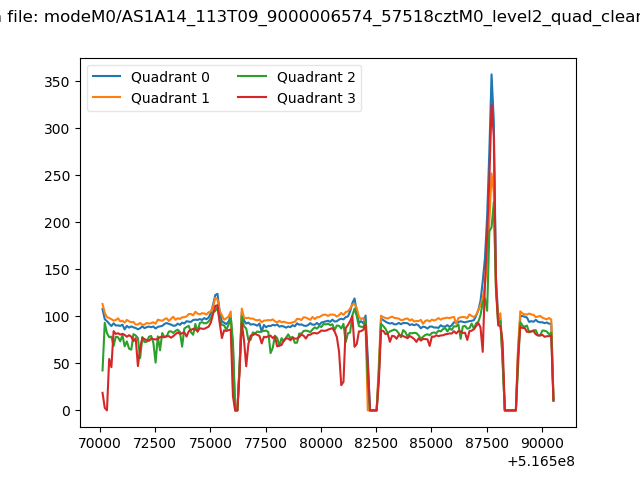 |
|
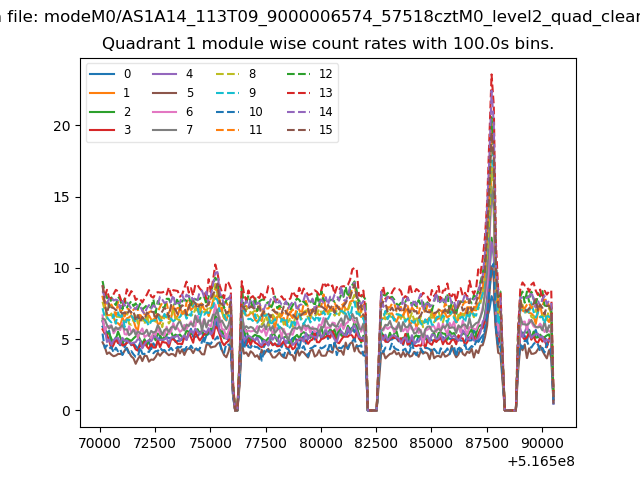
| Module-wise count rates for Quadrant A Data is divided into 100 sec bins |
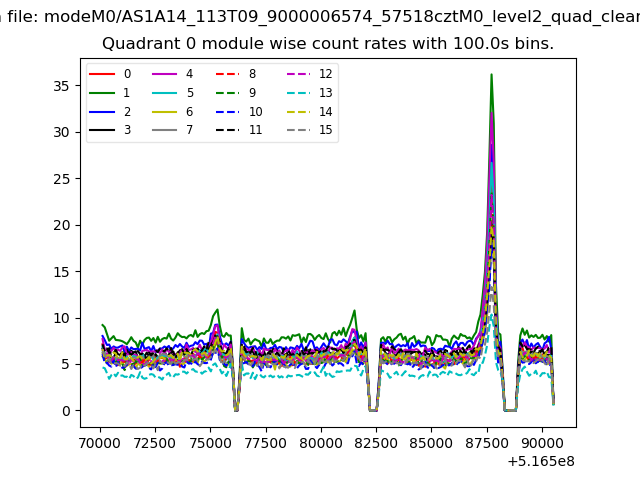 |
 |
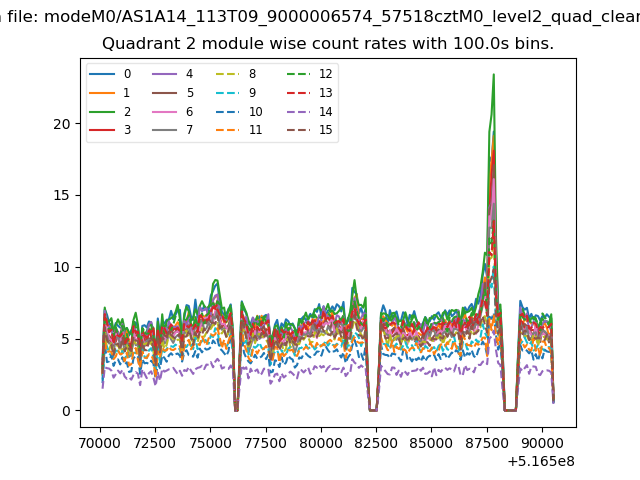
| Module-wise count rates for Quadrant B Data is divided into 100 sec bins |
 |
 |
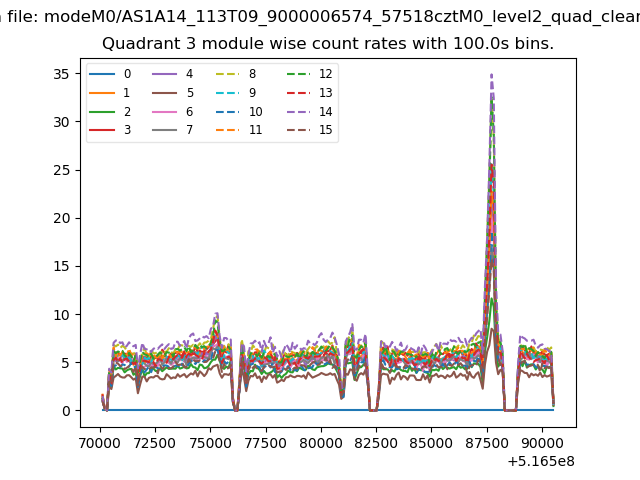
| Module-wise count rates for Quadrant C Data is divided into 100 sec bins |
 |
 |
| Module-wise count rates for Quadrant D Data is divided into 100 sec bins |
 |
 |
| Parameter | Plot |
|---|---|
| CZT HV Monitor | 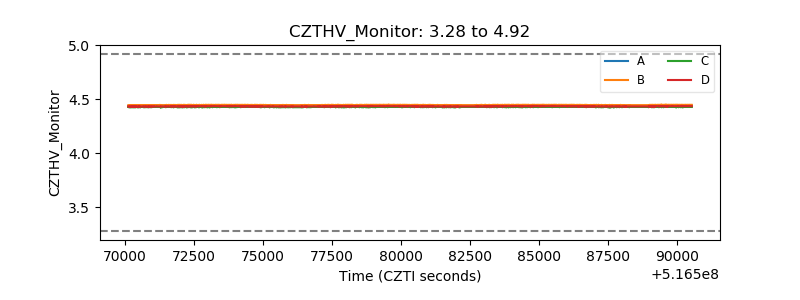 |
| D_VDD | 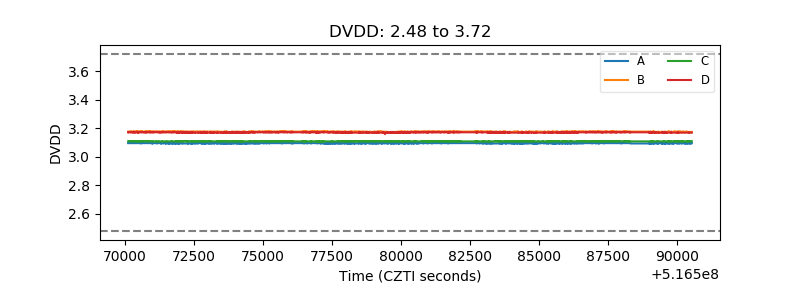 |
| Temperature 1 | 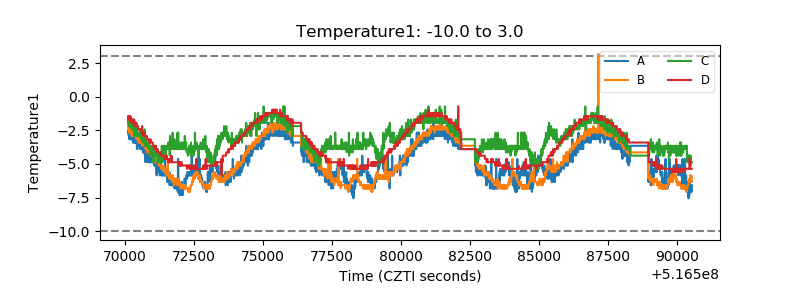 |
| Veto HV Monitor | 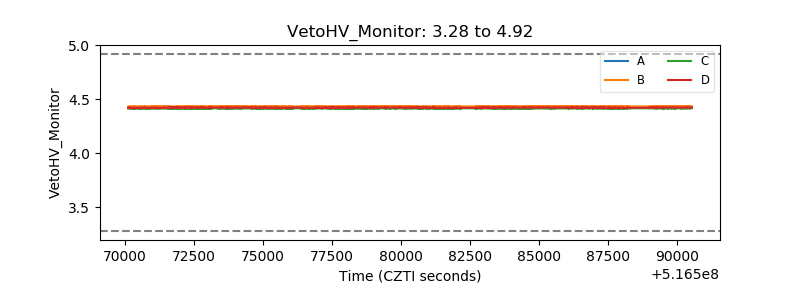 |
| Veto LLD | 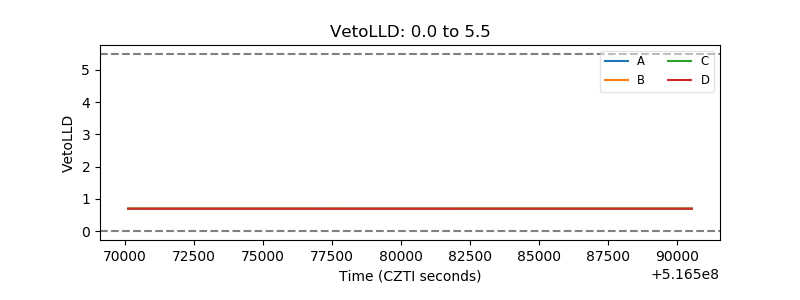 |
| Alpha Counter | 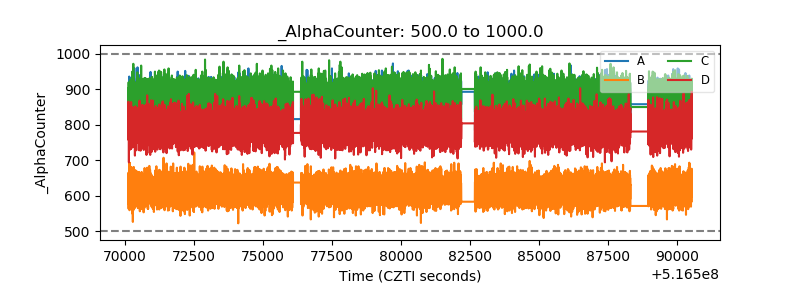 |
| _CPM_Rate | 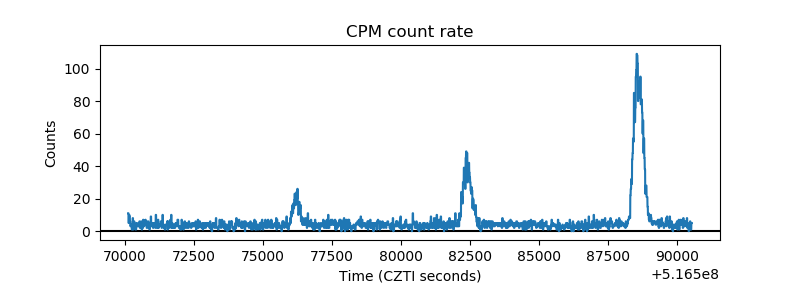 |
| CZT Counter | 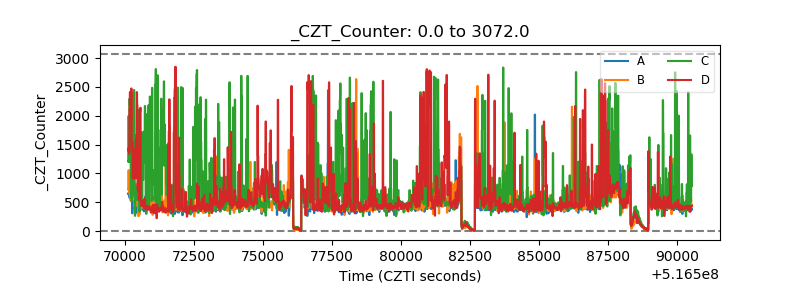 |
| +2.5 Volts monitor | 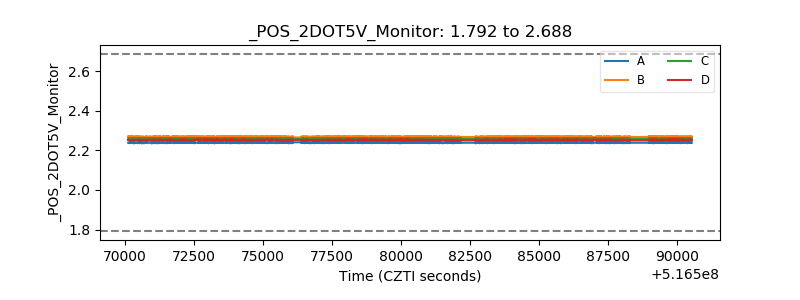 |
| +5 Volts monitor |  |
| _ROLL_ROT | 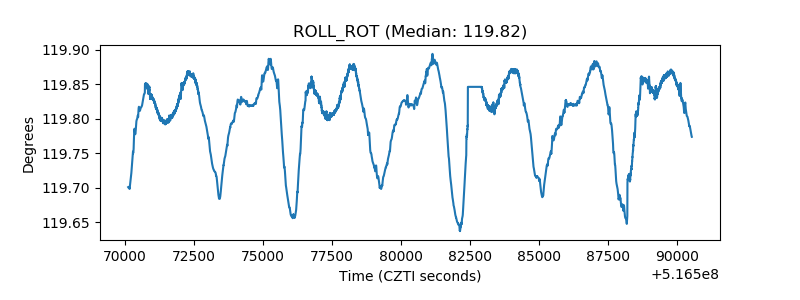 |
| _Roll_DEC | 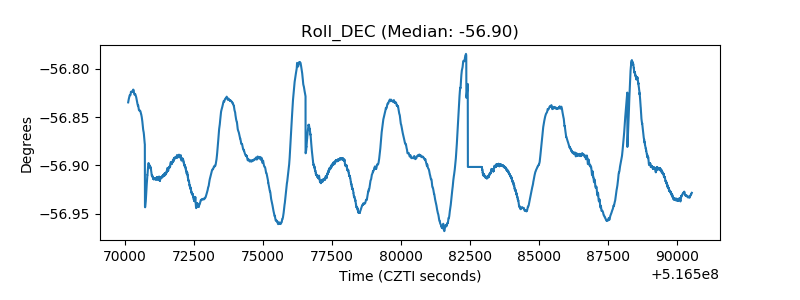 |
| _Roll_RA | 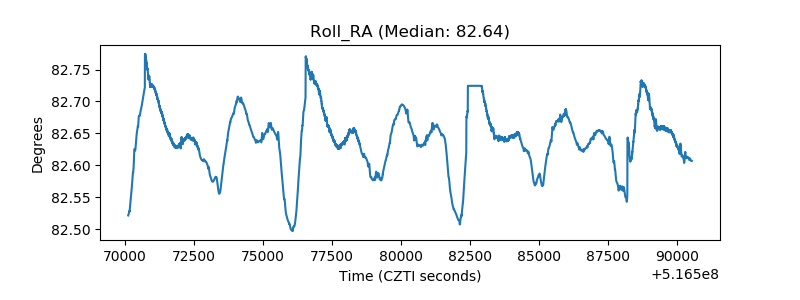 |
| Veto Counter | 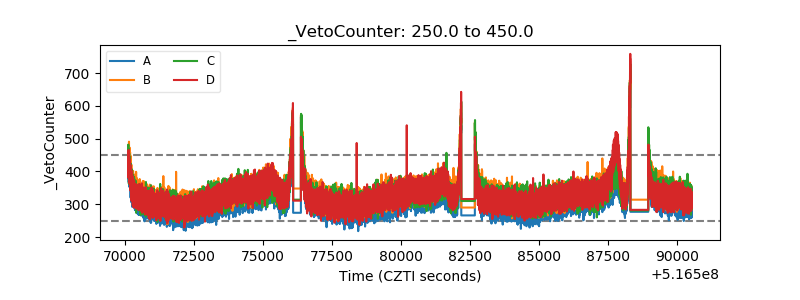 |