| Param | Original file | Final file |
|---|---|---|
| Filename | modeM0/AS1A14_113T09_9000006574_57519cztM0_level2.fits | modeM0/AS1A14_113T09_9000006574_57519cztM0_level2_quad_clean.evt |
| Size (bytes) | 488,589,120 | 98,110,080 |
| Size | 466.0 MB | 93.6 MB |
| Events in quadrant A | 3,358,807 | 666,087 |
| Events in quadrant B | 3,442,021 | 703,101 |
| Events in quadrant C | 6,571,040 | 531,085 |
| Events in quadrant D | 4,167,510 | 581,056 |
| Mode SS | |||
|---|---|---|---|
| Quadrant | BADHDUFLAG | Total packets | Discarded packets |
| A | 0 | 144 | 0 |
| B | 0 | 144 | 0 |
| C | 0 | 144 | 0 |
| D | 0 | 144 | 0 |
| Mode M9 | |||
|---|---|---|---|
| Quadrant | BADHDUFLAG | Total packets | Discarded packets |
| A | 0 | 15 | 0 |
| B | 0 | 15 | 0 |
| C | 0 | 15 | 0 |
| D | 0 | 15 | 0 |
| Mode M0 | |||
|---|---|---|---|
| Quadrant | BADHDUFLAG | Total packets | Discarded packets |
| A | 0 | 15250 | 2 |
| B | 0 | 15119 | 2 |
| C | 0 | 24388 | 2 |
| D | 0 | 17413 | 2 |
| Quadrant | Total seconds | Saturated seconds | Saturation percentage |
|---|---|---|---|
| A | 7026 | 108 | 1.537148% |
| B | 7026 | 165 | 2.348420% |
| C | 7026 | 1236 | 17.591802% |
| D | 7026 | 331 | 4.711073% |
Noise dominated data is calculated using 1-second bins in cleaned event files. If a bin has >2000 counts, and if more than 50% of those come from <1% of pixels, then it is considered to be noise-dominated and hence unusable.
| Quadrant | # 1 sec bins | Bins with >0 counts | Bins with >2000 counts | High rate bins dominated by noise | Noise dominated (total time) | Noise dominated (detector-on time) | Marked lightcurve |
|---|---|---|---|---|---|---|---|
| A | 8462 | 7028 | 3 | 3 | 0.04% | 0.04% | 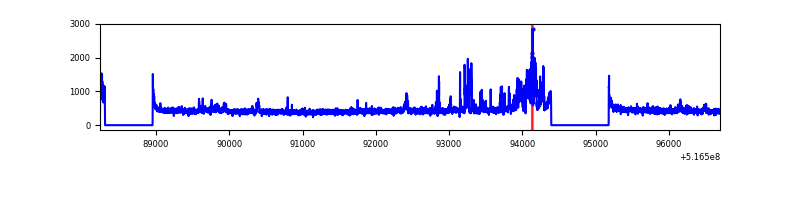 |
| B | 8462 | 7028 | 29 | 29 | 0.34% | 0.41% | 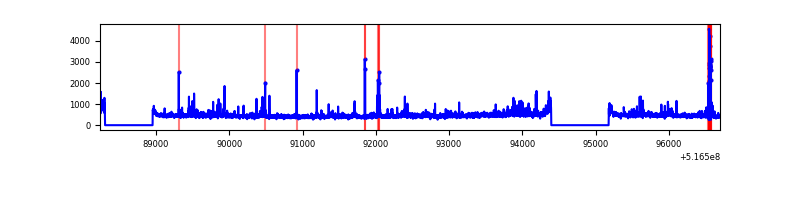 |
| C | 8462 | 7028 | 866 | 866 | 10.23% | 12.32% | 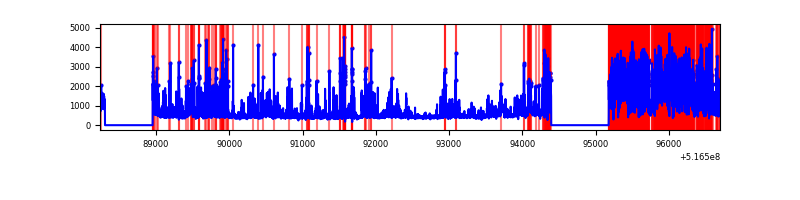 |
| D | 8462 | 7028 | 230 | 230 | 2.72% | 3.27% | 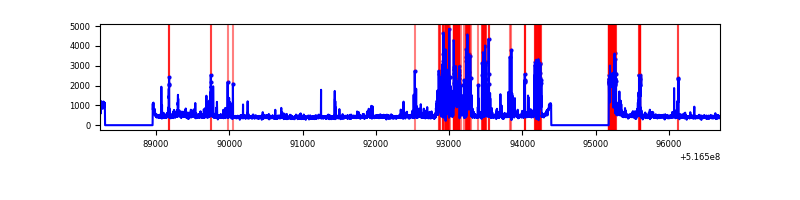 |
Top three noisy pixels from each quadrant. If the there are fewer than three noisy pixels in the level2.evt file, extra rows are filled as -1
| Pixel properties | Quadrant properties | ||||||
|---|---|---|---|---|---|---|---|
| Quadrant | DetID | PixID | Counts | Sigma | Mean | Median | Sigma |
| A | 13 | 248 | 228444 | 1196.76 | 767 | 744 | 190.3 |
| A | 3 | 14 | 88073 | 458.99 | 767 | 744 | 190.3 |
| A | 7 | 14 | 56158 | 291.25 | 767 | 744 | 190.3 |
| B | 4 | 206 | 137176 | 839.2 | 757 | 726 | 162.6 |
| B | 9 | 251 | 81682 | 497.9 | 757 | 726 | 162.6 |
| B | 7 | 252 | 55243 | 335.29 | 757 | 726 | 162.6 |
| C | 15 | 224 | 2590315 | 13985.97 | 682 | 674 | 185.2 |
| C | 6 | 223 | 882313 | 4761.5 | 682 | 674 | 185.2 |
| C | 14 | 254 | 225936 | 1216.58 | 682 | 674 | 185.2 |
| D | 8 | 240 | 477924 | 2345.43 | 728 | 696 | 203.5 |
| D | 0 | 19 | 417331 | 2047.64 | 728 | 696 | 203.5 |
| D | 3 | 12 | 126918 | 620.34 | 728 | 696 | 203.5 |
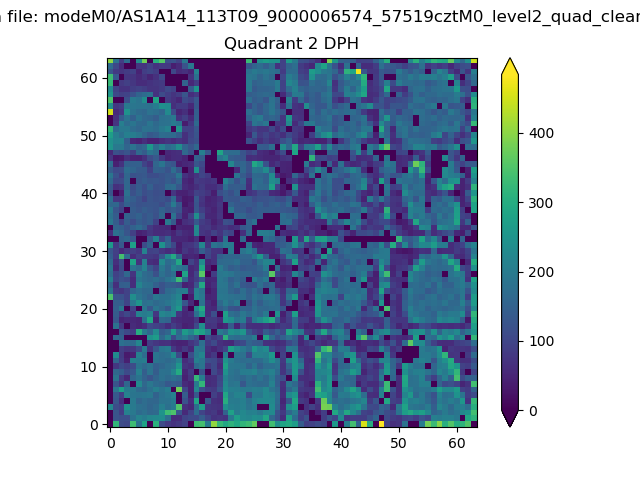
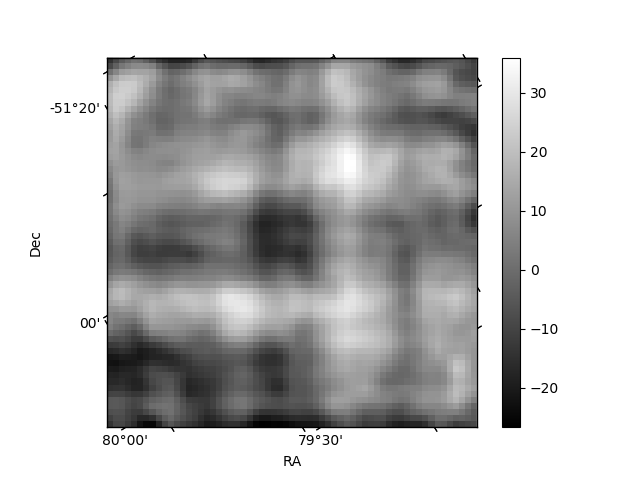
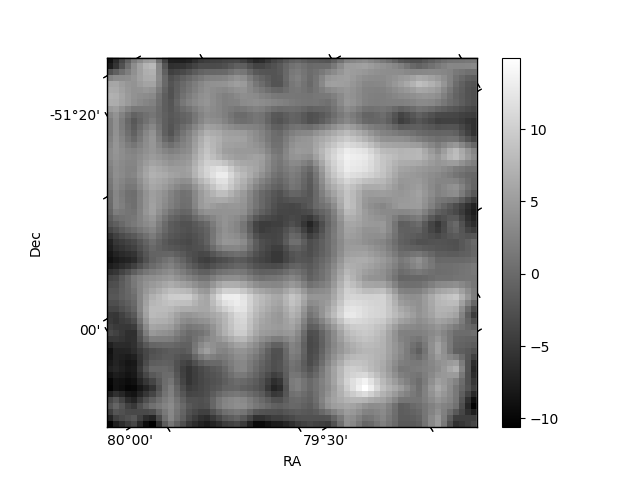
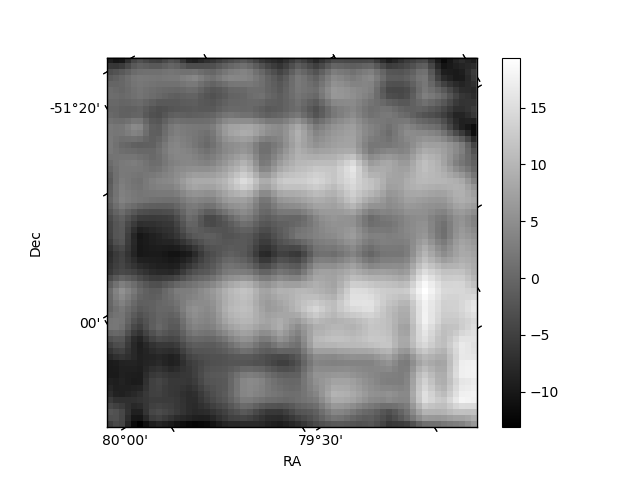
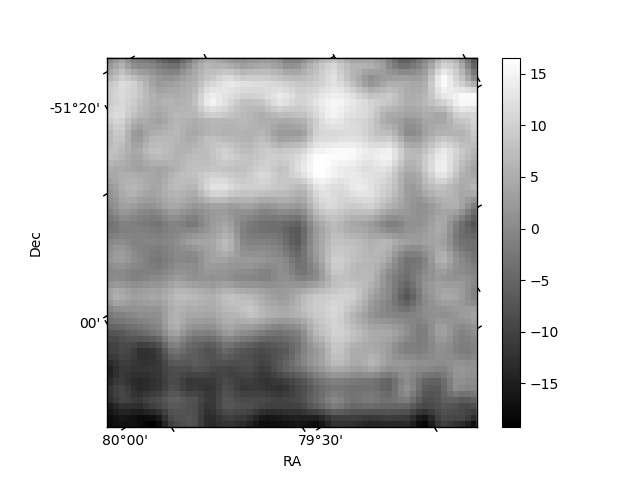
Histogram calculated using DETX and DETY for each event in the final _common_clean file
| Quadrant A | 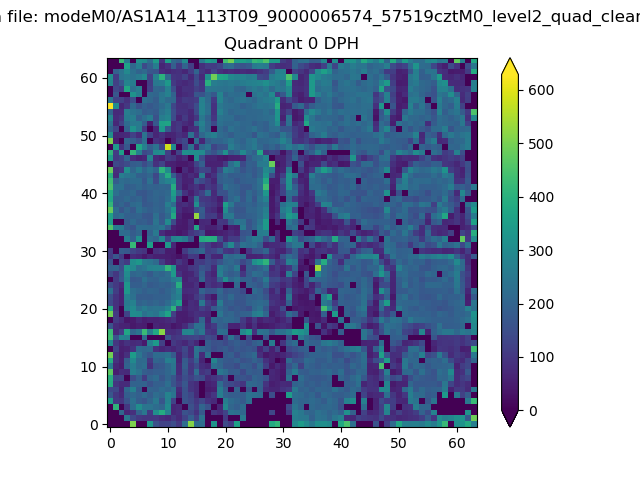 |
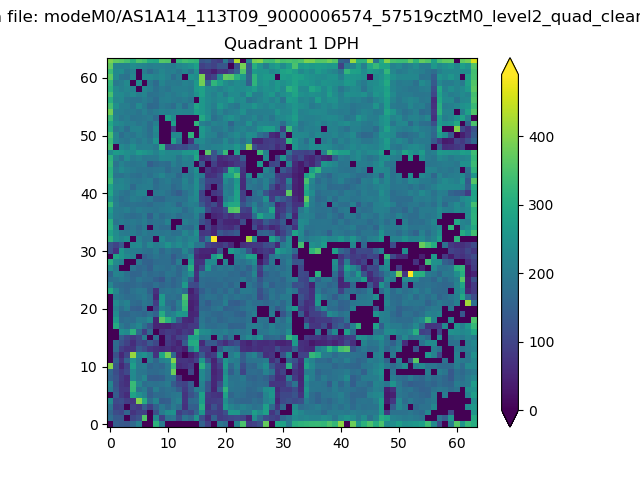 |
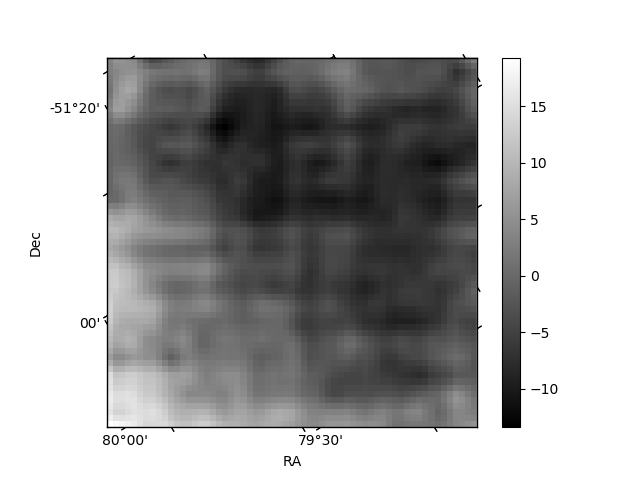
Quadrant B |
|---|---|---|---|
| Quadrant D | 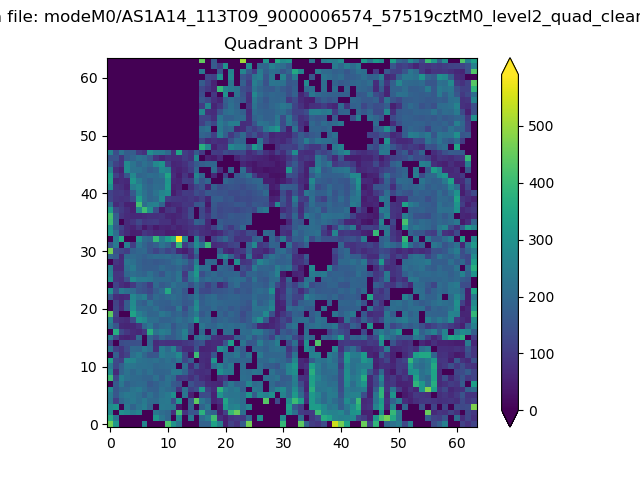 |
 |
Quadrant C |
| Plot type | Count rate plots | Images |
|---|---|---|
| Comparison with Poisson distribution Blue bars denote a histogram of data divided into 1 sec bins. Red curve is a Poisson curve with rate = median count rate of data. |
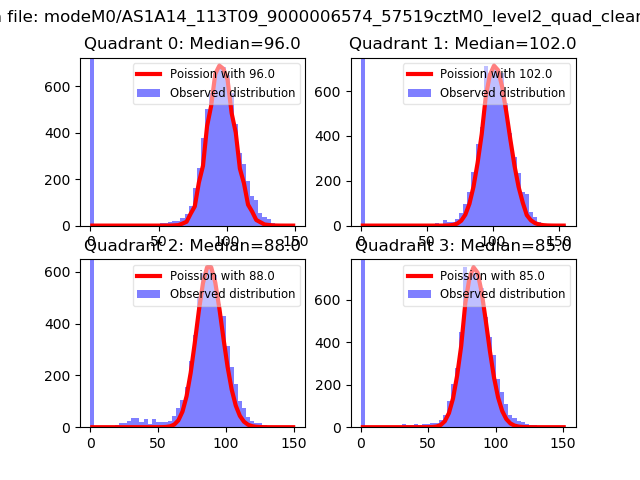 |
 |
| Quadrant-wise count rates Data is divided into 100 sec bins |
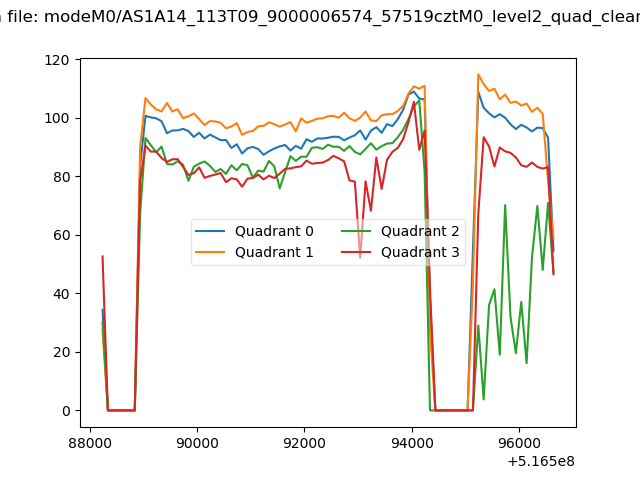 |
|
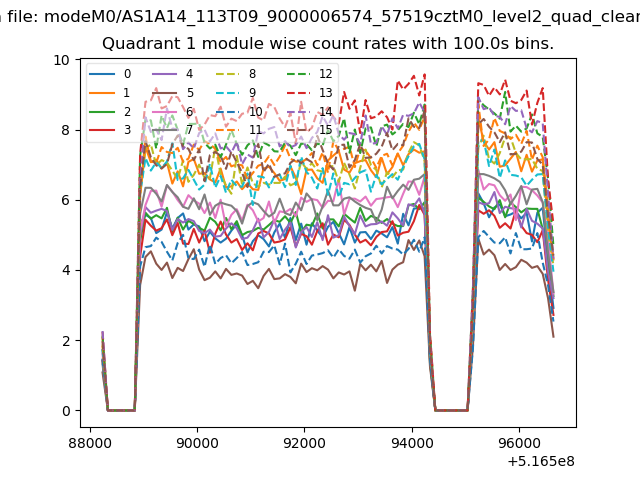
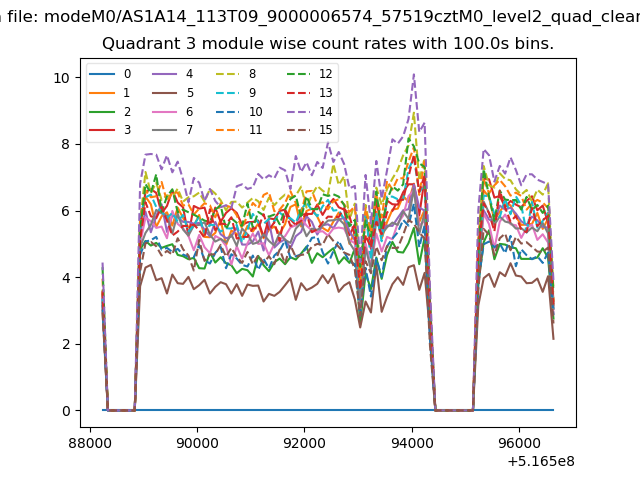
| Module-wise count rates for Quadrant A Data is divided into 100 sec bins |
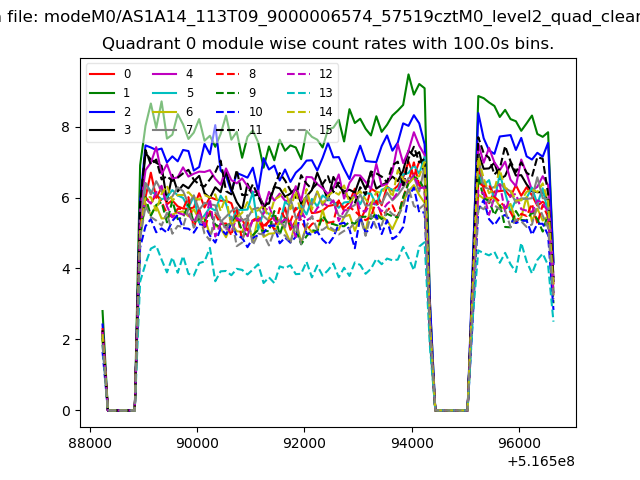 |
 |
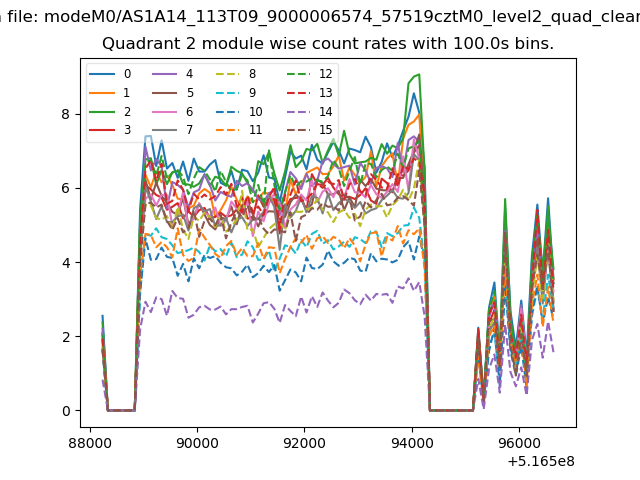
| Module-wise count rates for Quadrant B Data is divided into 100 sec bins |
 |
 |
| Module-wise count rates for Quadrant C Data is divided into 100 sec bins |
 |
 |
| Module-wise count rates for Quadrant D Data is divided into 100 sec bins |
 |
 |
| Parameter | Plot |
|---|---|
| CZT HV Monitor | 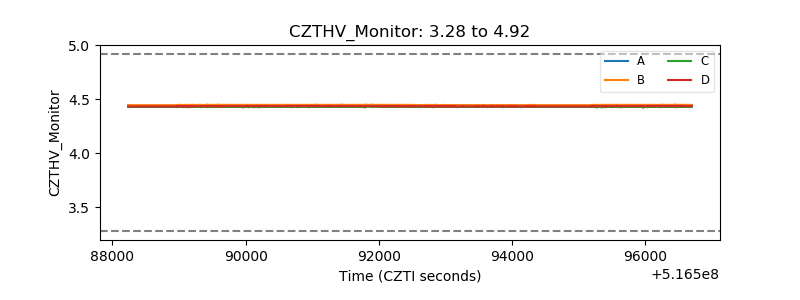 |
| D_VDD | 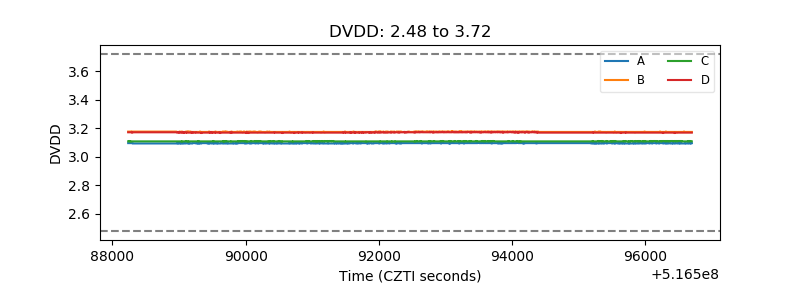 |
| Temperature 1 | 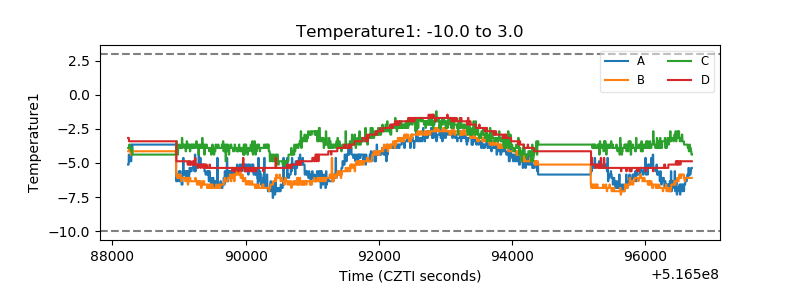 |
| Veto HV Monitor | 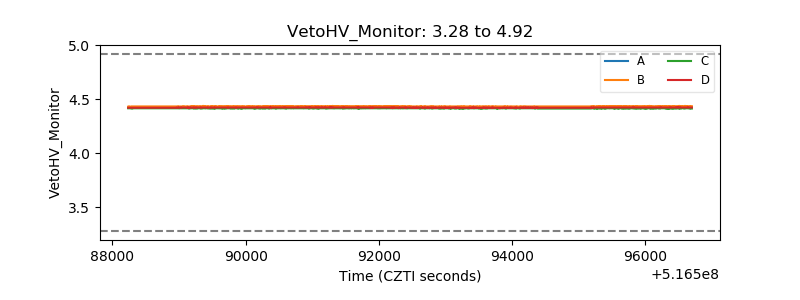 |
| Veto LLD | 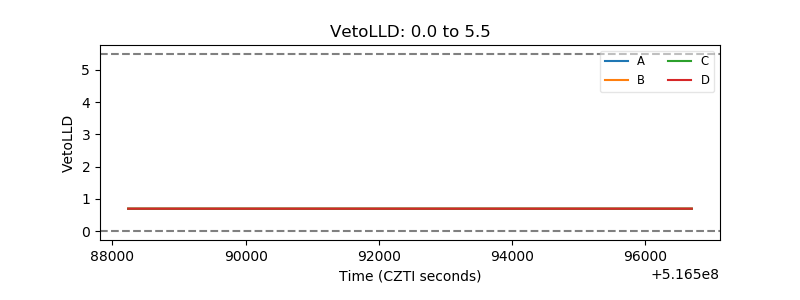 |
| Alpha Counter | 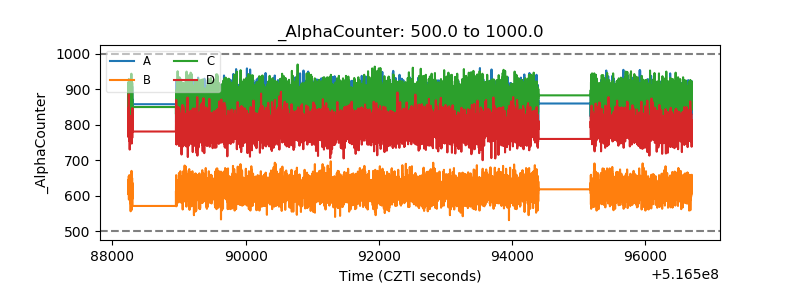 |
| _CPM_Rate | 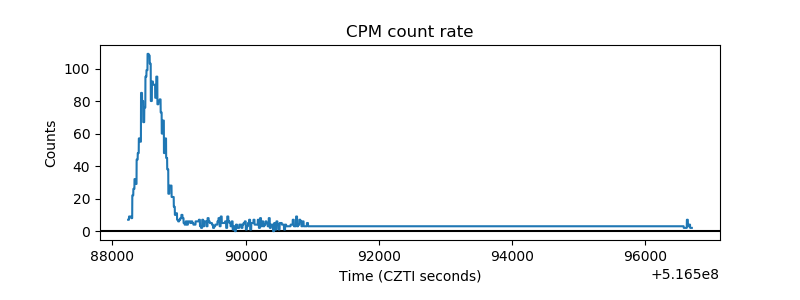 |
| CZT Counter | 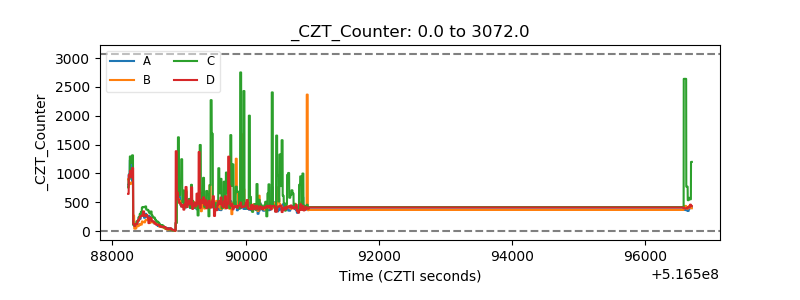 |
| +2.5 Volts monitor | 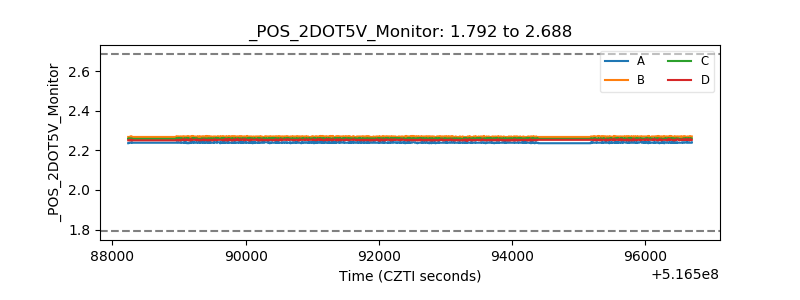 |
| +5 Volts monitor |  |
| _ROLL_ROT | 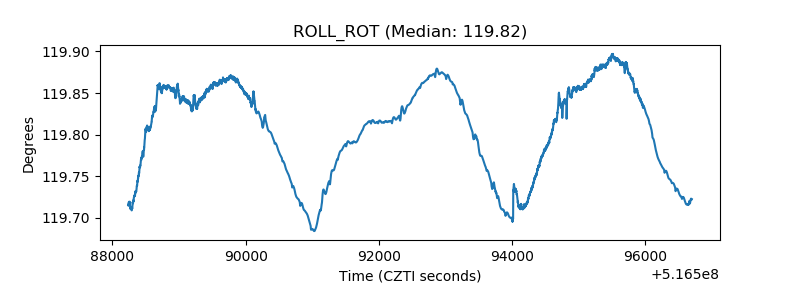 |
| _Roll_DEC | 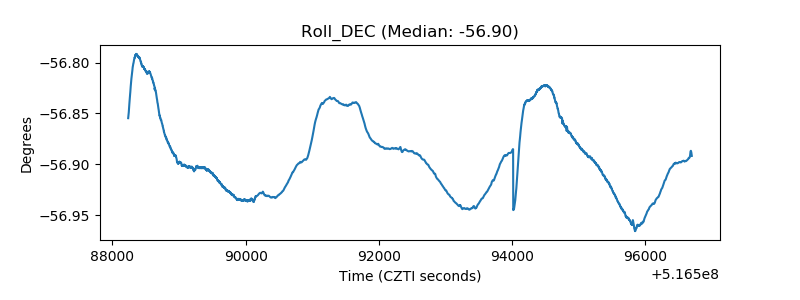 |
| _Roll_RA | 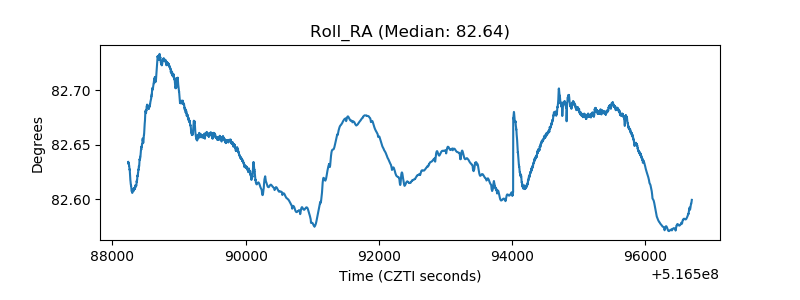 |
| Veto Counter | 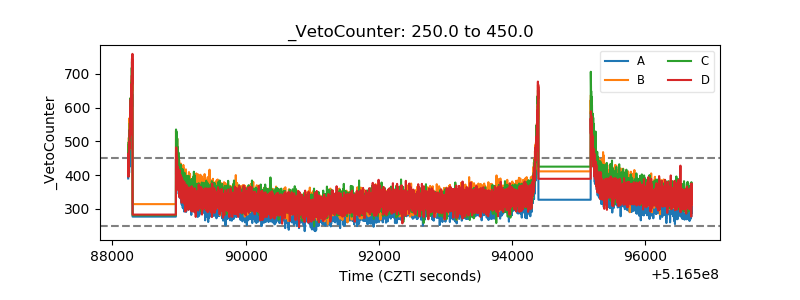 |