| Param | Original file | Final file |
|---|---|---|
| Filename | modeM0/AS1A14_113T09_9000006574_57521cztM0_level2.fits | modeM0/AS1A14_113T09_9000006574_57521cztM0_level2_quad_clean.evt |
| Size (bytes) | 596,223,360 | 101,626,560 |
| Size | 568.6 MB | 96.9 MB |
| Events in quadrant A | 3,089,555 | 727,614 |
| Events in quadrant B | 3,915,458 | 740,025 |
| Events in quadrant C | 9,654,289 | 505,267 |
| Events in quadrant D | 4,881,516 | 629,705 |
| Mode SS | |||
|---|---|---|---|
| Quadrant | BADHDUFLAG | Total packets | Discarded packets |
| A | 0 | 136 | 0 |
| B | 0 | 136 | 0 |
| C | 0 | 136 | 0 |
| D | 0 | 136 | 0 |
| Mode M9 | |||
|---|---|---|---|
| Quadrant | BADHDUFLAG | Total packets | Discarded packets |
| A | 0 | 10 | 0 |
| B | 0 | 10 | 0 |
| C | 0 | 10 | 0 |
| D | 0 | 10 | 0 |
| Mode M0 | |||
|---|---|---|---|
| Quadrant | BADHDUFLAG | Total packets | Discarded packets |
| A | 0 | 14214 | 2 |
| B | 0 | 16290 | 2 |
| C | 0 | 33416 | 2 |
| D | 0 | 19375 | 2 |
| Quadrant | Total seconds | Saturated seconds | Saturation percentage |
|---|---|---|---|
| A | 6815 | 60 | 0.880411% |
| B | 6816 | 229 | 3.359742% |
| C | 6816 | 2401 | 35.225939% |
| D | 6816 | 577 | 8.465376% |
Noise dominated data is calculated using 1-second bins in cleaned event files. If a bin has >2000 counts, and if more than 50% of those come from <1% of pixels, then it is considered to be noise-dominated and hence unusable.
| Quadrant | # 1 sec bins | Bins with >0 counts | Bins with >2000 counts | High rate bins dominated by noise | Noise dominated (total time) | Noise dominated (detector-on time) | Marked lightcurve |
|---|---|---|---|---|---|---|---|
| A | 7745 | 6816 | 1 | 1 | 0.01% | 0.01% | 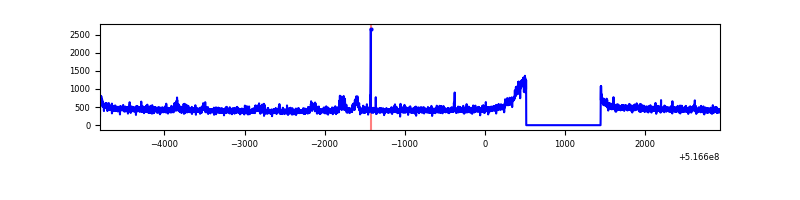 |
| B | 7746 | 6817 | 103 | 103 | 1.33% | 1.51% | 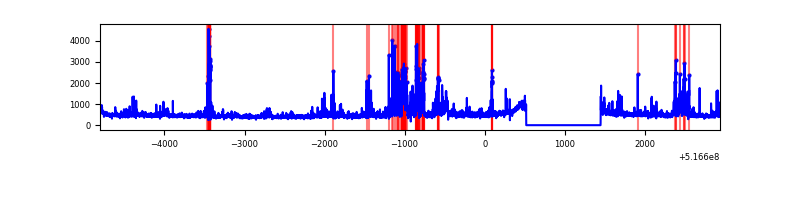 |
| C | 7746 | 6817 | 1769 | 1769 | 22.84% | 25.95% | 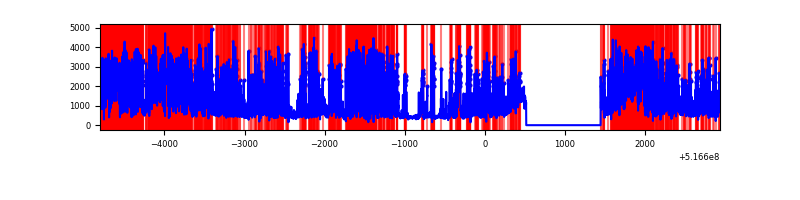 |
| D | 7746 | 6817 | 449 | 449 | 5.80% | 6.59% | 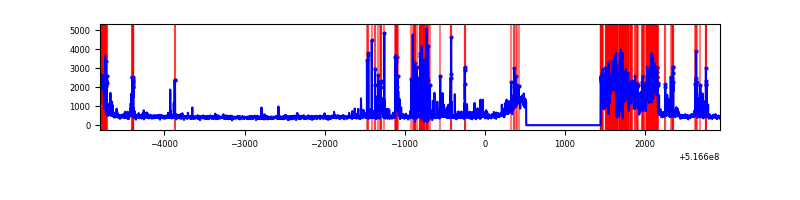 |
Top three noisy pixels from each quadrant. If the there are fewer than three noisy pixels in the level2.evt file, extra rows are filled as -1
| Pixel properties | Quadrant properties | ||||||
|---|---|---|---|---|---|---|---|
| Quadrant | DetID | PixID | Counts | Sigma | Mean | Median | Sigma |
| A | 3 | 14 | 82028 | 414.0 | 772 | 754 | 196.3 |
| A | 13 | 248 | 11134 | 52.87 | 772 | 754 | 196.3 |
| A | 4 | 3 | 9522 | 44.66 | 772 | 754 | 196.3 |
| B | 9 | 251 | 346483 | 2174.94 | 747 | 721 | 159.0 |
| B | 5 | 185 | 263197 | 1651.05 | 747 | 721 | 159.0 |
| B | 4 | 206 | 196737 | 1233.0 | 747 | 721 | 159.0 |
| C | 15 | 224 | 6076406 | 33290.98 | 644 | 636 | 182.5 |
| C | 6 | 223 | 785831 | 4302.32 | 644 | 636 | 182.5 |
| C | 14 | 254 | 128574 | 701.01 | 644 | 636 | 182.5 |
| D | 15 | 142 | 788213 | 3683.5 | 735 | 701 | 213.8 |
| D | 8 | 240 | 580676 | 2712.77 | 735 | 701 | 213.8 |
| D | 0 | 19 | 229003 | 1067.86 | 735 | 701 | 213.8 |
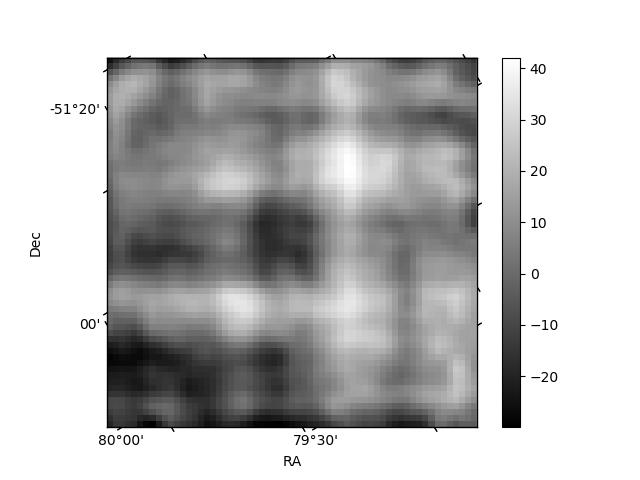
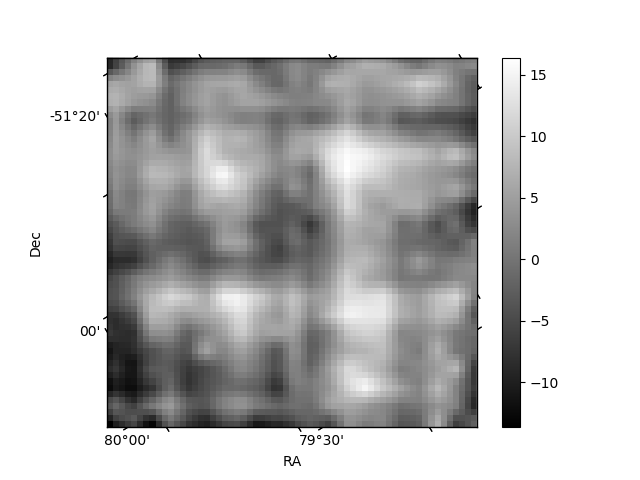
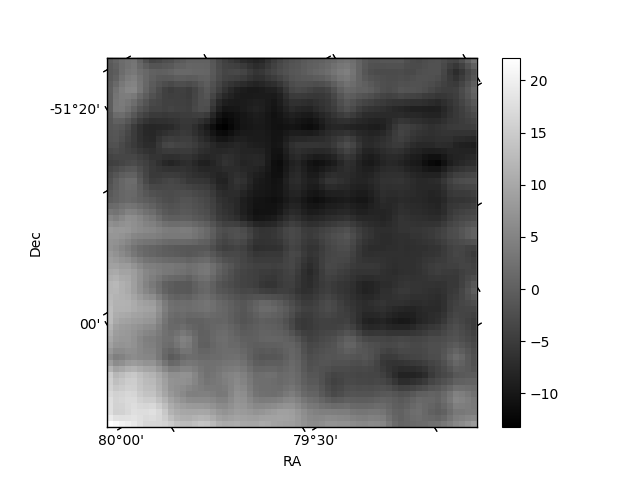
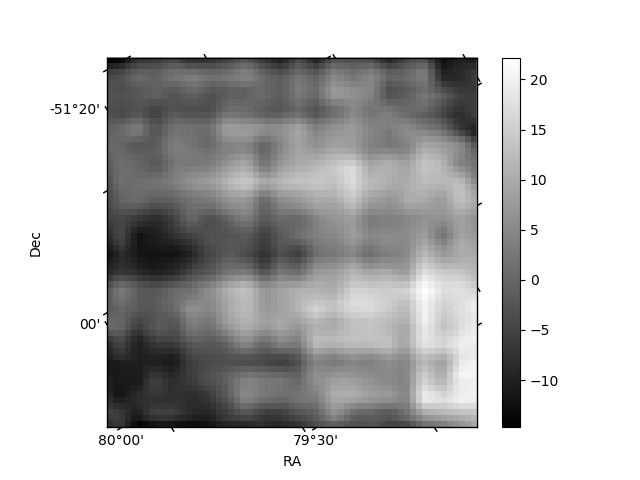
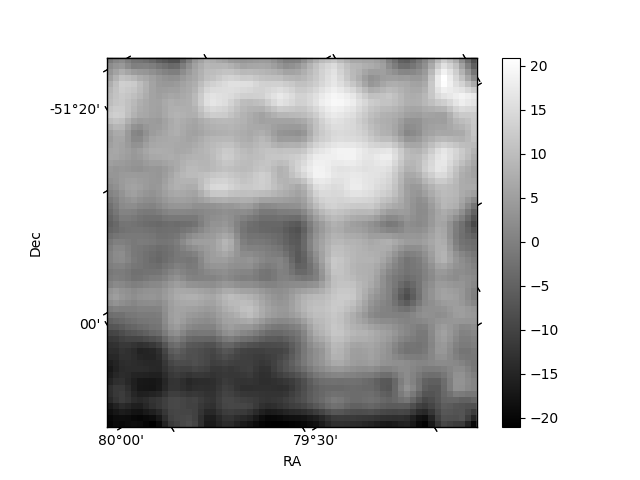
Histogram calculated using DETX and DETY for each event in the final _common_clean file
| Quadrant A | 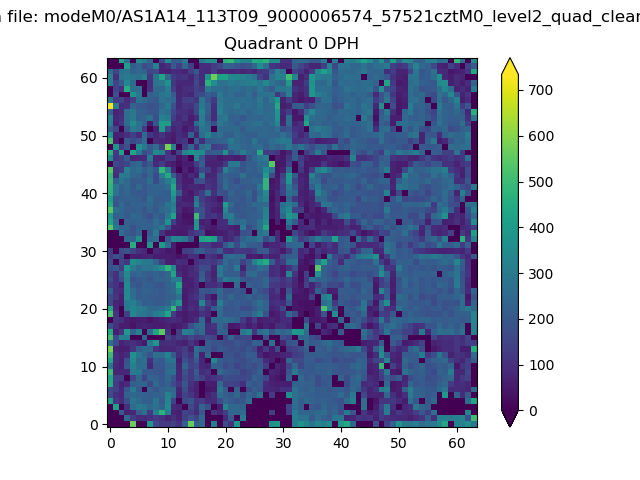 |
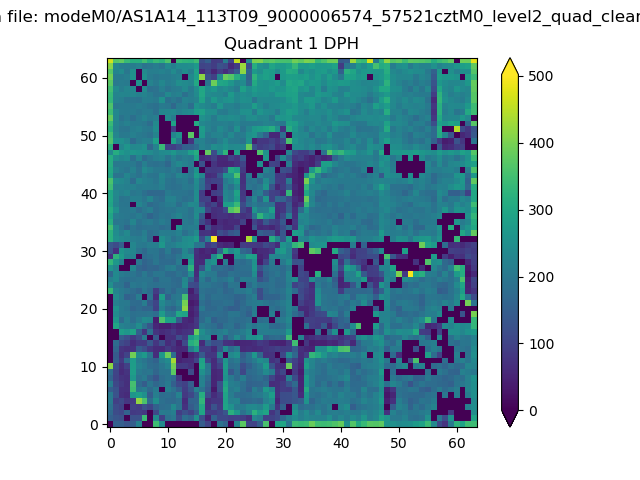 |
Quadrant B |
|---|---|---|---|
| Quadrant D | 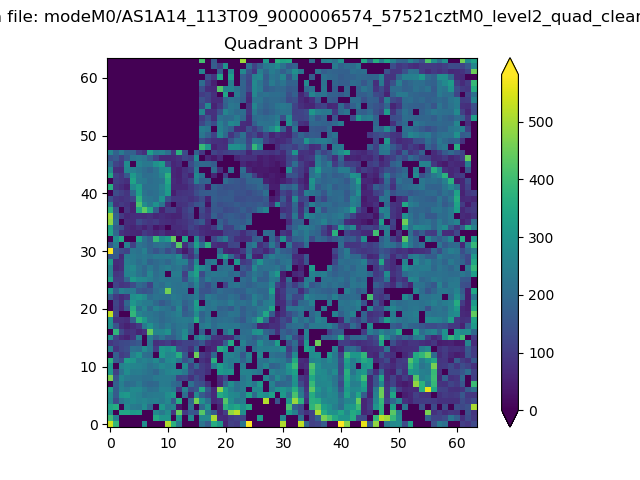 |
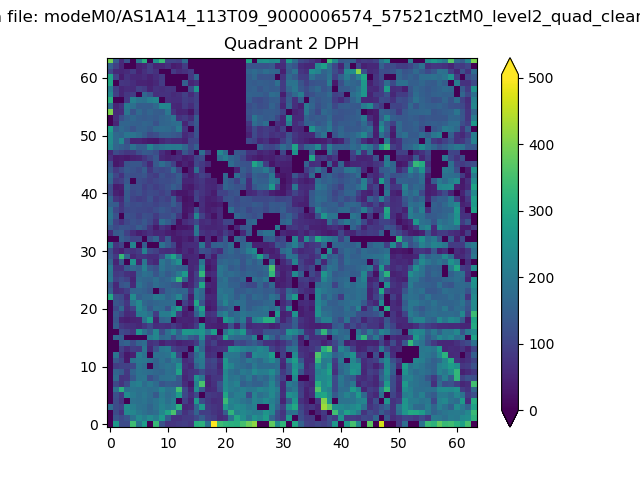 |
Quadrant C |
| Plot type | Count rate plots | Images |
|---|---|---|
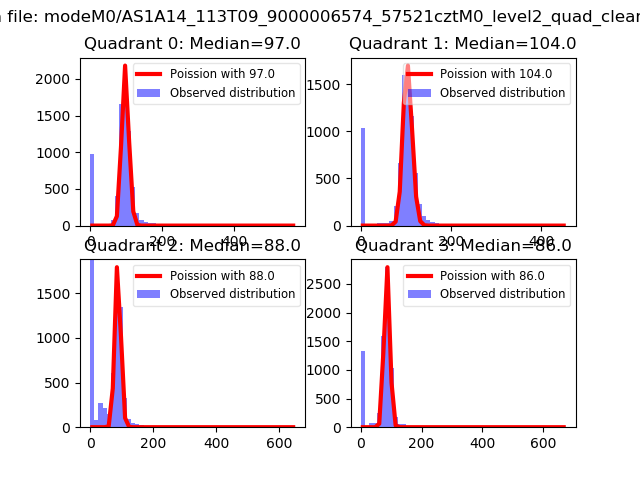
| Comparison with Poisson distribution Blue bars denote a histogram of data divided into 1 sec bins. Red curve is a Poisson curve with rate = median count rate of data. |
 |
 |
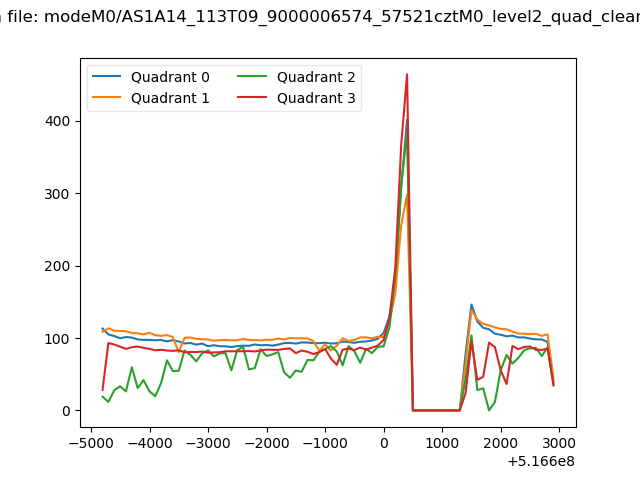
| Quadrant-wise count rates Data is divided into 100 sec bins |
 |
|
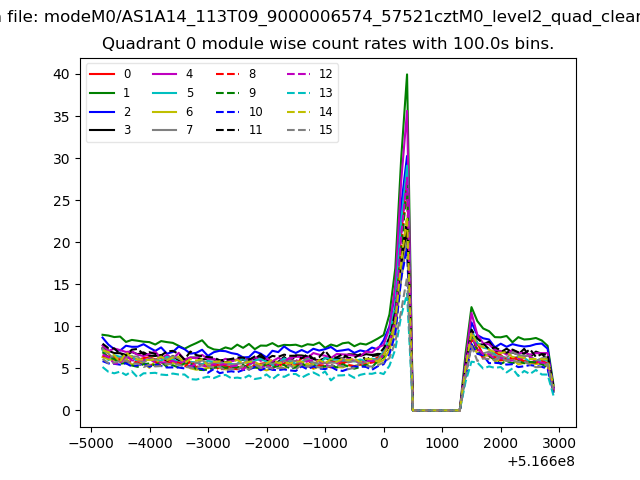
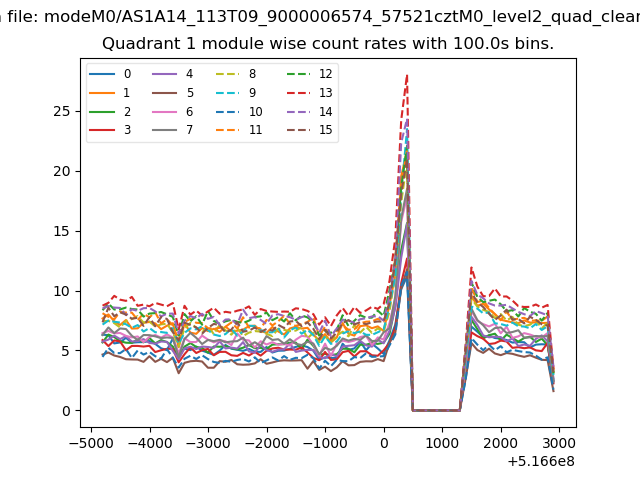
| Module-wise count rates for Quadrant A Data is divided into 100 sec bins |
 |
 |
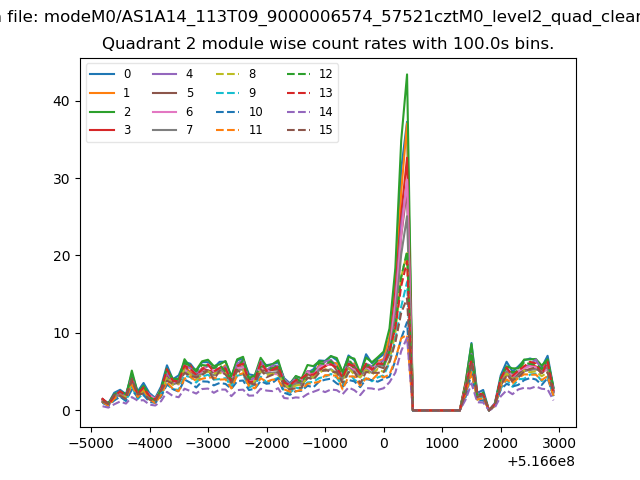
| Module-wise count rates for Quadrant B Data is divided into 100 sec bins |
 |
 |
| Module-wise count rates for Quadrant C Data is divided into 100 sec bins |
 |
 |
| Module-wise count rates for Quadrant D Data is divided into 100 sec bins |
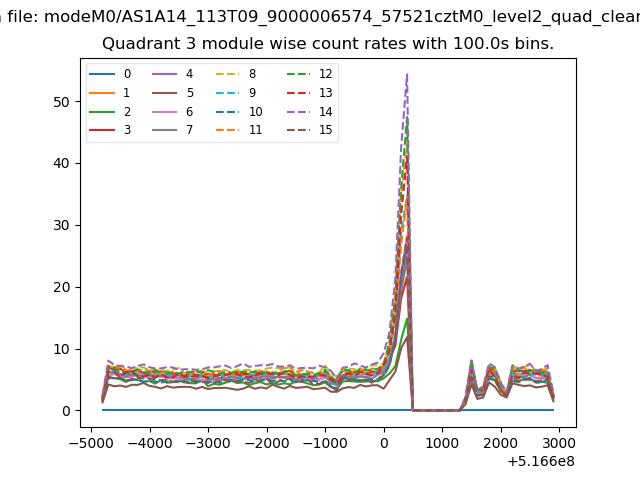 |
 |
| Parameter | Plot |
|---|---|
| CZT HV Monitor |  |
| D_VDD | 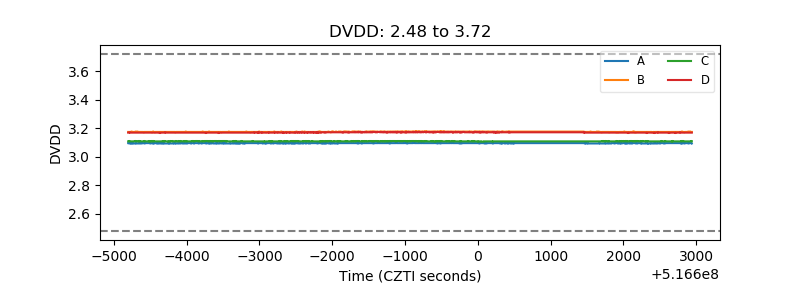 |
| Temperature 1 | 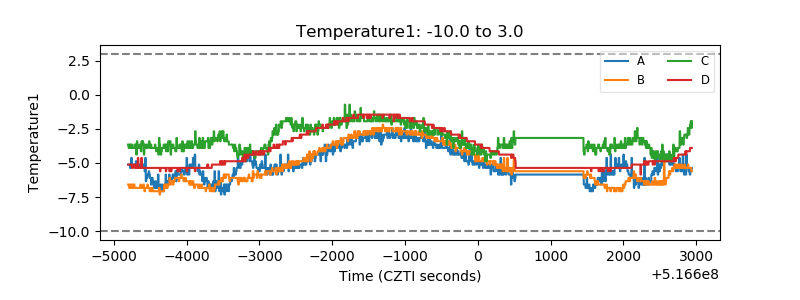 |
| Veto HV Monitor | 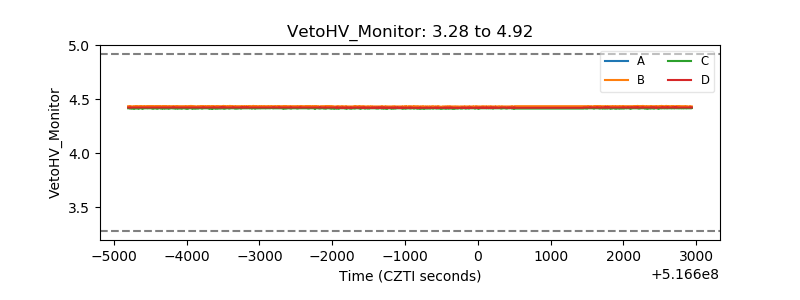 |
| Veto LLD | 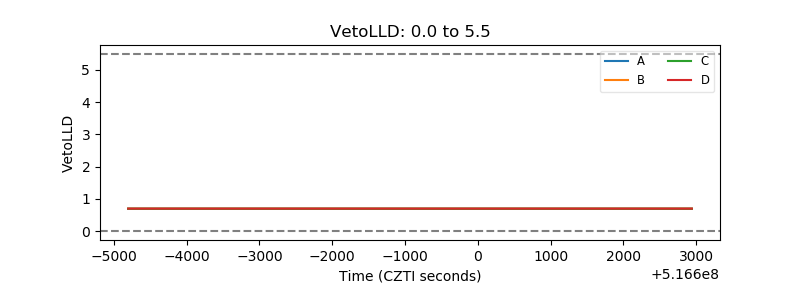 |
| Alpha Counter | 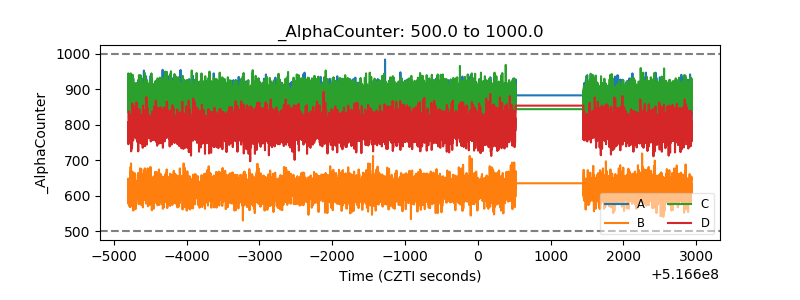 |
| _CPM_Rate | 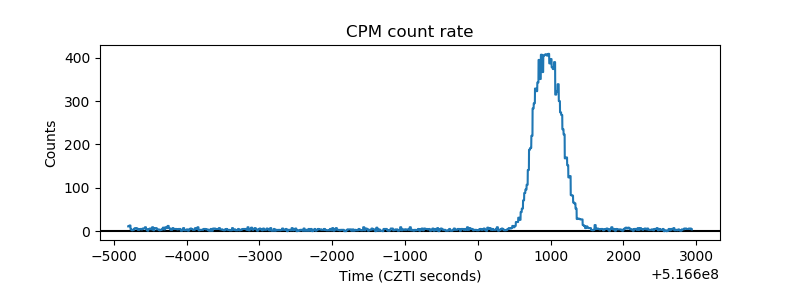 |
| CZT Counter | 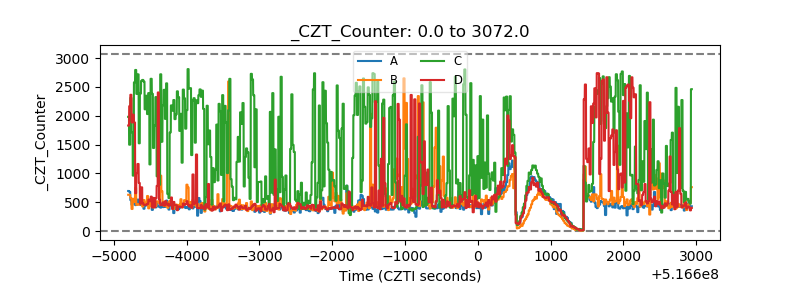 |
| +2.5 Volts monitor | 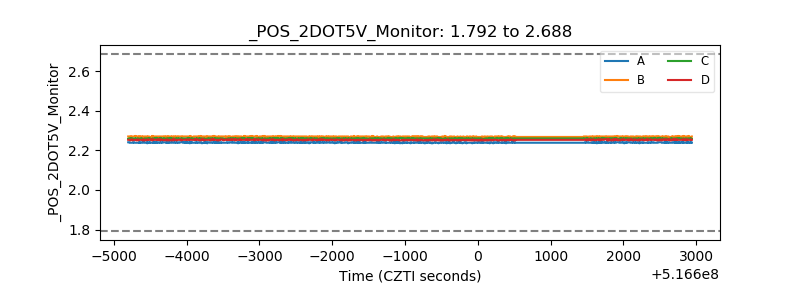 |
| +5 Volts monitor | 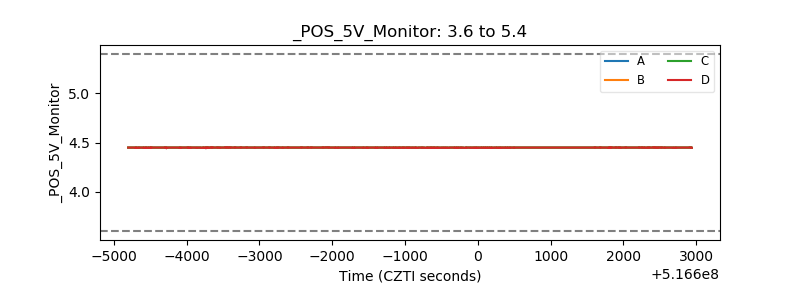 |
| _ROLL_ROT | 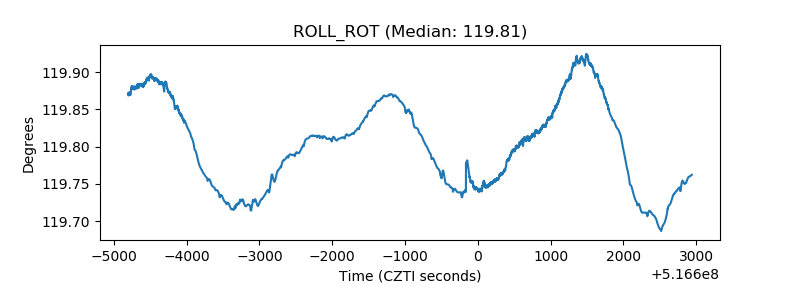 |
| _Roll_DEC | 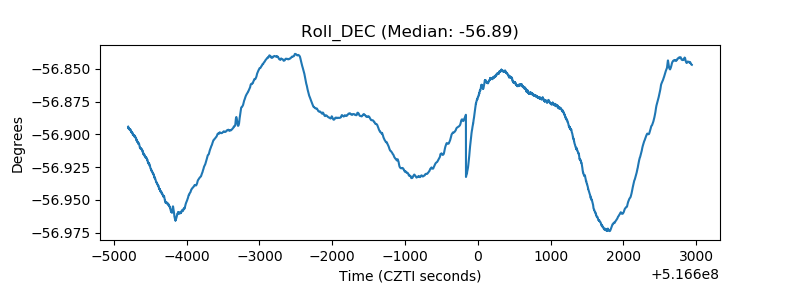 |
| _Roll_RA | 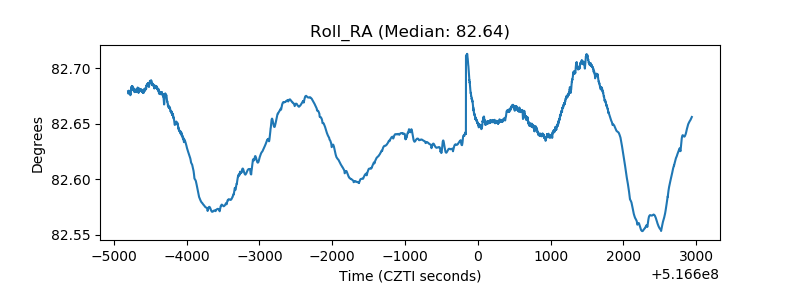 |
| Veto Counter | 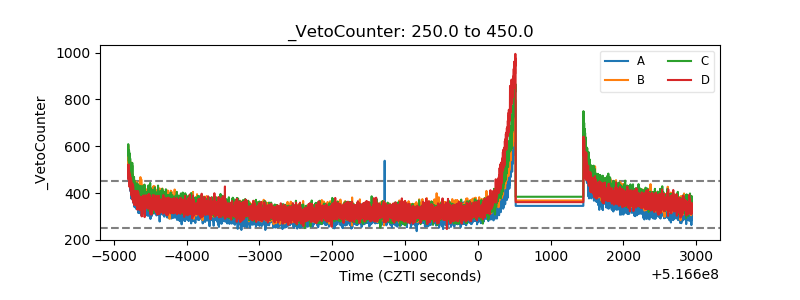 |