| Param | Original file | Final file |
|---|---|---|
| Filename | modeM0/AS1A14_113T09_9000006574_57523cztM0_level2.fits | modeM0/AS1A14_113T09_9000006574_57523cztM0_level2_quad_clean.evt |
| Size (bytes) | 387,172,800 | 92,139,840 |
| Size | 369.2 MB | 87.9 MB |
| Events in quadrant A | 2,673,161 | 607,731 |
| Events in quadrant B | 3,507,984 | 643,208 |
| Events in quadrant C | 4,349,044 | 566,259 |
| Events in quadrant D | 3,325,021 | 545,516 |
| Mode SS | |||
|---|---|---|---|
| Quadrant | BADHDUFLAG | Total packets | Discarded packets |
| A | 0 | 124 | 0 |
| B | 0 | 124 | 0 |
| C | 0 | 124 | 0 |
| D | 0 | 124 | 0 |
| Mode M9 | |||
|---|---|---|---|
| Quadrant | BADHDUFLAG | Total packets | Discarded packets |
| A | 0 | 11 | 0 |
| B | 0 | 11 | 0 |
| C | 0 | 11 | 0 |
| D | 0 | 11 | 0 |
| Mode M0 | |||
|---|---|---|---|
| Quadrant | BADHDUFLAG | Total packets | Discarded packets |
| A | 0 | 12468 | 1 |
| B | 0 | 14426 | 1 |
| C | 0 | 17288 | 1 |
| D | 0 | 14092 | 1 |
| Quadrant | Total seconds | Saturated seconds | Saturation percentage |
|---|---|---|---|
| A | 6122 | 56 | 0.914734% |
| B | 6122 | 194 | 3.168899% |
| C | 6122 | 320 | 5.227050% |
| D | 6122 | 124 | 2.025482% |
Noise dominated data is calculated using 1-second bins in cleaned event files. If a bin has >2000 counts, and if more than 50% of those come from <1% of pixels, then it is considered to be noise-dominated and hence unusable.
| Quadrant | # 1 sec bins | Bins with >0 counts | Bins with >2000 counts | High rate bins dominated by noise | Noise dominated (total time) | Noise dominated (detector-on time) | Marked lightcurve |
|---|---|---|---|---|---|---|---|
| A | 7217 | 6123 | 0 | 0 | 0.00% | 0.00% | 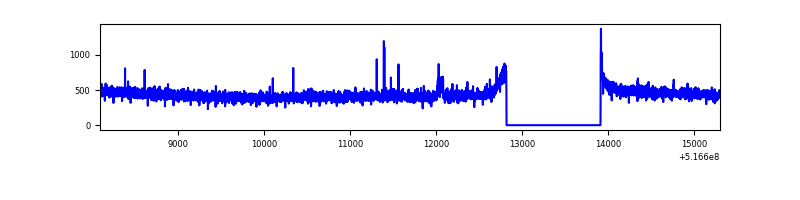 |
| B | 7217 | 6123 | 73 | 73 | 1.01% | 1.19% | 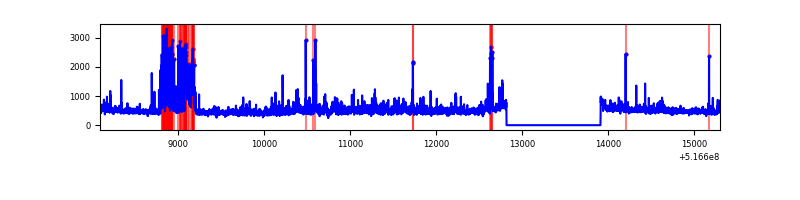 |
| C | 7217 | 6123 | 178 | 178 | 2.47% | 2.91% | 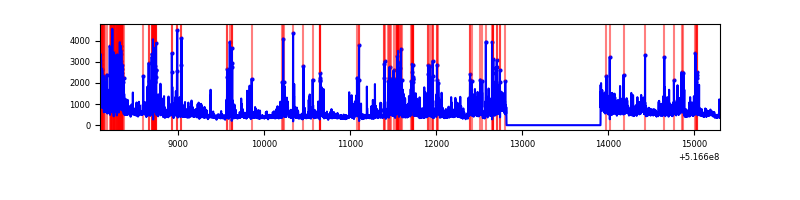 |
| D | 7217 | 6123 | 65 | 65 | 0.90% | 1.06% | 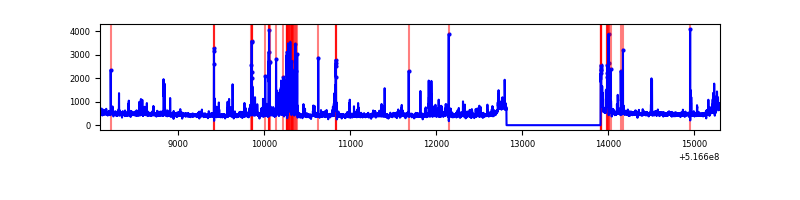 |
Top three noisy pixels from each quadrant. If the there are fewer than three noisy pixels in the level2.evt file, extra rows are filled as -1
| Pixel properties | Quadrant properties | ||||||
|---|---|---|---|---|---|---|---|
| Quadrant | DetID | PixID | Counts | Sigma | Mean | Median | Sigma |
| A | 3 | 14 | 15517 | 88.8 | 681 | 664 | 167.3 |
| A | 3 | 128 | 13497 | 76.72 | 681 | 664 | 167.3 |
| A | 4 | 3 | 9099 | 50.43 | 681 | 664 | 167.3 |
| B | 5 | 185 | 381148 | 2711.55 | 663 | 638 | 140.3 |
| B | 4 | 206 | 333234 | 2370.11 | 663 | 638 | 140.3 |
| B | 10 | 247 | 55399 | 390.23 | 663 | 638 | 140.3 |
| C | 15 | 224 | 1547547 | 8704.57 | 652 | 643 | 177.7 |
| C | 9 | 38 | 112831 | 631.29 | 652 | 643 | 177.7 |
| C | 1 | 16 | 36640 | 202.56 | 652 | 643 | 177.7 |
| D | 2 | 31 | 170066 | 905.74 | 661 | 629 | 187.1 |
| D | 8 | 240 | 129558 | 689.2 | 661 | 629 | 187.1 |
| D | 0 | 19 | 103097 | 547.75 | 661 | 629 | 187.1 |
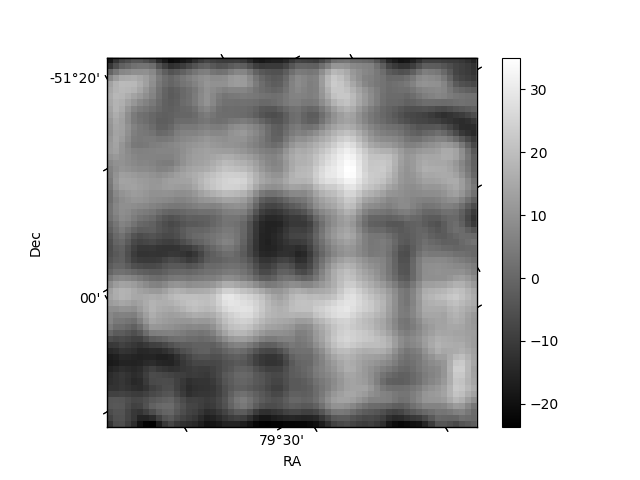
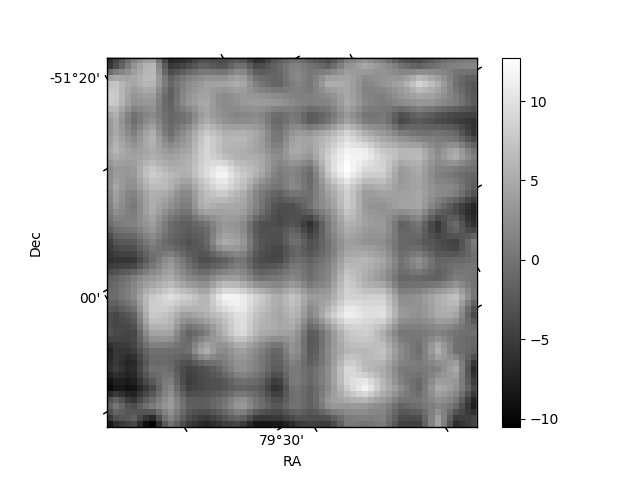
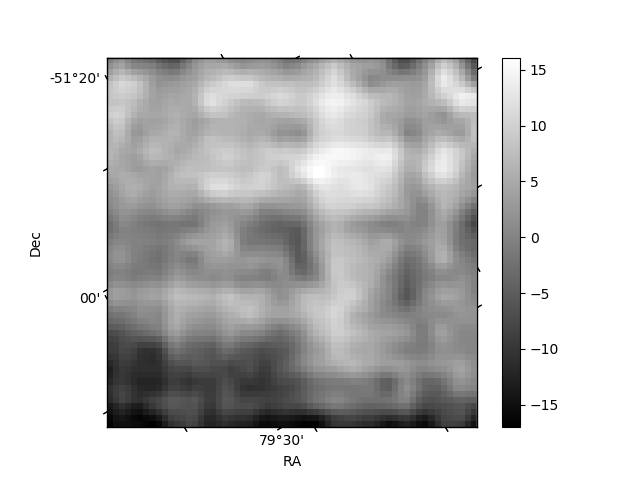
Histogram calculated using DETX and DETY for each event in the final _common_clean file
| Quadrant A | 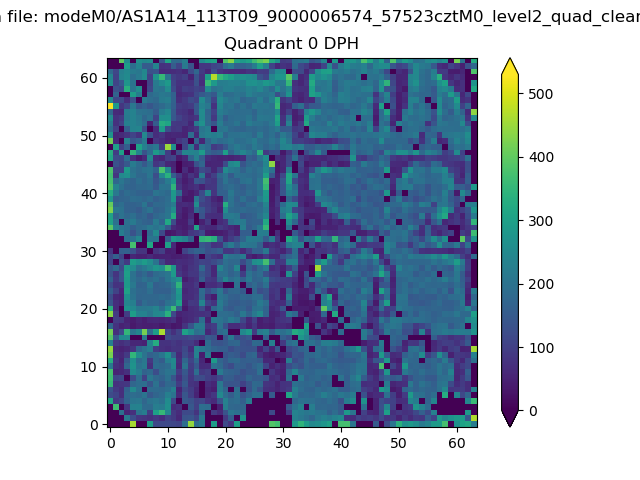 |
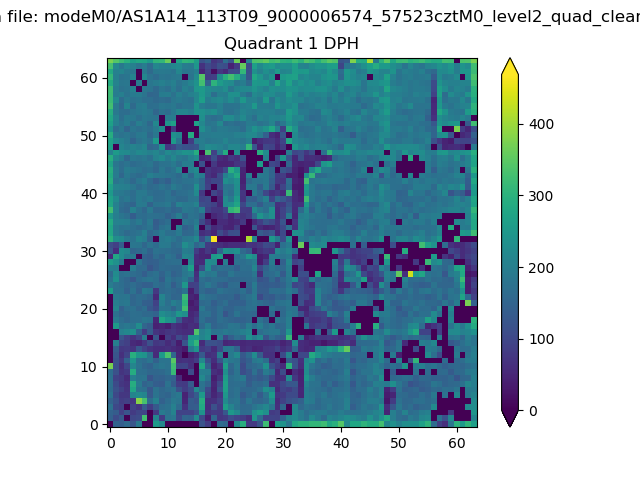 |
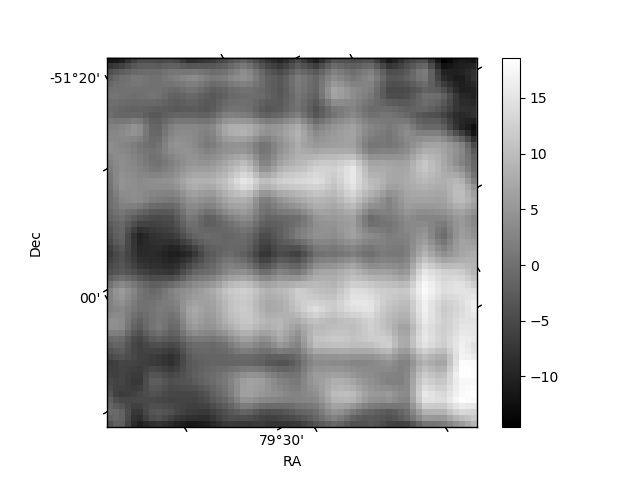
Quadrant B |
|---|---|---|---|
| Quadrant D | 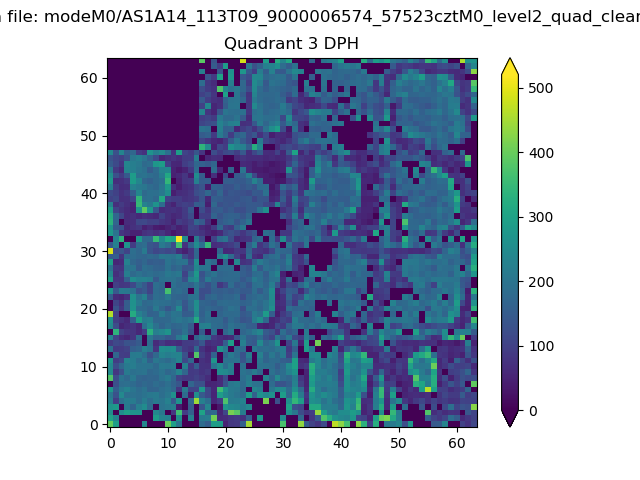 |
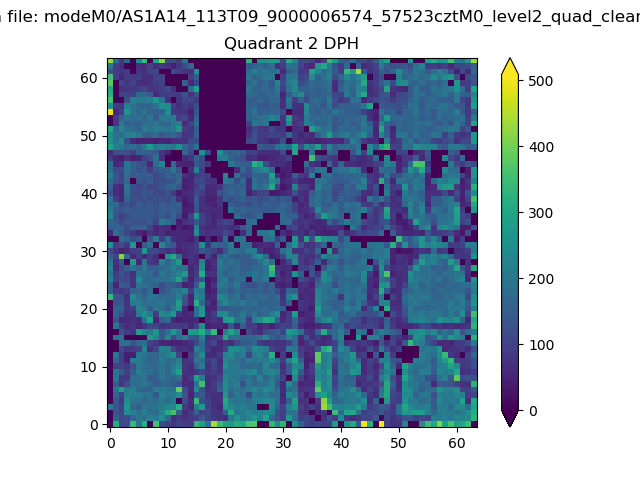 |
Quadrant C |
| Plot type | Count rate plots | Images |
|---|---|---|
| Comparison with Poisson distribution Blue bars denote a histogram of data divided into 1 sec bins. Red curve is a Poisson curve with rate = median count rate of data. |
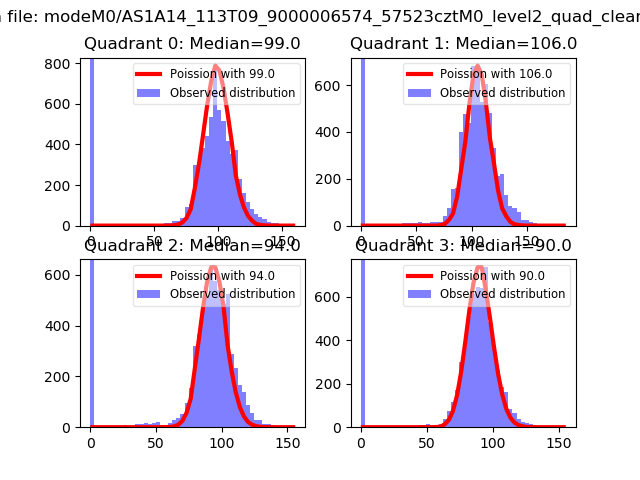 |
 |
| Quadrant-wise count rates Data is divided into 100 sec bins |
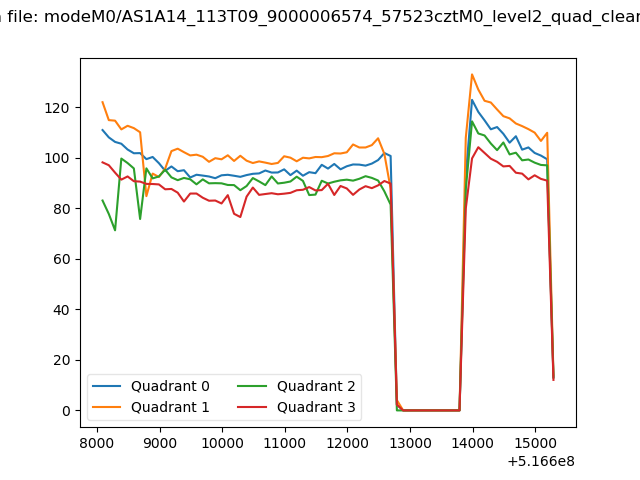 |
|
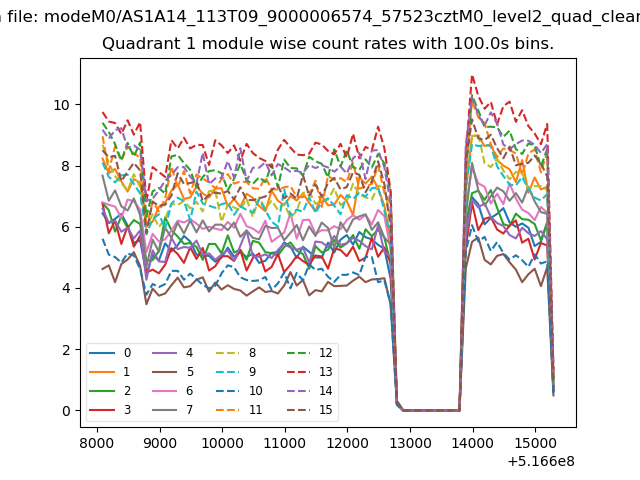
| Module-wise count rates for Quadrant A Data is divided into 100 sec bins |
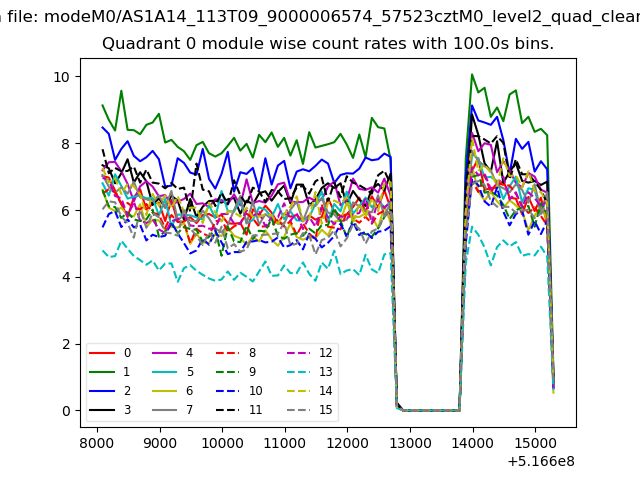 |
 |
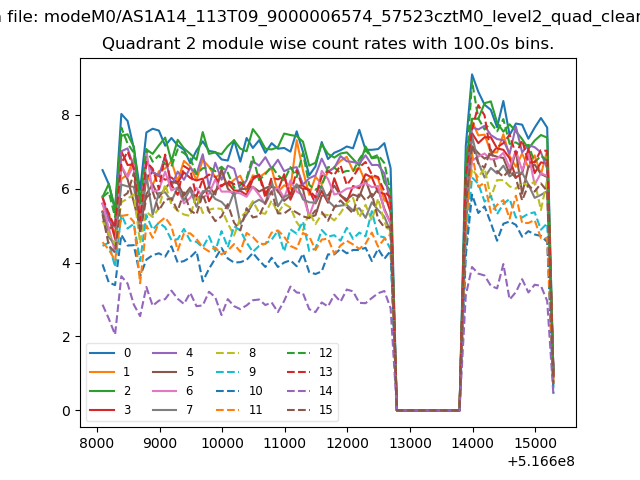
| Module-wise count rates for Quadrant B Data is divided into 100 sec bins |
 |
 |
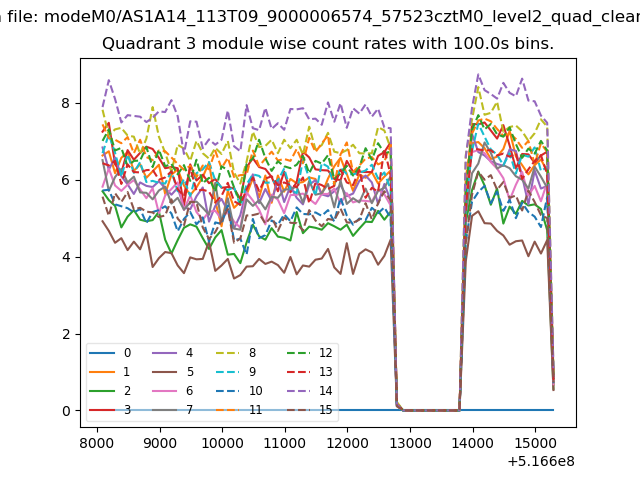
| Module-wise count rates for Quadrant C Data is divided into 100 sec bins |
 |
 |
| Module-wise count rates for Quadrant D Data is divided into 100 sec bins |
 |
 |
| Parameter | Plot |
|---|---|
| CZT HV Monitor | 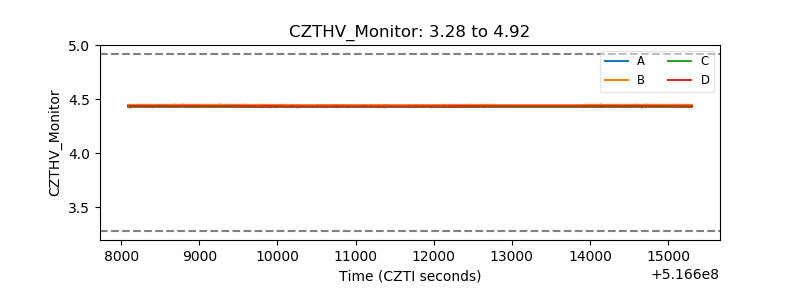 |
| D_VDD | 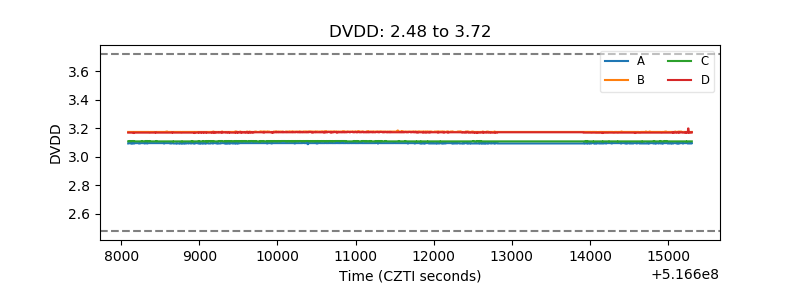 |
| Temperature 1 | 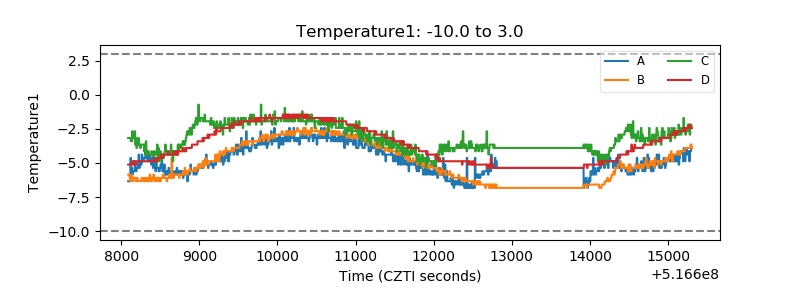 |
| Veto HV Monitor |  |
| Veto LLD | 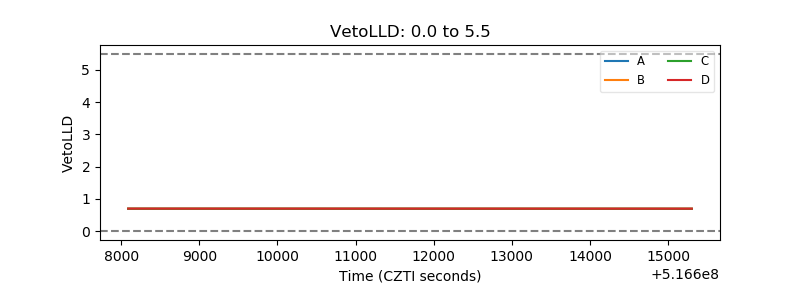 |
| Alpha Counter | 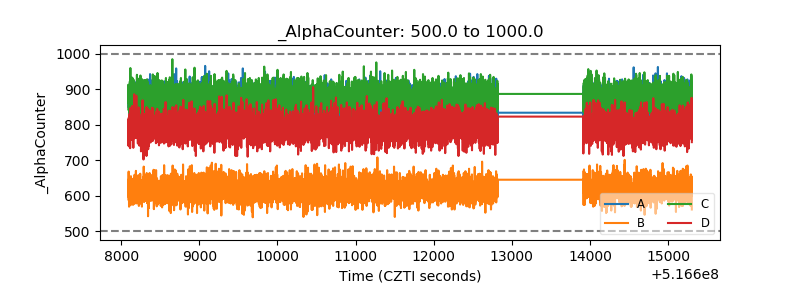 |
| _CPM_Rate | 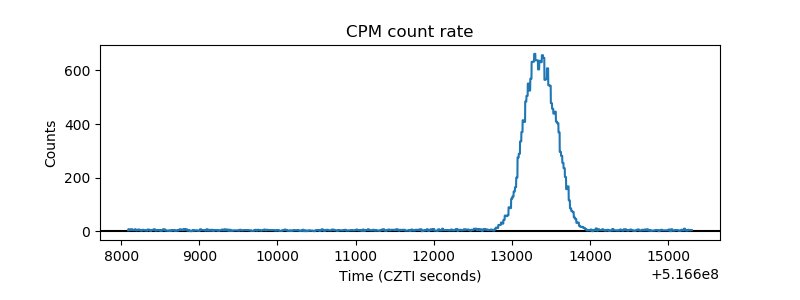 |
| CZT Counter | 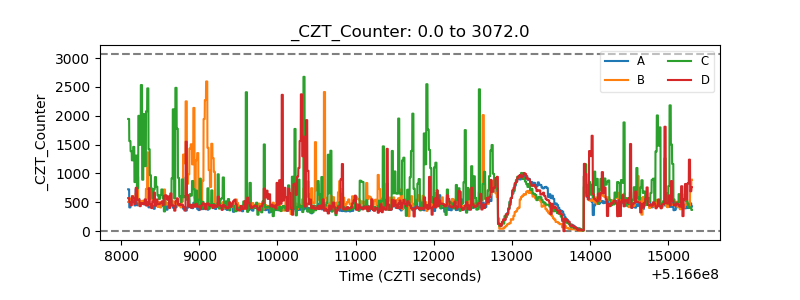 |
| +2.5 Volts monitor | 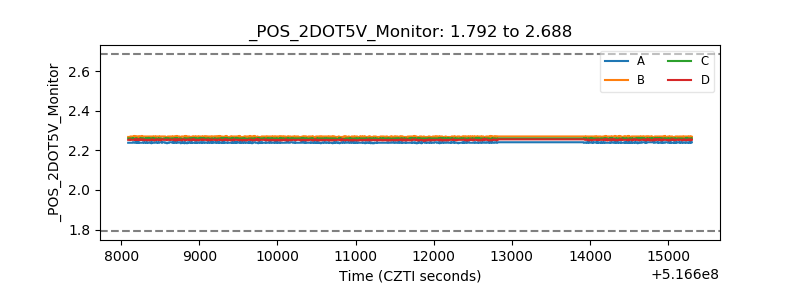 |
| +5 Volts monitor |  |
| _ROLL_ROT | 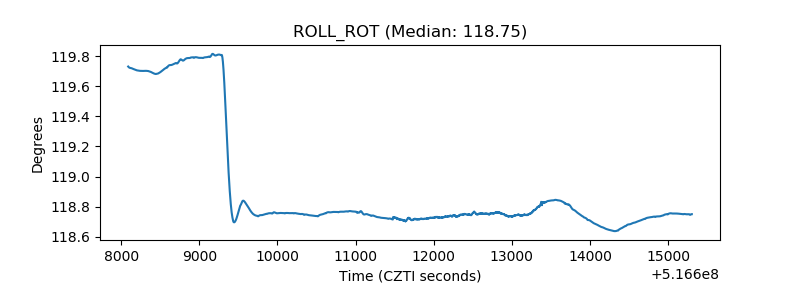 |
| _Roll_DEC | 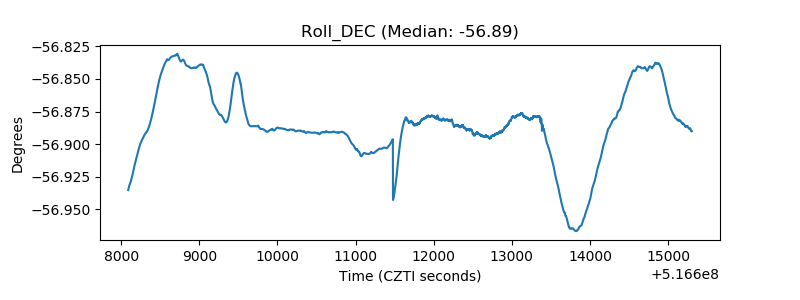 |
| _Roll_RA | 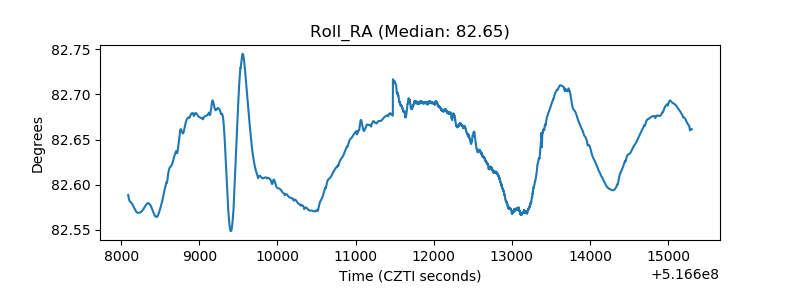 |
| Veto Counter | 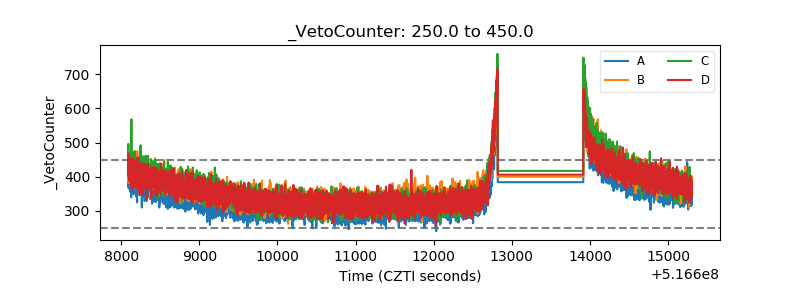 |