| Param | Original file | Final file |
|---|---|---|
| Filename | modeM0/AS1A14_113T09_9000006574_57524cztM0_level2.fits | modeM0/AS1A14_113T09_9000006574_57524cztM0_level2_quad_clean.evt |
| Size (bytes) | 1,570,397,760 | 319,752,000 |
| Size | 1.5 GB | 304.9 MB |
| Events in quadrant A | 10,029,854 | 2,181,985 |
| Events in quadrant B | 12,253,074 | 2,270,070 |
| Events in quadrant C | 20,943,616 | 1,826,589 |
| Events in quadrant D | 13,248,443 | 1,928,683 |
| Mode SS | |||
|---|---|---|---|
| Quadrant | BADHDUFLAG | Total packets | Discarded packets |
| A | 0 | 436 | 0 |
| B | 0 | 436 | 0 |
| C | 0 | 436 | 0 |
| D | 0 | 436 | 0 |
| Mode M9 | |||
|---|---|---|---|
| Quadrant | BADHDUFLAG | Total packets | Discarded packets |
| A | 0 | 42 | 0 |
| B | 0 | 42 | 0 |
| C | 0 | 42 | 0 |
| D | 0 | 42 | 0 |
| Mode M0 | |||
|---|---|---|---|
| Quadrant | BADHDUFLAG | Total packets | Discarded packets |
| A | 0 | 45394 | 4 |
| B | 0 | 50766 | 4 |
| C | 0 | 77241 | 4 |
| D | 0 | 54417 | 4 |
| Quadrant | Total seconds | Saturated seconds | Saturation percentage |
|---|---|---|---|
| A | 21414 | 272 | 1.270197% |
| B | 21414 | 622 | 2.904642% |
| C | 21414 | 3131 | 14.621276% |
| D | 21414 | 1039 | 4.851966% |
Noise dominated data is calculated using 1-second bins in cleaned event files. If a bin has >2000 counts, and if more than 50% of those come from <1% of pixels, then it is considered to be noise-dominated and hence unusable.
| Quadrant | # 1 sec bins | Bins with >0 counts | Bins with >2000 counts | High rate bins dominated by noise | Noise dominated (total time) | Noise dominated (detector-on time) | Marked lightcurve |
|---|---|---|---|---|---|---|---|
| A | 25554 | 21419 | 17 | 17 | 0.07% | 0.08% | 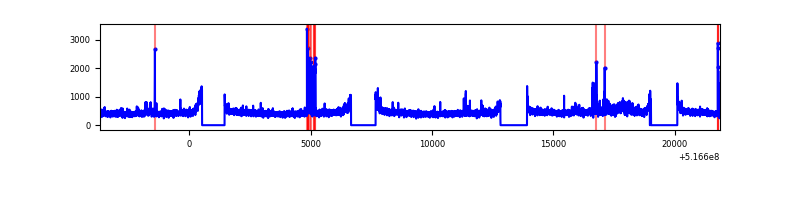 |
| B | 25554 | 21419 | 211 | 211 | 0.83% | 0.99% | 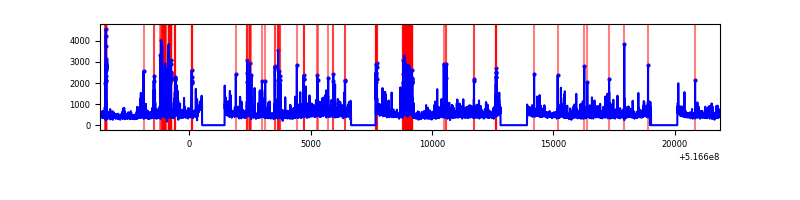 |
| C | 25554 | 21419 | 2257 | 2257 | 8.83% | 10.54% | 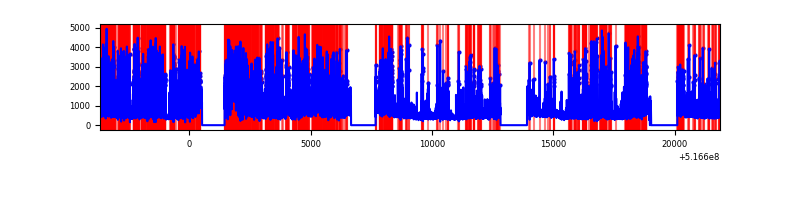 |
| D | 25554 | 21419 | 693 | 693 | 2.71% | 3.24% | 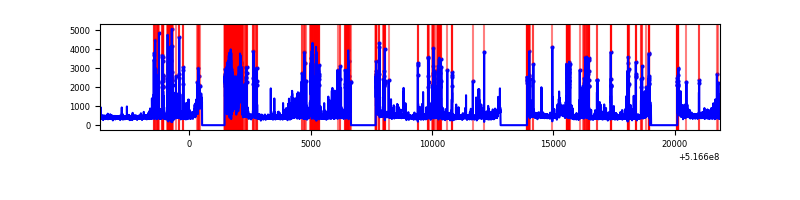 |
Top three noisy pixels from each quadrant. If the there are fewer than three noisy pixels in the level2.evt file, extra rows are filled as -1
| Pixel properties | Quadrant properties | ||||||
|---|---|---|---|---|---|---|---|
| Quadrant | DetID | PixID | Counts | Sigma | Mean | Median | Sigma |
| A | 3 | 14 | 525766 | 884.37 | 2387 | 2328 | 591.9 |
| A | 7 | 14 | 198700 | 331.78 | 2387 | 2328 | 591.9 |
| A | 13 | 248 | 37026 | 58.62 | 2387 | 2328 | 591.9 |
| B | 4 | 206 | 1364824 | 2804.79 | 2308 | 2224 | 485.8 |
| B | 5 | 185 | 705096 | 1446.8 | 2308 | 2224 | 485.8 |
| B | 9 | 251 | 389742 | 797.67 | 2308 | 2224 | 485.8 |
| C | 15 | 224 | 10960514 | 18266.46 | 2187 | 2161 | 599.9 |
| C | 6 | 223 | 528397 | 877.18 | 2187 | 2161 | 599.9 |
| C | 1 | 16 | 332626 | 550.85 | 2187 | 2161 | 599.9 |
| D | 15 | 142 | 1054009 | 1632.43 | 2288 | 2188 | 644.3 |
| D | 8 | 240 | 781354 | 1209.27 | 2288 | 2188 | 644.3 |
| D | 0 | 19 | 681752 | 1054.69 | 2288 | 2188 | 644.3 |
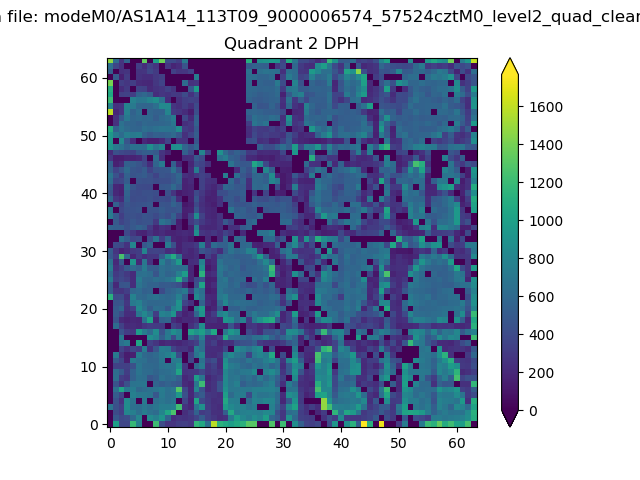
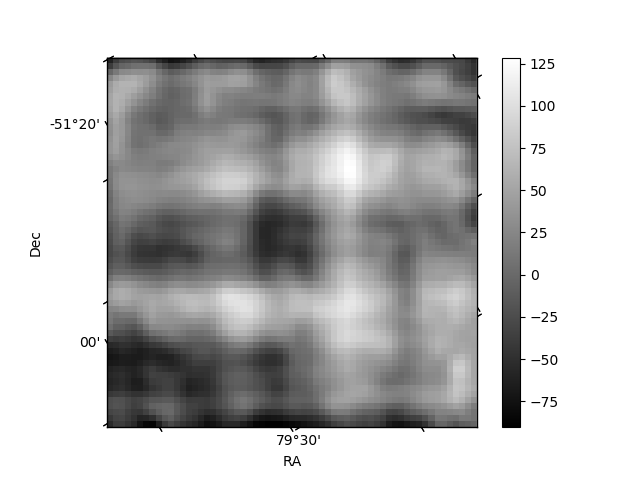
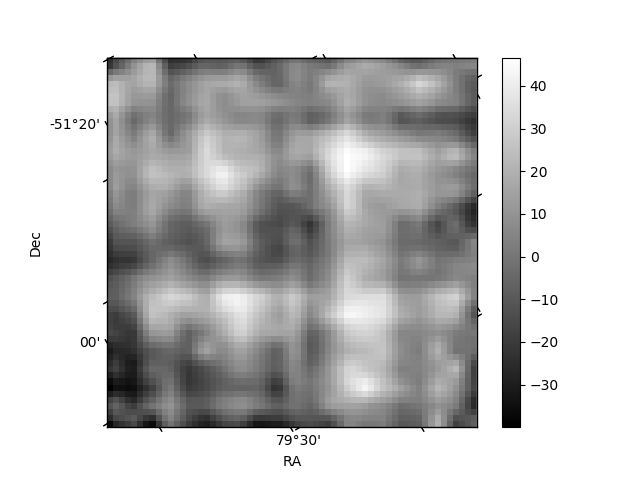
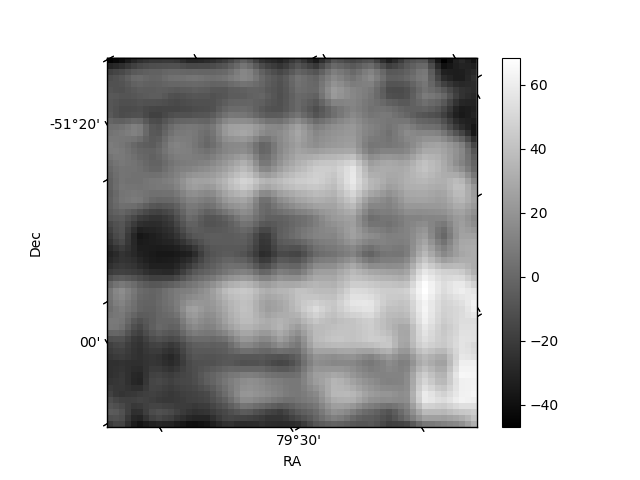
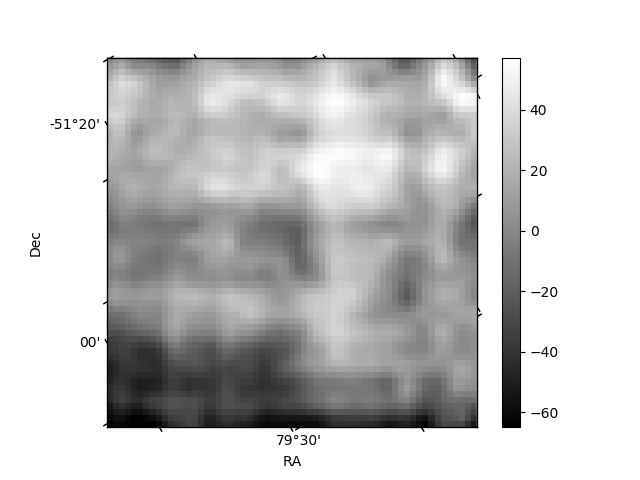
Histogram calculated using DETX and DETY for each event in the final _common_clean file
| Quadrant A | 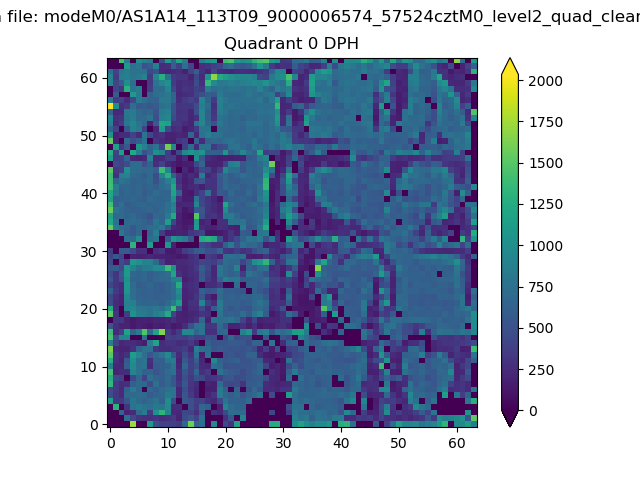 |
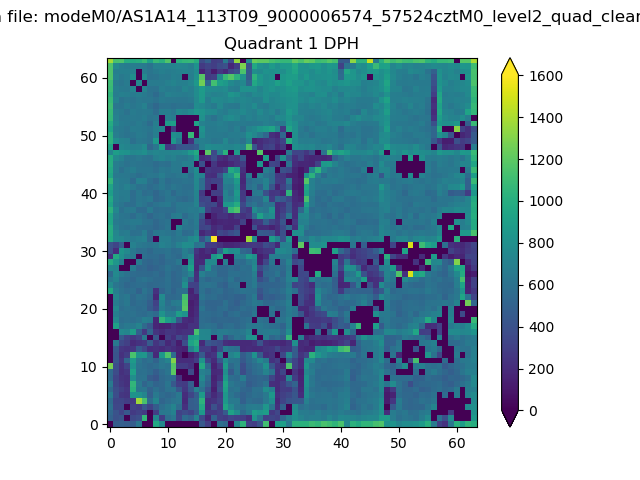 |
Quadrant B |
|---|---|---|---|
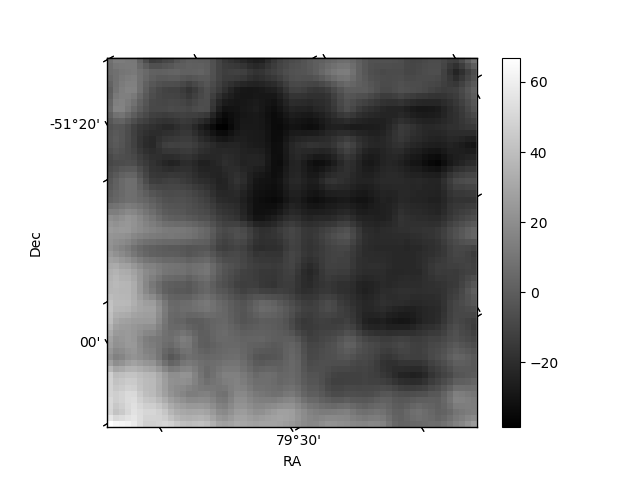
| Quadrant D | 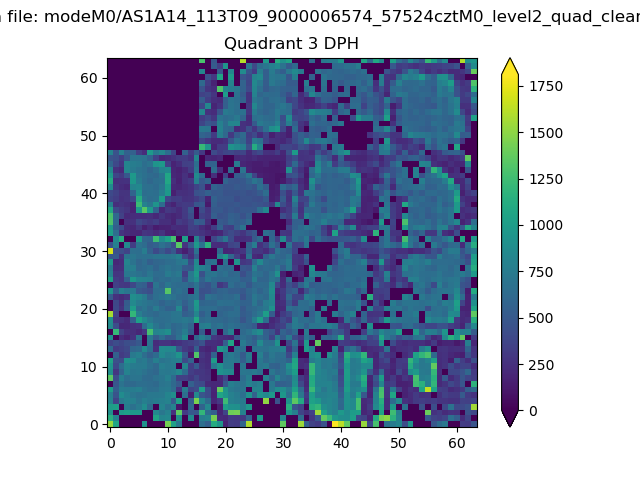 |
 |
Quadrant C |
| Plot type | Count rate plots | Images |
|---|---|---|
| Comparison with Poisson distribution Blue bars denote a histogram of data divided into 1 sec bins. Red curve is a Poisson curve with rate = median count rate of data. |
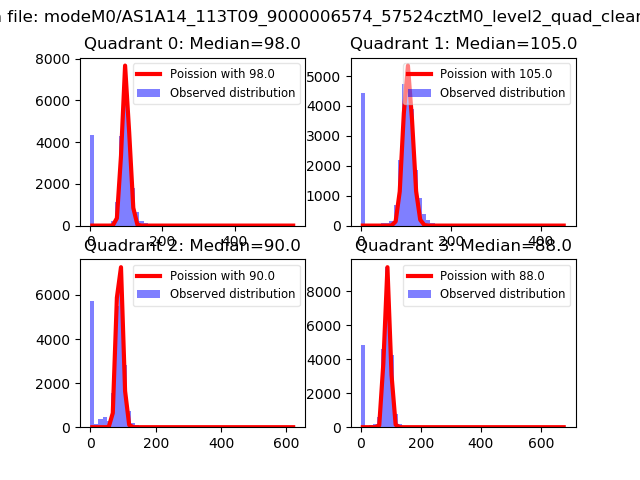 |
 |
| Quadrant-wise count rates Data is divided into 100 sec bins |
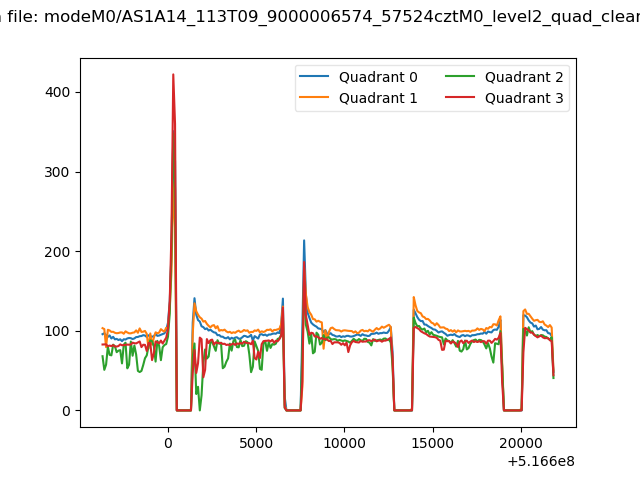 |
|
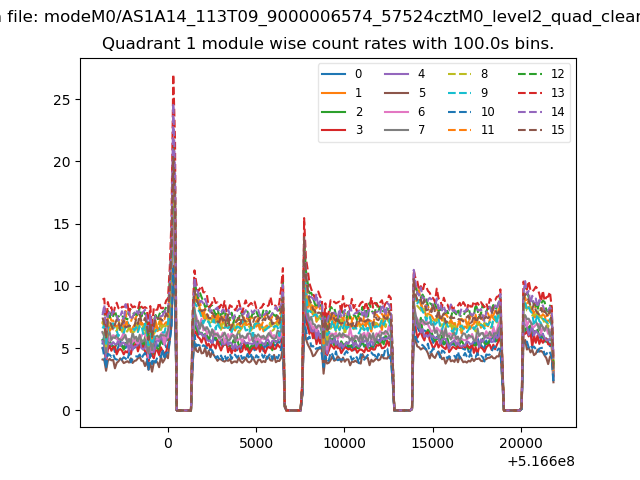
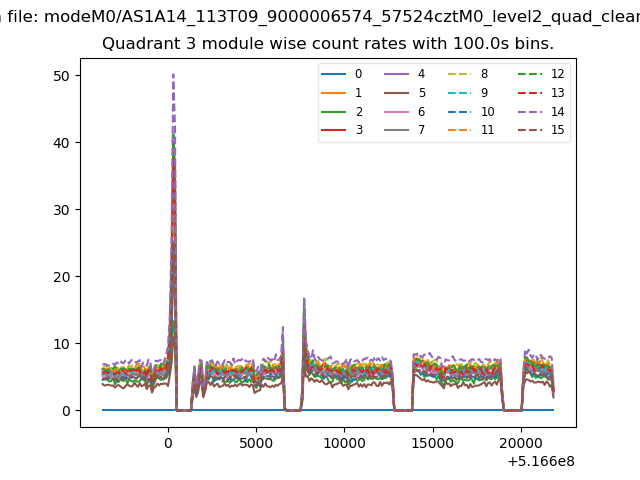
| Module-wise count rates for Quadrant A Data is divided into 100 sec bins |
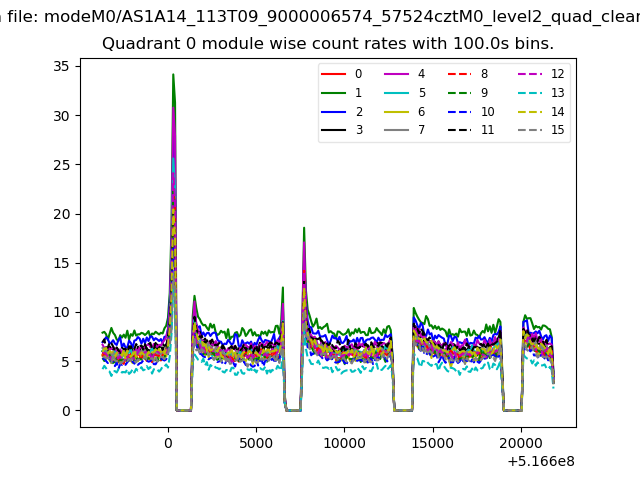 |
 |
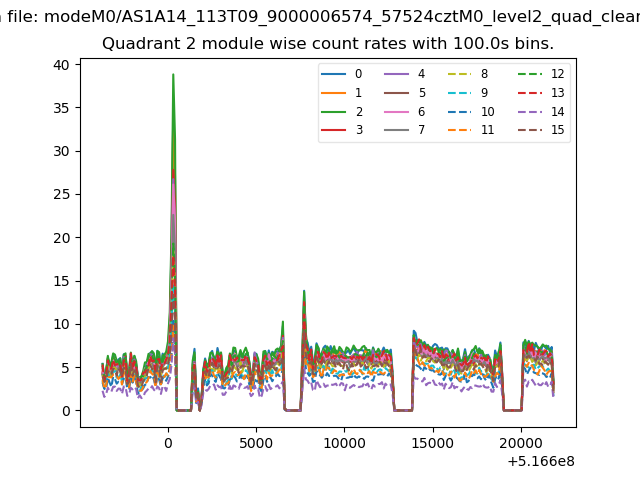
| Module-wise count rates for Quadrant B Data is divided into 100 sec bins |
 |
 |
| Module-wise count rates for Quadrant C Data is divided into 100 sec bins |
 |
 |
| Module-wise count rates for Quadrant D Data is divided into 100 sec bins |
 |
 |
| Parameter | Plot |
|---|---|
| CZT HV Monitor | 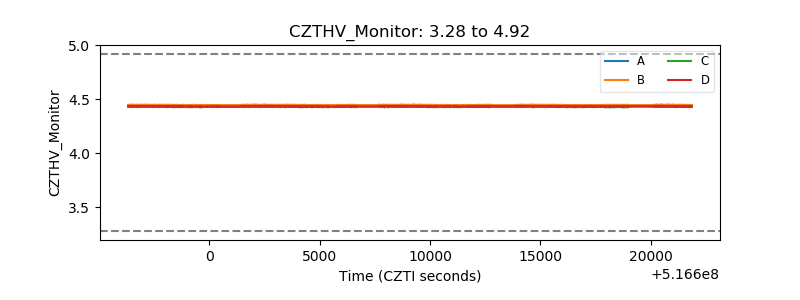 |
| D_VDD | 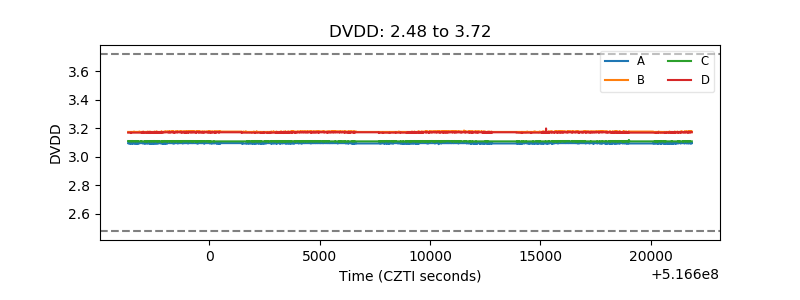 |
| Temperature 1 | 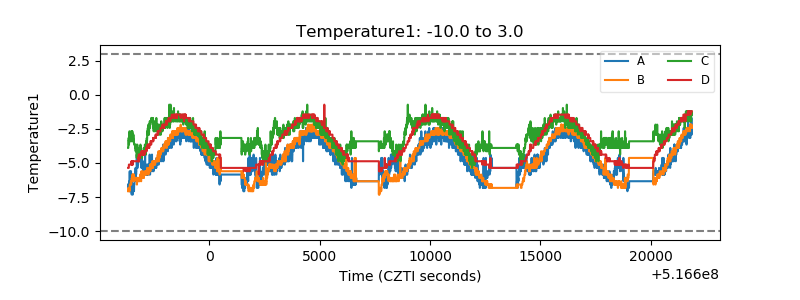 |
| Veto HV Monitor | 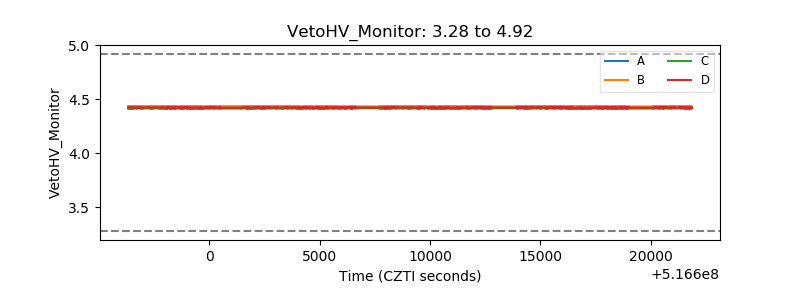 |
| Veto LLD | 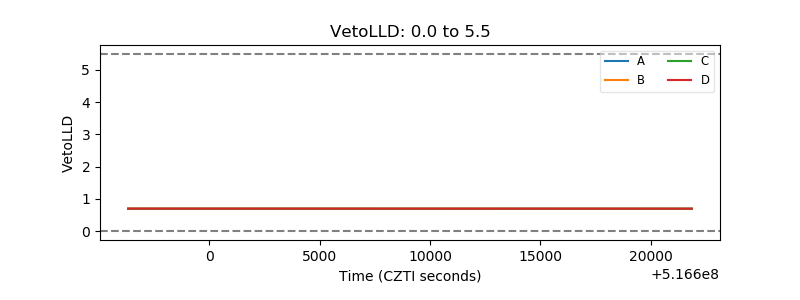 |
| Alpha Counter | 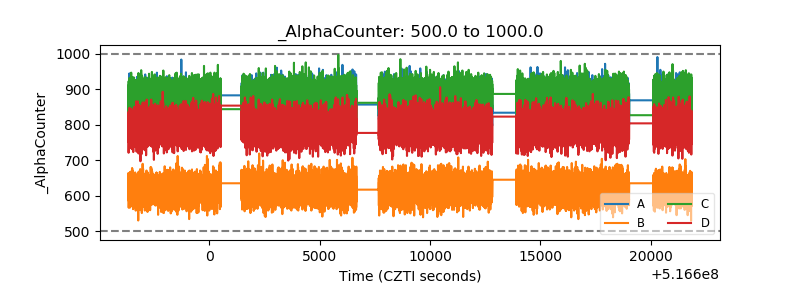 |
| _CPM_Rate | 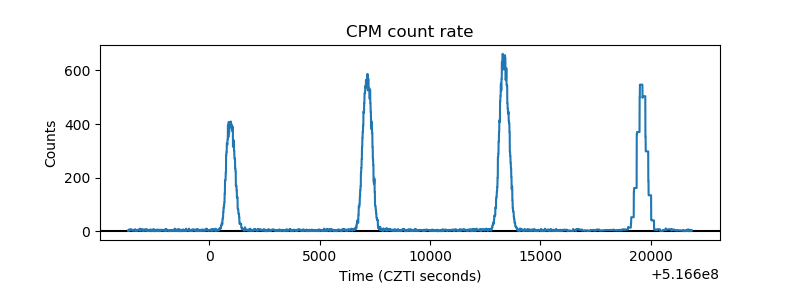 |
| CZT Counter | 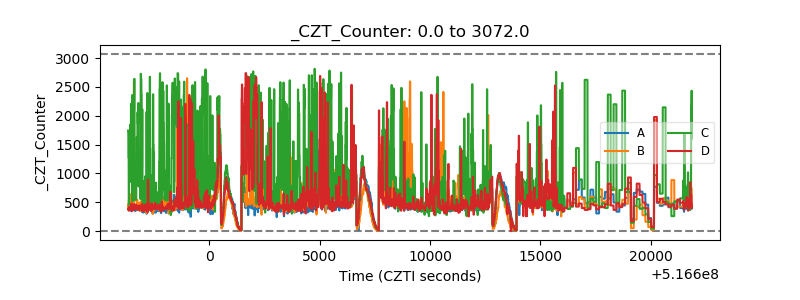 |
| +2.5 Volts monitor | 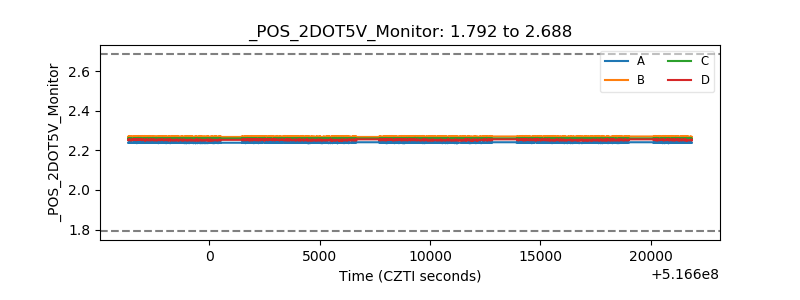 |
| +5 Volts monitor | 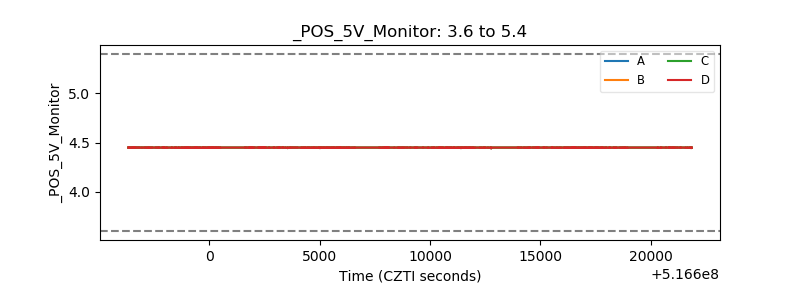 |
| _ROLL_ROT | 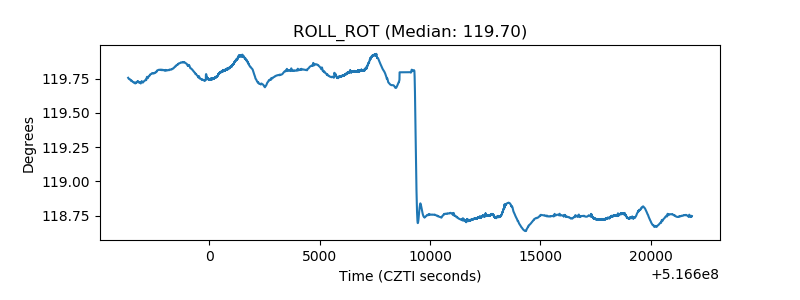 |
| _Roll_DEC | 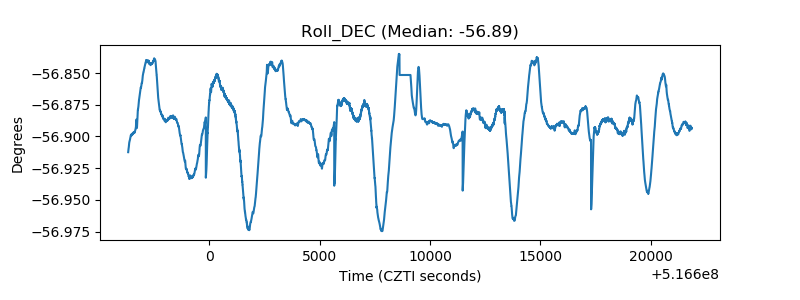 |
| _Roll_RA | 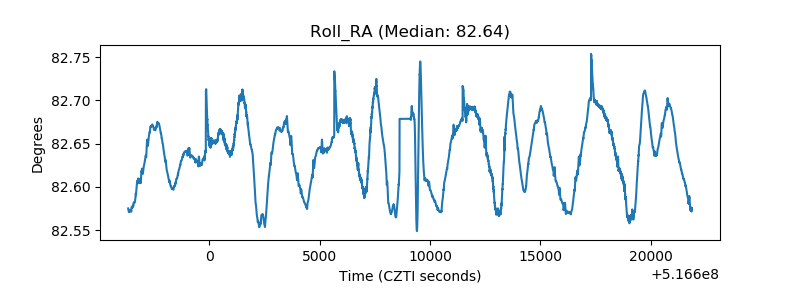 |
| Veto Counter | 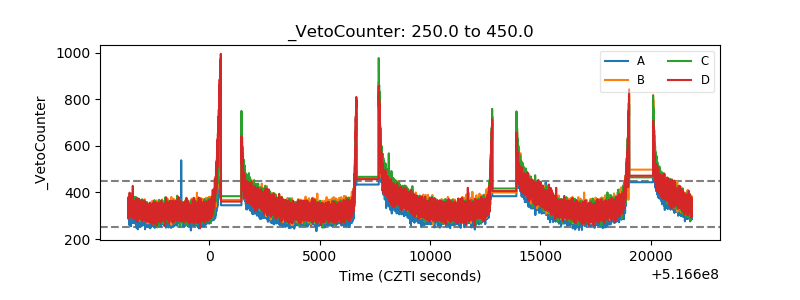 |