| Param | Original file | Final file |
|---|---|---|
| Filename | modeM0/AS1A14_113T09_9000006574_57525cztM0_level2.fits | modeM0/AS1A14_113T09_9000006574_57525cztM0_level2_quad_clean.evt |
| Size (bytes) | 431,239,680 | 94,616,640 |
| Size | 411.3 MB | 90.2 MB |
| Events in quadrant A | 2,797,190 | 628,128 |
| Events in quadrant B | 3,313,521 | 669,728 |
| Events in quadrant C | 4,972,739 | 578,275 |
| Events in quadrant D | 4,384,920 | 544,796 |
| Mode SS | |||
|---|---|---|---|
| Quadrant | BADHDUFLAG | Total packets | Discarded packets |
| A | 0 | 130 | 0 |
| B | 0 | 130 | 0 |
| C | 0 | 130 | 0 |
| D | 0 | 130 | 0 |
| Mode M9 | |||
|---|---|---|---|
| Quadrant | BADHDUFLAG | Total packets | Discarded packets |
| A | 0 | 11 | 0 |
| B | 0 | 11 | 0 |
| C | 0 | 11 | 0 |
| D | 0 | 11 | 0 |
| Mode M0 | |||
|---|---|---|---|
| Quadrant | BADHDUFLAG | Total packets | Discarded packets |
| A | 0 | 13069 | 1 |
| B | 0 | 14004 | 2 |
| C | 0 | 19228 | 1 |
| D | 0 | 17465 | 1 |
| Quadrant | Total seconds | Saturated seconds | Saturation percentage |
|---|---|---|---|
| A | 6363 | 28 | 0.440044% |
| B | 6362 | 46 | 0.723043% |
| C | 6362 | 363 | 5.705753% |
| D | 6362 | 377 | 5.925809% |
Noise dominated data is calculated using 1-second bins in cleaned event files. If a bin has >2000 counts, and if more than 50% of those come from <1% of pixels, then it is considered to be noise-dominated and hence unusable.
| Quadrant | # 1 sec bins | Bins with >0 counts | Bins with >2000 counts | High rate bins dominated by noise | Noise dominated (total time) | Noise dominated (detector-on time) | Marked lightcurve |
|---|---|---|---|---|---|---|---|
| A | 7468 | 6364 | 7 | 7 | 0.09% | 0.11% | 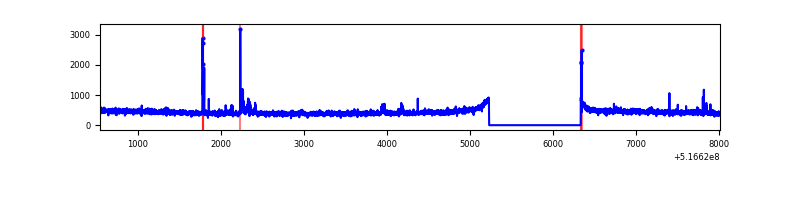 |
| B | 7467 | 6363 | 10 | 10 | 0.13% | 0.16% | 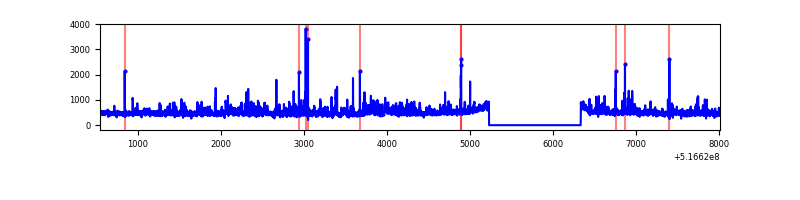 |
| C | 7467 | 6363 | 288 | 288 | 3.86% | 4.53% | 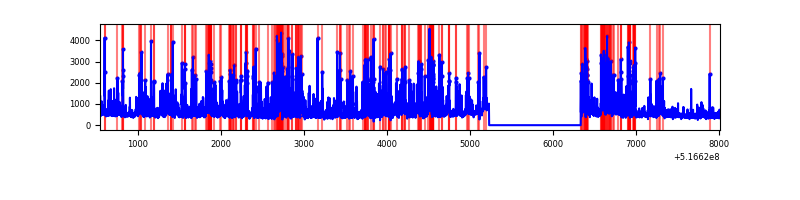 |
| D | 7467 | 6363 | 356 | 356 | 4.77% | 5.59% | 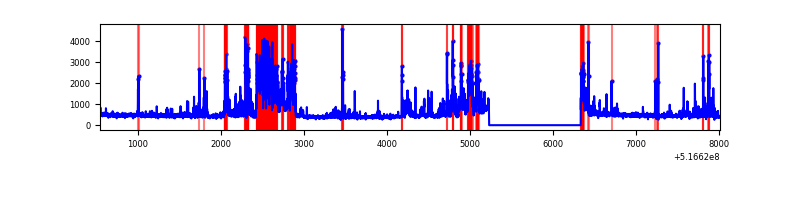 |
Top three noisy pixels from each quadrant. If the there are fewer than three noisy pixels in the level2.evt file, extra rows are filled as -1
| Pixel properties | Quadrant properties | ||||||
|---|---|---|---|---|---|---|---|
| Quadrant | DetID | PixID | Counts | Sigma | Mean | Median | Sigma |
| A | 7 | 14 | 35714 | 203.7 | 697 | 677 | 172.0 |
| A | 13 | 248 | 27766 | 157.49 | 697 | 677 | 172.0 |
| A | 3 | 14 | 24612 | 139.15 | 697 | 677 | 172.0 |
| B | 4 | 206 | 407067 | 2774.7 | 678 | 653 | 146.5 |
| B | 5 | 185 | 49133 | 330.99 | 678 | 653 | 146.5 |
| B | 7 | 252 | 45436 | 305.75 | 678 | 653 | 146.5 |
| C | 15 | 224 | 2132278 | 11817.86 | 657 | 649 | 180.4 |
| C | 13 | 3 | 104296 | 574.62 | 657 | 649 | 180.4 |
| C | 14 | 246 | 76403 | 419.98 | 657 | 649 | 180.4 |
| D | 8 | 240 | 1145850 | 6144.76 | 662 | 630 | 186.4 |
| D | 2 | 31 | 247077 | 1322.33 | 662 | 630 | 186.4 |
| D | 3 | 12 | 88387 | 470.86 | 662 | 630 | 186.4 |
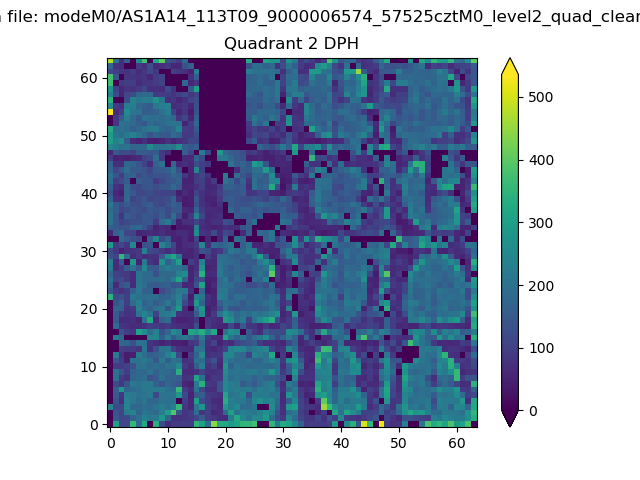
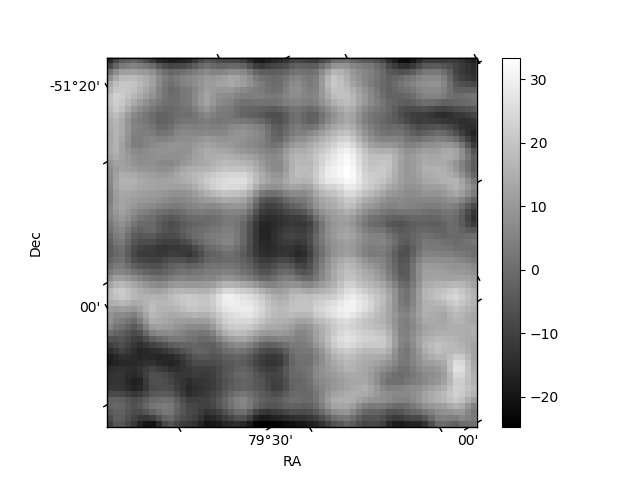
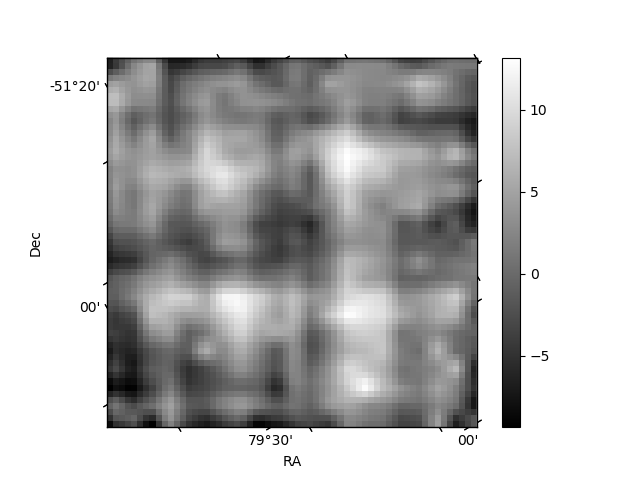
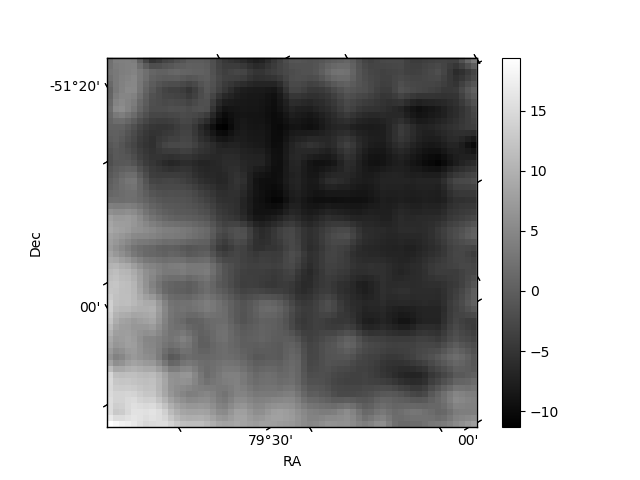
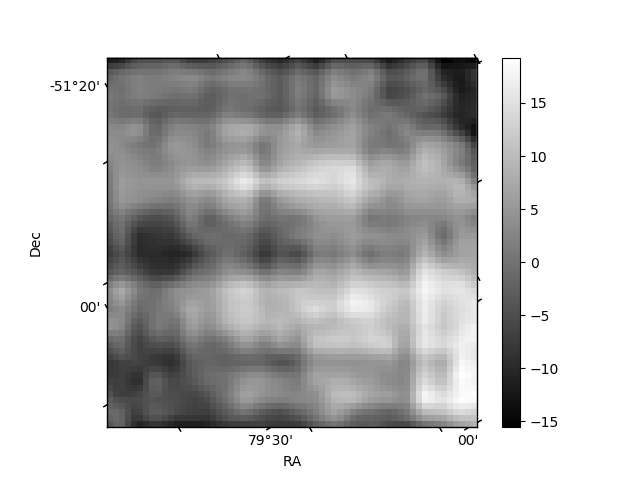
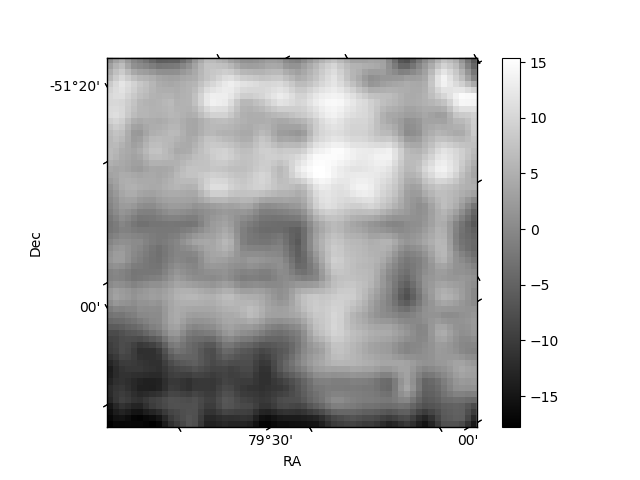
Histogram calculated using DETX and DETY for each event in the final _common_clean file
| Quadrant A | 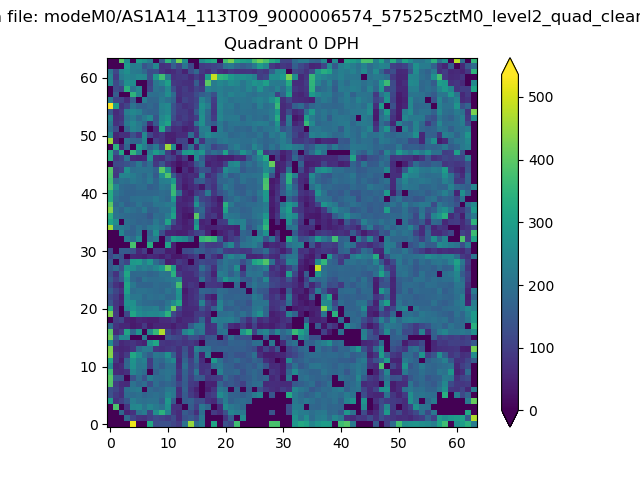 |
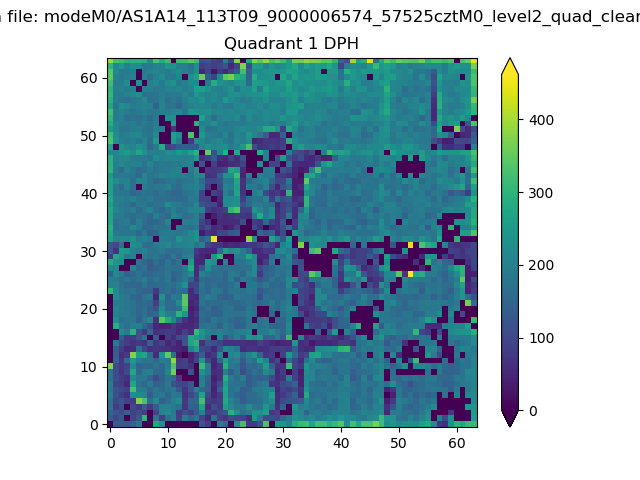 |
Quadrant B |
|---|---|---|---|
| Quadrant D | 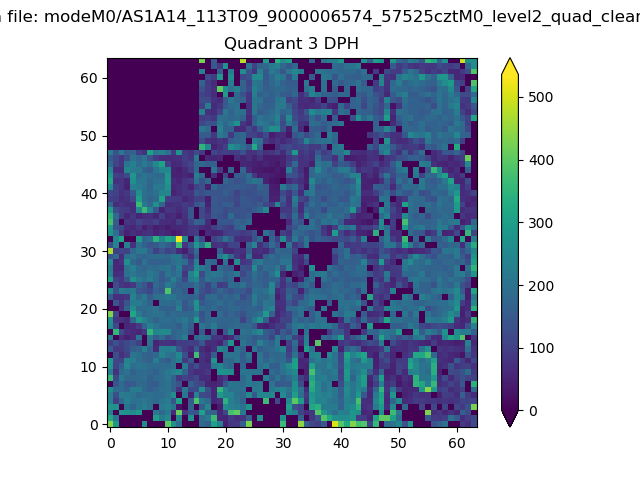 |
 |
Quadrant C |
| Plot type | Count rate plots | Images |
|---|---|---|
| Comparison with Poisson distribution Blue bars denote a histogram of data divided into 1 sec bins. Red curve is a Poisson curve with rate = median count rate of data. |
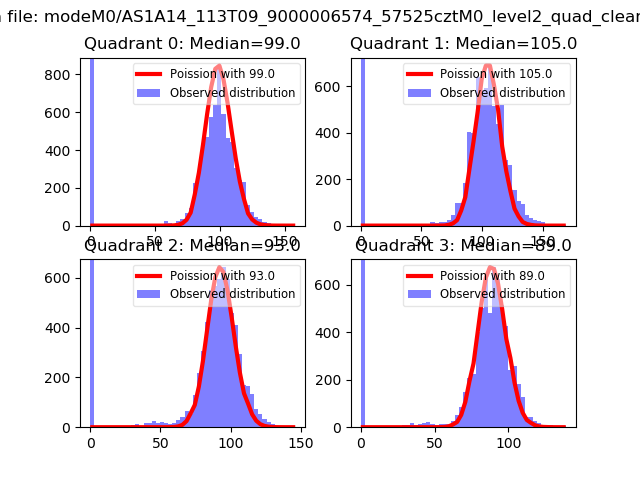 |
 |
| Quadrant-wise count rates Data is divided into 100 sec bins |
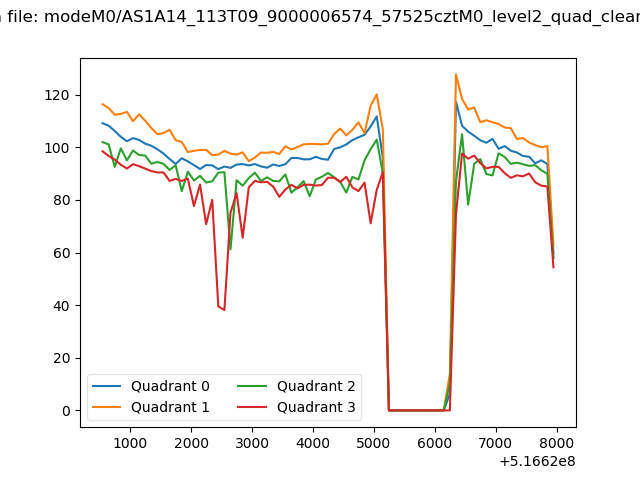 |
|
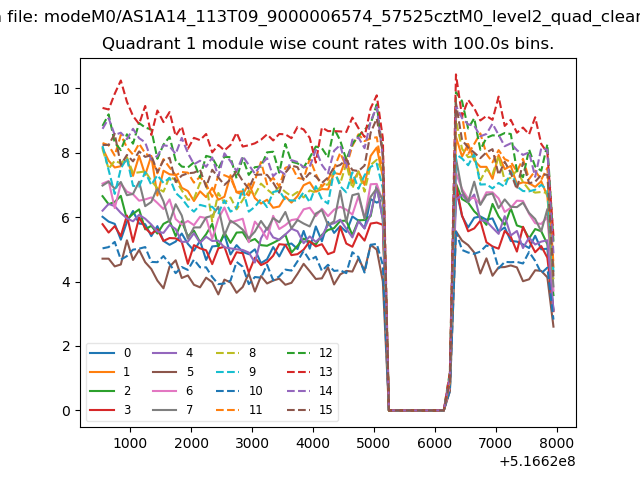
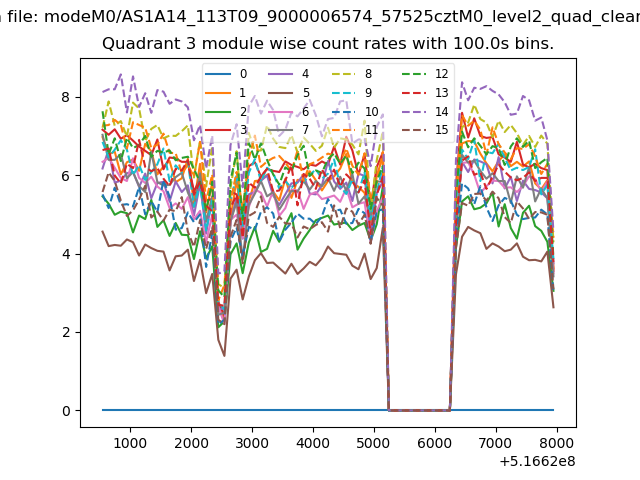
| Module-wise count rates for Quadrant A Data is divided into 100 sec bins |
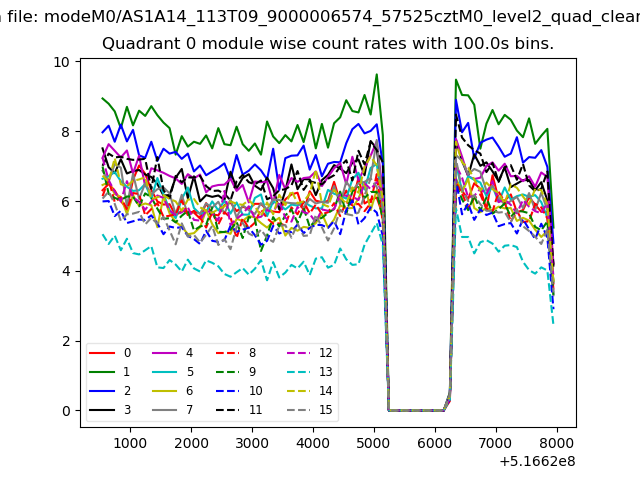 |
 |
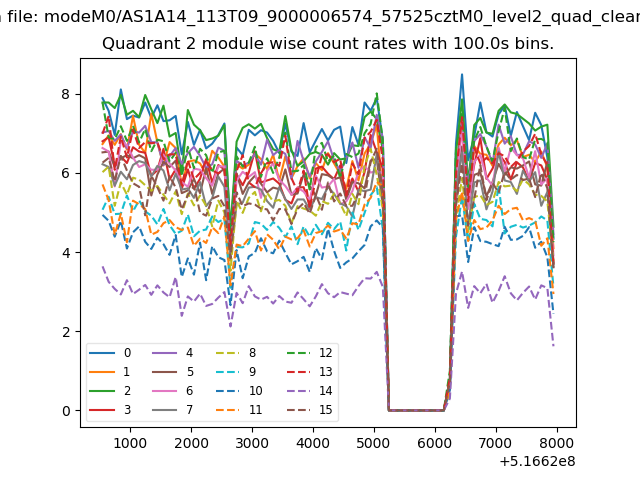
| Module-wise count rates for Quadrant B Data is divided into 100 sec bins |
 |
 |
| Module-wise count rates for Quadrant C Data is divided into 100 sec bins |
 |
 |
| Module-wise count rates for Quadrant D Data is divided into 100 sec bins |
 |
 |
| Parameter | Plot |
|---|---|
| CZT HV Monitor | 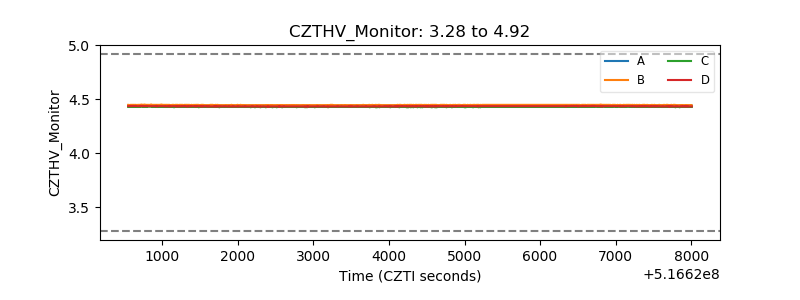 |
| D_VDD | 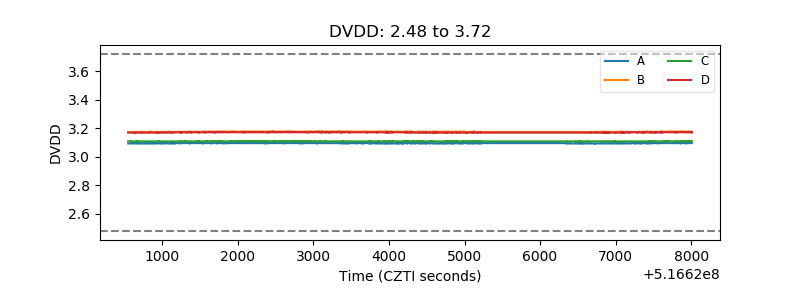 |
| Temperature 1 | 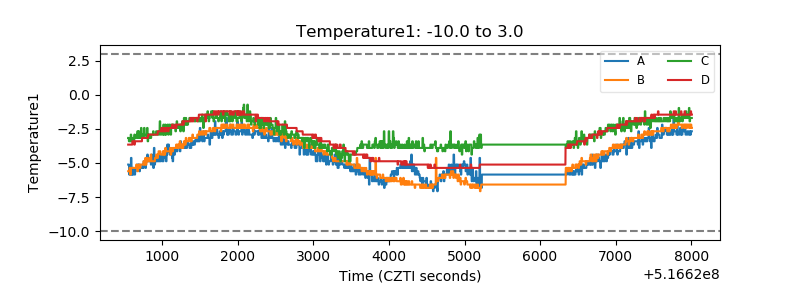 |
| Veto HV Monitor | 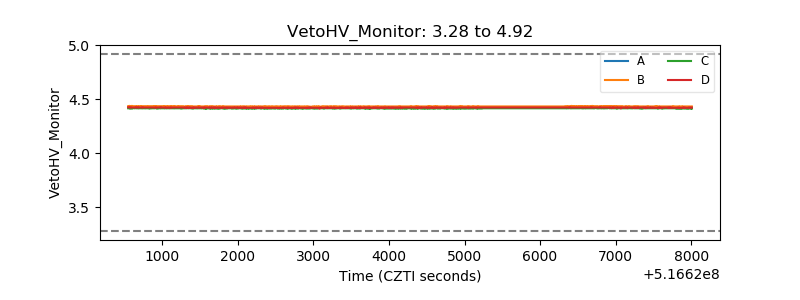 |
| Veto LLD | 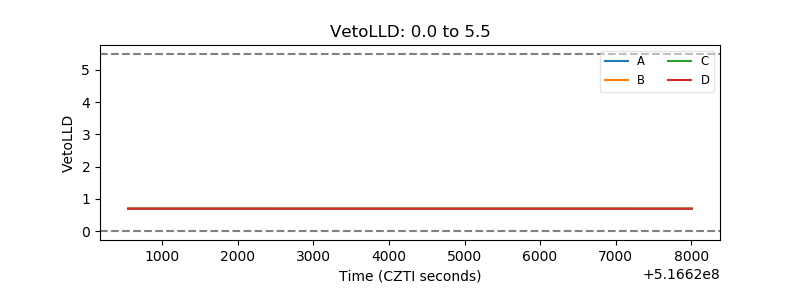 |
| Alpha Counter | 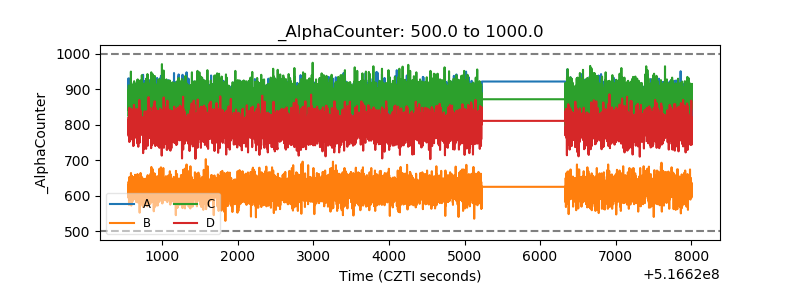 |
| _CPM_Rate | 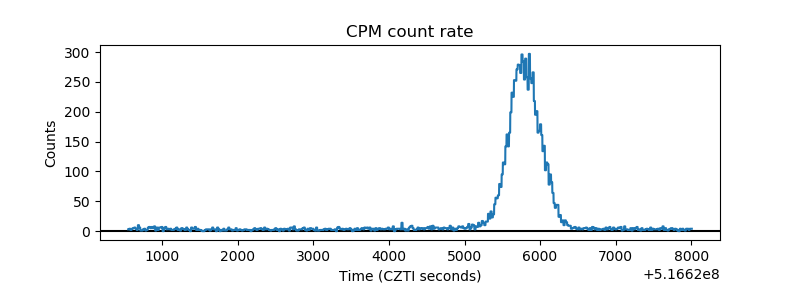 |
| CZT Counter | 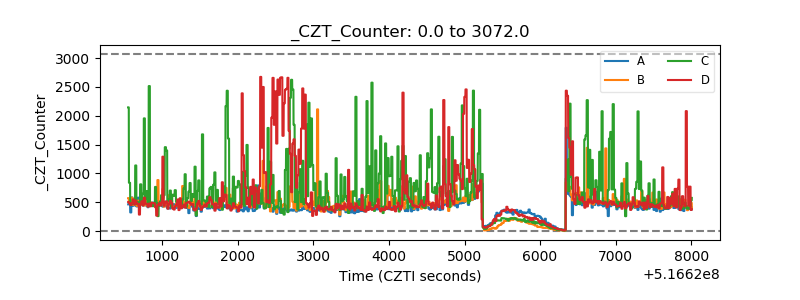 |
| +2.5 Volts monitor | 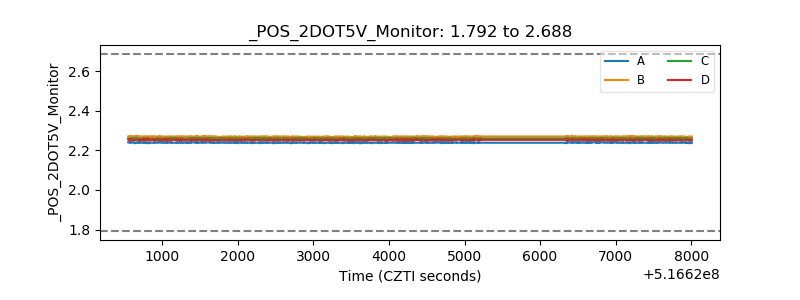 |
| +5 Volts monitor |  |
| _ROLL_ROT | 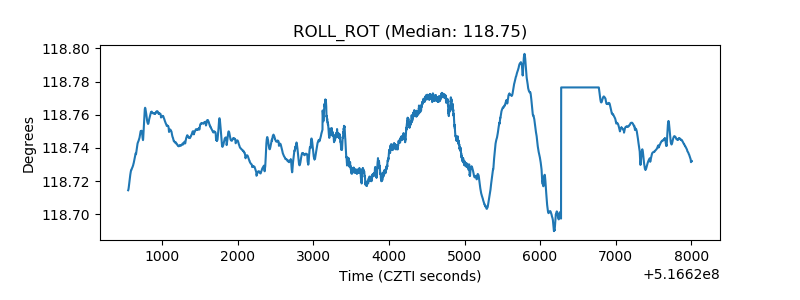 |
| _Roll_DEC | 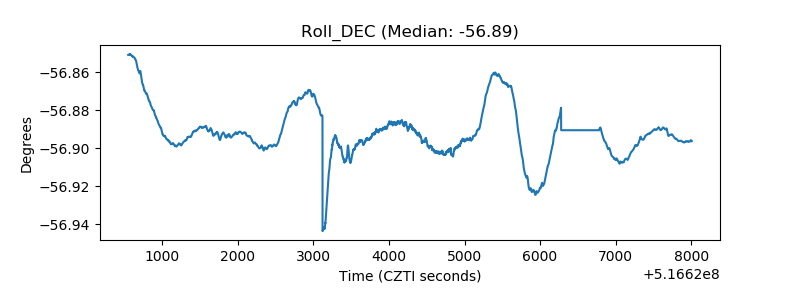 |
| _Roll_RA | 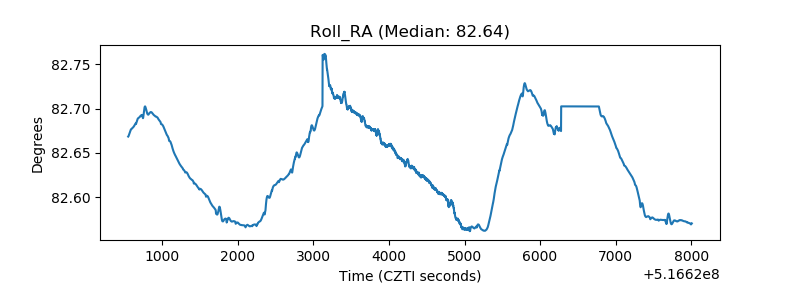 |
| Veto Counter | 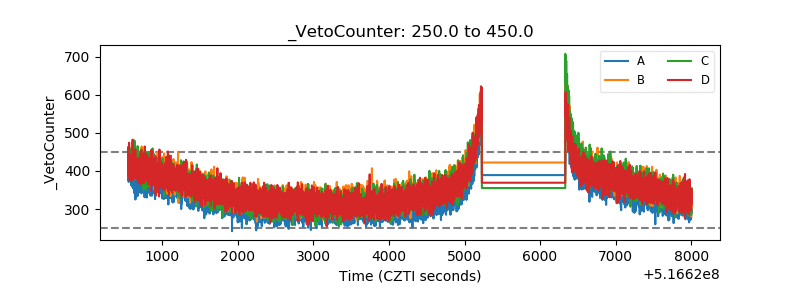 |