| Param | Original file | Final file |
|---|---|---|
| Filename | modeM0/AS1A14_113T09_9000006574_57526cztM0_level2.fits | modeM0/AS1A14_113T09_9000006574_57526cztM0_level2_quad_clean.evt |
| Size (bytes) | 404,208,000 | 95,996,160 |
| Size | 385.5 MB | 91.5 MB |
| Events in quadrant A | 3,267,262 | 625,860 |
| Events in quadrant B | 3,423,175 | 664,578 |
| Events in quadrant C | 3,949,759 | 593,164 |
| Events in quadrant D | 3,812,861 | 567,002 |
| Mode SS | |||
|---|---|---|---|
| Quadrant | BADHDUFLAG | Total packets | Discarded packets |
| A | 0 | 132 | 0 |
| B | 0 | 132 | 0 |
| C | 0 | 132 | 0 |
| D | 0 | 132 | 0 |
| Mode M9 | |||
|---|---|---|---|
| Quadrant | BADHDUFLAG | Total packets | Discarded packets |
| A | 0 | 9 | 0 |
| B | 0 | 9 | 0 |
| C | 0 | 9 | 0 |
| D | 0 | 9 | 0 |
| Mode M0 | |||
|---|---|---|---|
| Quadrant | BADHDUFLAG | Total packets | Discarded packets |
| A | 0 | 14542 | 1 |
| B | 0 | 14523 | 1 |
| C | 0 | 16498 | 1 |
| D | 0 | 15932 | 1 |
| Quadrant | Total seconds | Saturated seconds | Saturation percentage |
|---|---|---|---|
| A | 6545 | 143 | 2.184874% |
| B | 6546 | 143 | 2.184540% |
| C | 6546 | 216 | 3.299725% |
| D | 6546 | 154 | 2.352582% |
Noise dominated data is calculated using 1-second bins in cleaned event files. If a bin has >2000 counts, and if more than 50% of those come from <1% of pixels, then it is considered to be noise-dominated and hence unusable.
| Quadrant | # 1 sec bins | Bins with >0 counts | Bins with >2000 counts | High rate bins dominated by noise | Noise dominated (total time) | Noise dominated (detector-on time) | Marked lightcurve |
|---|---|---|---|---|---|---|---|
| A | 7430 | 6546 | 32 | 32 | 0.43% | 0.49% | 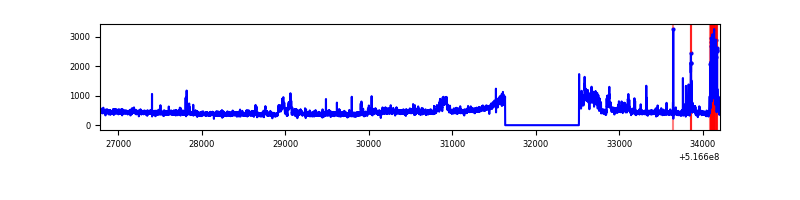 |
| B | 7431 | 6547 | 19 | 19 | 0.26% | 0.29% | 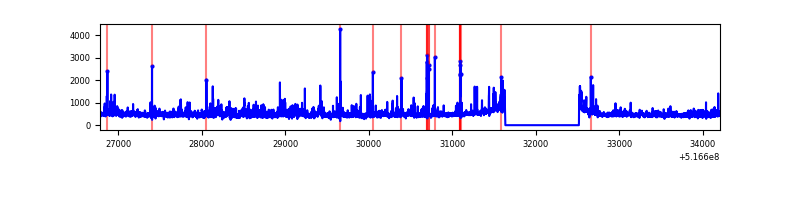 |
| C | 7431 | 6547 | 133 | 133 | 1.79% | 2.03% | 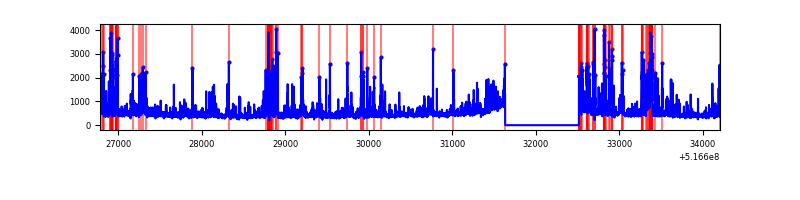 |
| D | 7431 | 6547 | 85 | 85 | 1.14% | 1.30% | 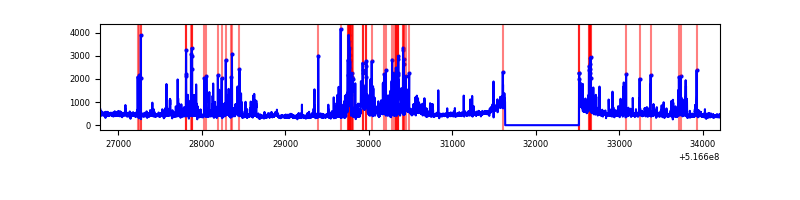 |
Top three noisy pixels from each quadrant. If the there are fewer than three noisy pixels in the level2.evt file, extra rows are filled as -1
| Pixel properties | Quadrant properties | ||||||
|---|---|---|---|---|---|---|---|
| Quadrant | DetID | PixID | Counts | Sigma | Mean | Median | Sigma |
| A | 3 | 14 | 320912 | 1825.95 | 713 | 693 | 175.4 |
| A | 7 | 14 | 160453 | 910.98 | 713 | 693 | 175.4 |
| A | 13 | 248 | 12316 | 66.28 | 713 | 693 | 175.4 |
| B | 4 | 206 | 364786 | 2443.93 | 692 | 664 | 149.0 |
| B | 5 | 185 | 122124 | 815.22 | 692 | 664 | 149.0 |
| B | 10 | 247 | 66174 | 439.69 | 692 | 664 | 149.0 |
| C | 15 | 224 | 1025460 | 5529.86 | 679 | 670 | 185.3 |
| C | 14 | 246 | 114603 | 614.79 | 679 | 670 | 185.3 |
| C | 12 | 252 | 103727 | 556.1 | 679 | 670 | 185.3 |
| D | 15 | 142 | 414003 | 2126.52 | 690 | 660 | 194.4 |
| D | 2 | 31 | 252977 | 1298.09 | 690 | 660 | 194.4 |
| D | 3 | 12 | 162821 | 834.27 | 690 | 660 | 194.4 |
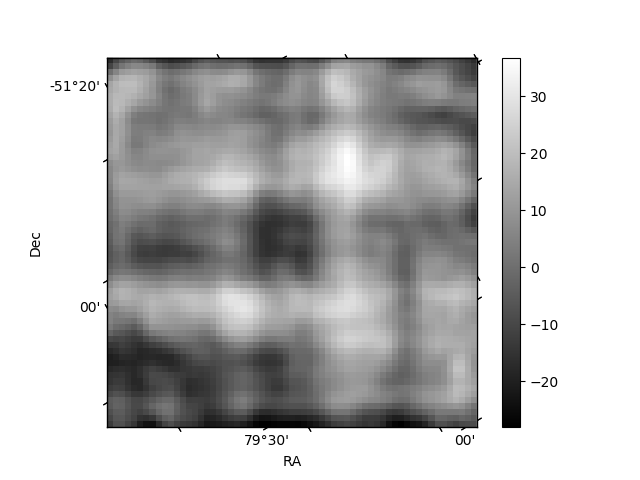
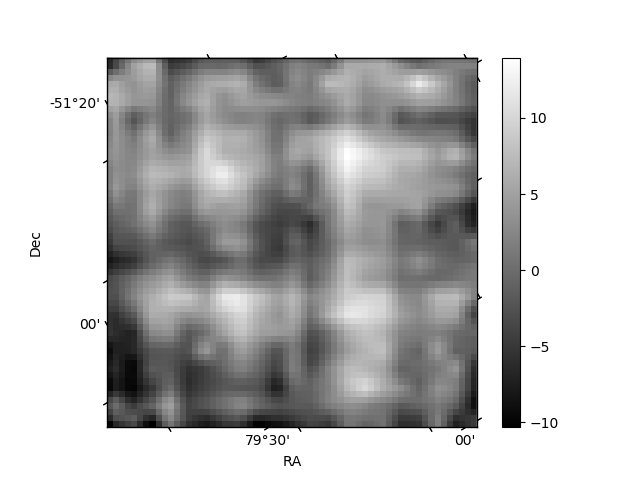
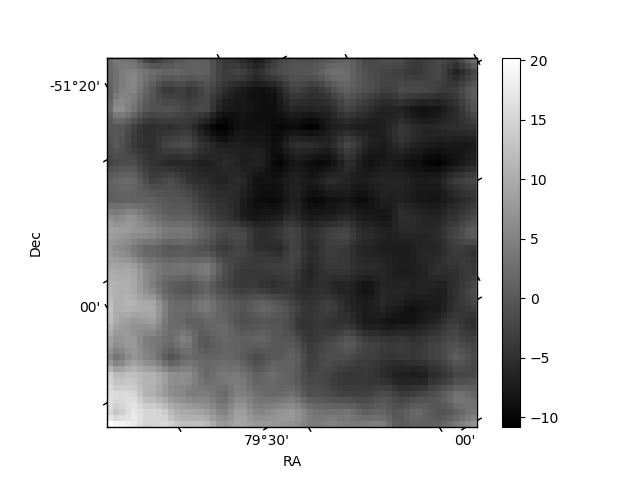
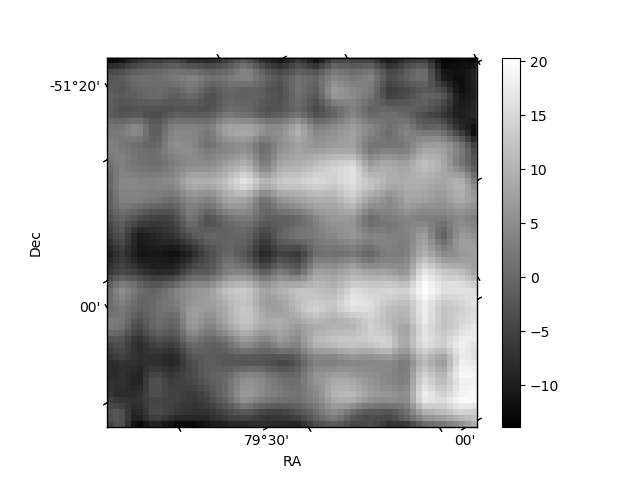
Histogram calculated using DETX and DETY for each event in the final _common_clean file
| Quadrant A | 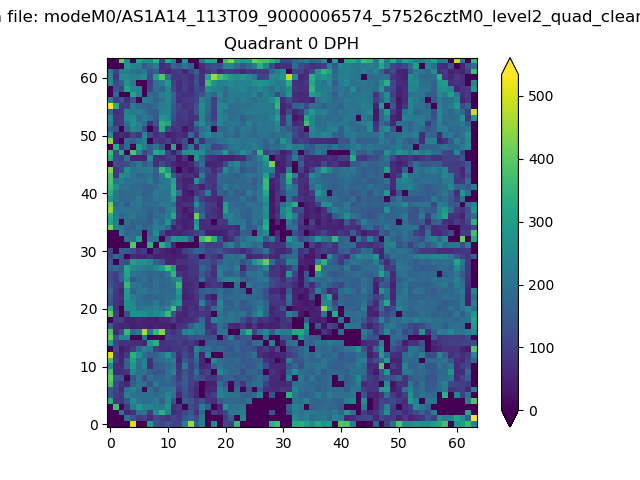 |
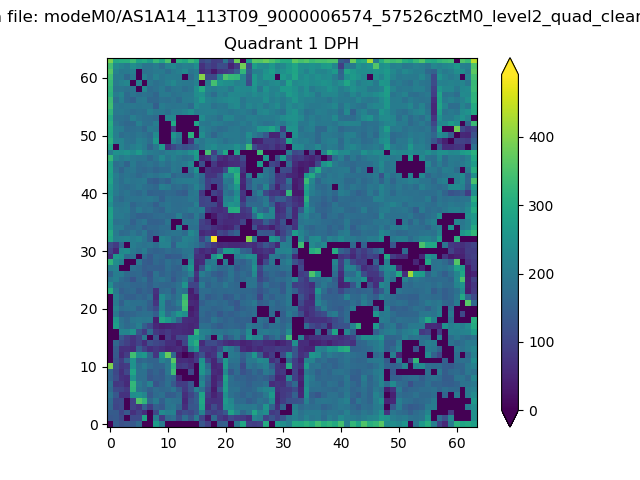 |
Quadrant B |
|---|---|---|---|
| Quadrant D | 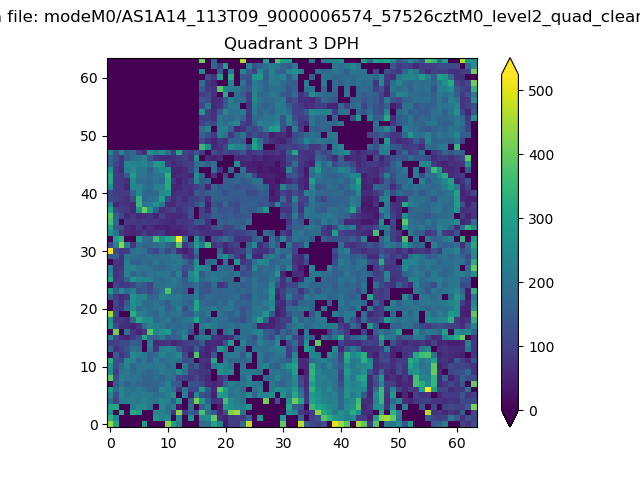 |
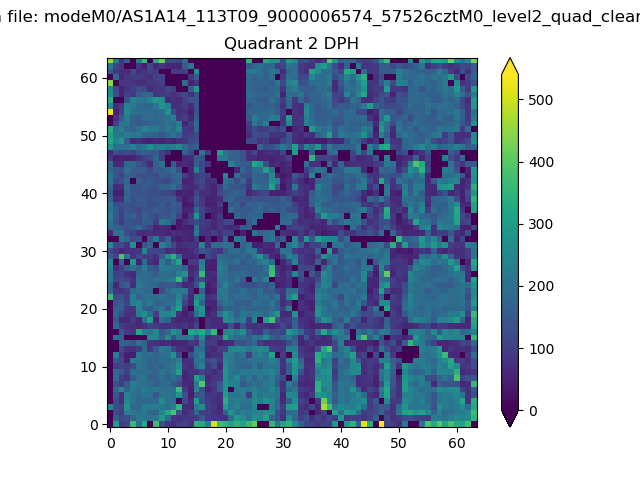 |
Quadrant C |
| Plot type | Count rate plots | Images |
|---|---|---|
| Comparison with Poisson distribution Blue bars denote a histogram of data divided into 1 sec bins. Red curve is a Poisson curve with rate = median count rate of data. |
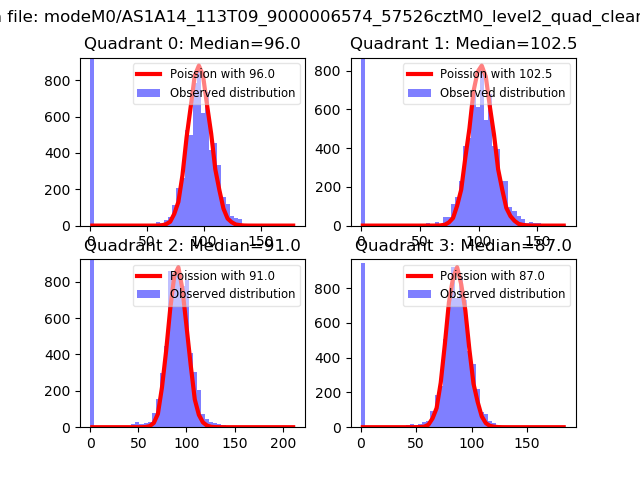 |
 |
| Quadrant-wise count rates Data is divided into 100 sec bins |
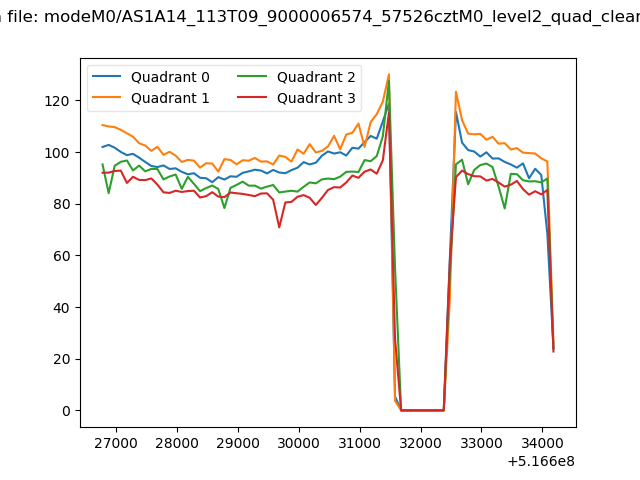 |
|
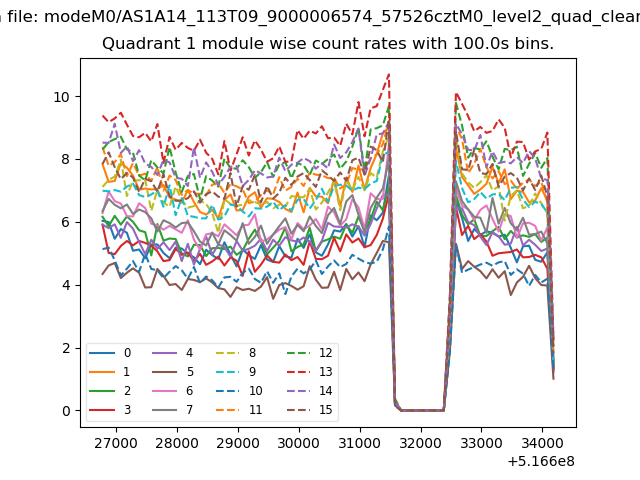
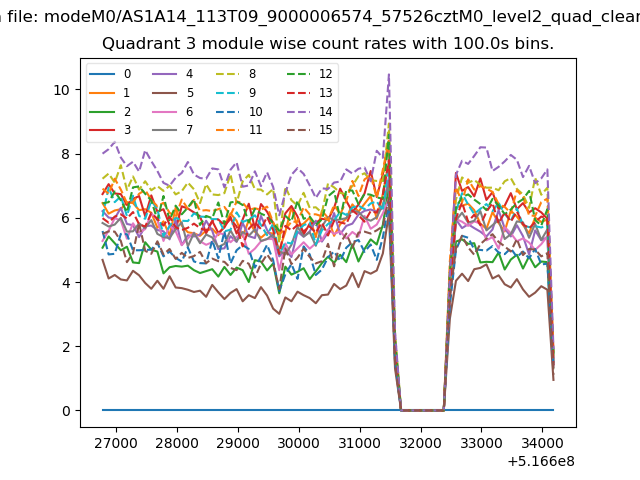
| Module-wise count rates for Quadrant A Data is divided into 100 sec bins |
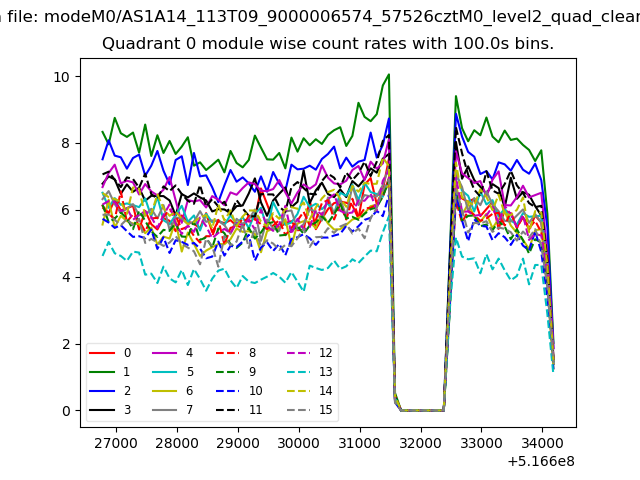 |
 |
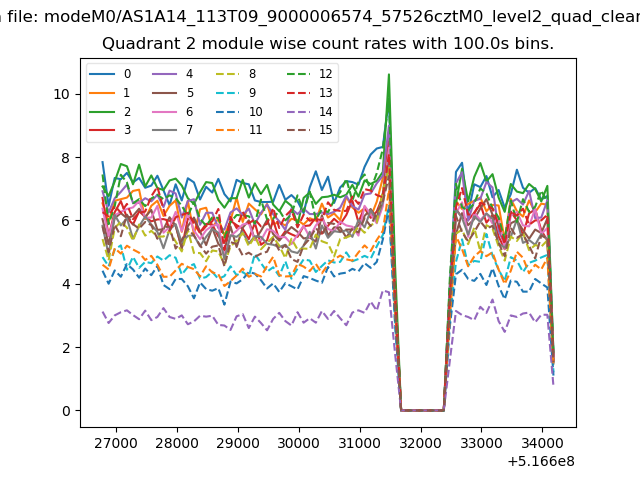
| Module-wise count rates for Quadrant B Data is divided into 100 sec bins |
 |
 |
| Module-wise count rates for Quadrant C Data is divided into 100 sec bins |
 |
 |
| Module-wise count rates for Quadrant D Data is divided into 100 sec bins |
 |
 |
| Parameter | Plot |
|---|---|
| CZT HV Monitor | 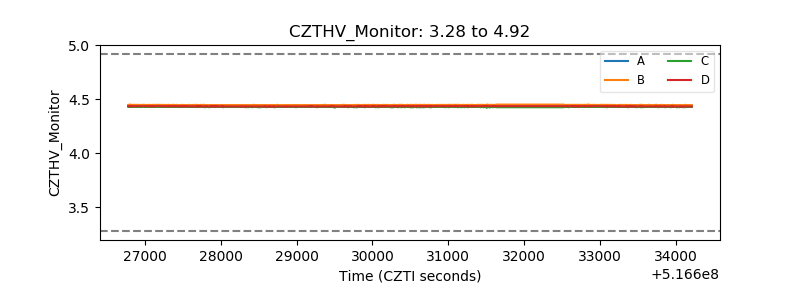 |
| D_VDD | 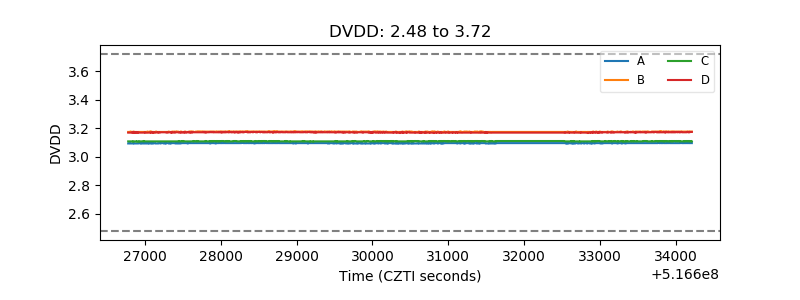 |
| Temperature 1 | 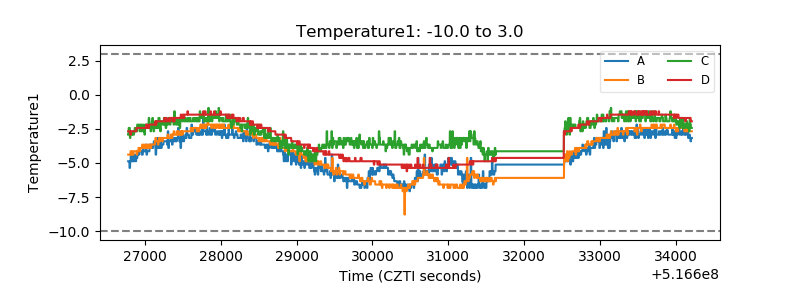 |
| Veto HV Monitor |  |
| Veto LLD | 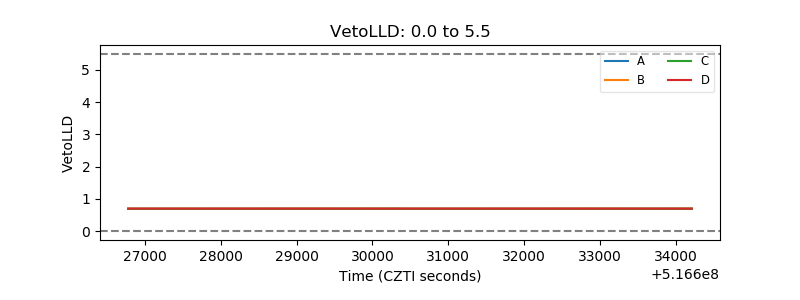 |
| Alpha Counter | 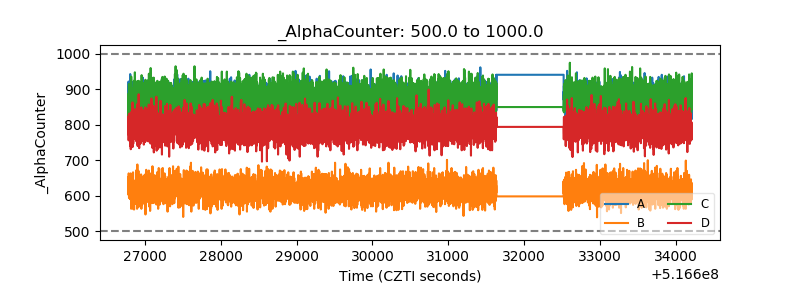 |
| _CPM_Rate | 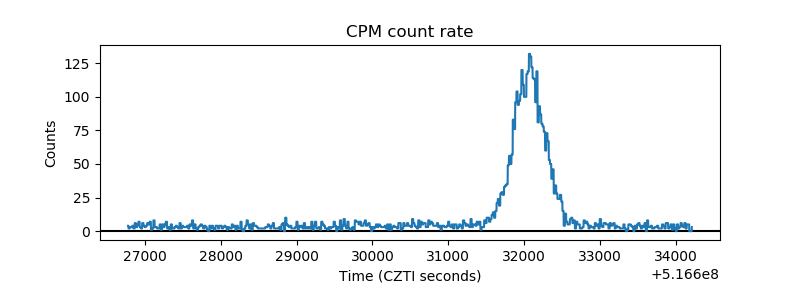 |
| CZT Counter | 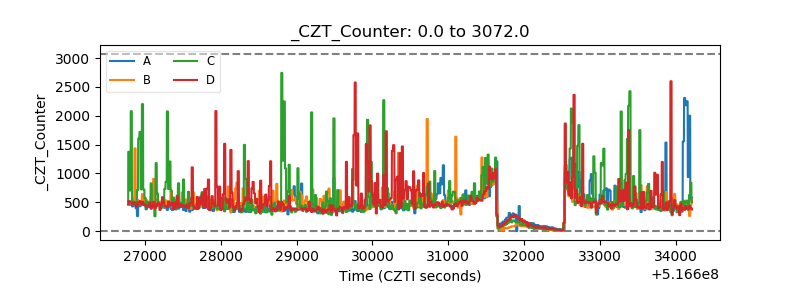 |
| +2.5 Volts monitor | 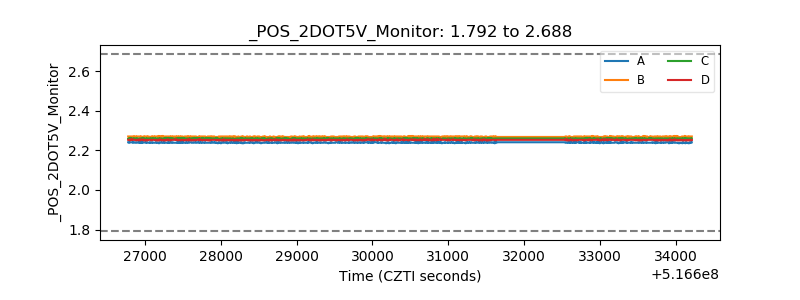 |
| +5 Volts monitor |  |
| _ROLL_ROT | 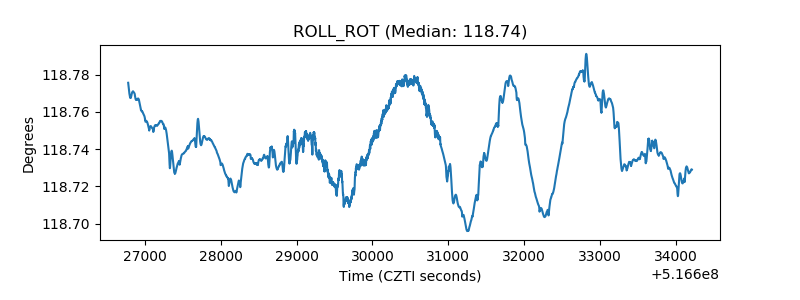 |
| _Roll_DEC | 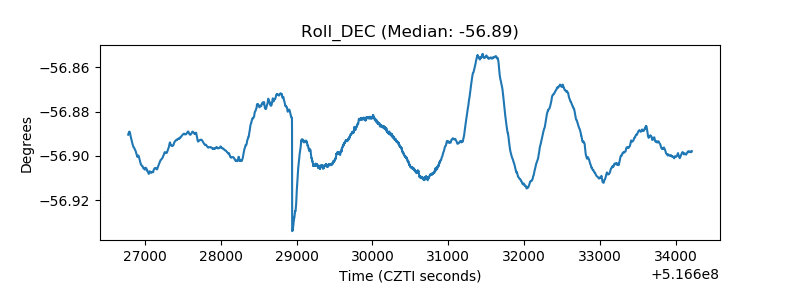 |
| _Roll_RA | 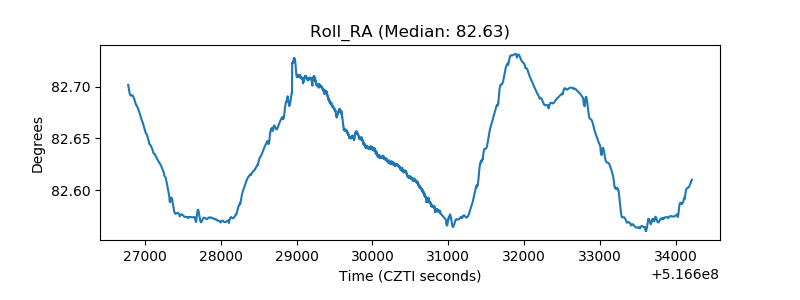 |
| Veto Counter | 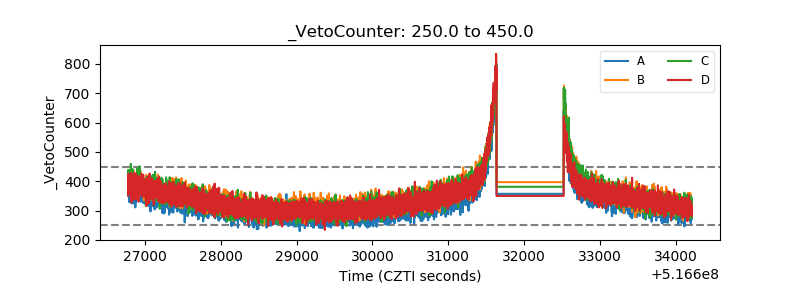 |