| Param | Original file | Final file |
|---|---|---|
| Filename | modeM0/AS1A14_113T09_9000006574_57527cztM0_level2.fits | modeM0/AS1A14_113T09_9000006574_57527cztM0_level2_quad_clean.evt |
| Size (bytes) | 415,056,960 | 97,698,240 |
| Size | 395.8 MB | 93.2 MB |
| Events in quadrant A | 3,573,357 | 638,509 |
| Events in quadrant B | 3,481,403 | 674,219 |
| Events in quadrant C | 4,111,834 | 602,635 |
| Events in quadrant D | 3,680,871 | 580,037 |
| Mode SS | |||
|---|---|---|---|
| Quadrant | BADHDUFLAG | Total packets | Discarded packets |
| A | 0 | 134 | 0 |
| B | 0 | 134 | 0 |
| C | 0 | 134 | 0 |
| D | 0 | 134 | 0 |
| Mode M9 | |||
|---|---|---|---|
| Quadrant | BADHDUFLAG | Total packets | Discarded packets |
| A | 0 | 6 | 0 |
| B | 0 | 6 | 0 |
| C | 0 | 6 | 0 |
| D | 0 | 6 | 0 |
| Mode M0 | |||
|---|---|---|---|
| Quadrant | BADHDUFLAG | Total packets | Discarded packets |
| A | 0 | 15668 | 1 |
| B | 0 | 14963 | 1 |
| C | 0 | 17057 | 1 |
| D | 0 | 15825 | 1 |
| Quadrant | Total seconds | Saturated seconds | Saturation percentage |
|---|---|---|---|
| A | 6640 | 123 | 1.852410% |
| B | 6640 | 128 | 1.927711% |
| C | 6640 | 191 | 2.876506% |
| D | 6640 | 97 | 1.460843% |
Noise dominated data is calculated using 1-second bins in cleaned event files. If a bin has >2000 counts, and if more than 50% of those come from <1% of pixels, then it is considered to be noise-dominated and hence unusable.
| Quadrant | # 1 sec bins | Bins with >0 counts | Bins with >2000 counts | High rate bins dominated by noise | Noise dominated (total time) | Noise dominated (detector-on time) | Marked lightcurve |
|---|---|---|---|---|---|---|---|
| A | 7200 | 6641 | 44 | 44 | 0.61% | 0.66% | 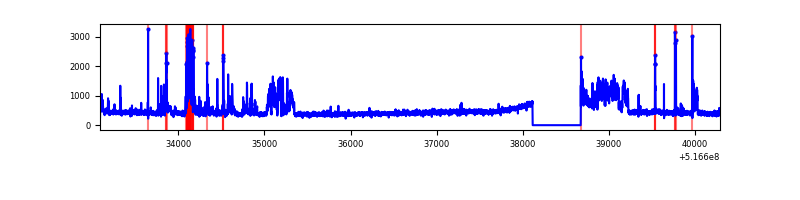 |
| B | 7200 | 6641 | 50 | 50 | 0.69% | 0.75% | 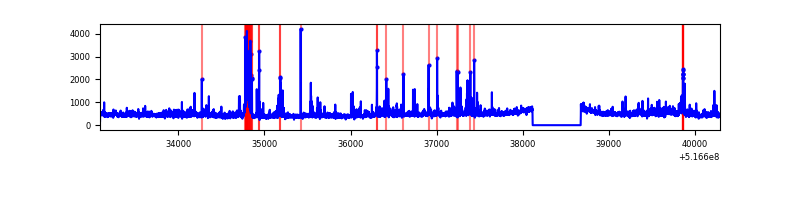 |
| C | 7200 | 6641 | 139 | 139 | 1.93% | 2.09% | 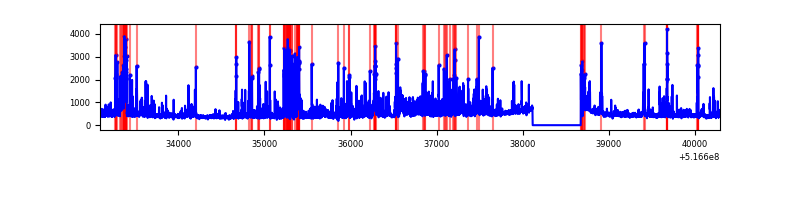 |
| D | 7200 | 6641 | 80 | 80 | 1.11% | 1.20% | 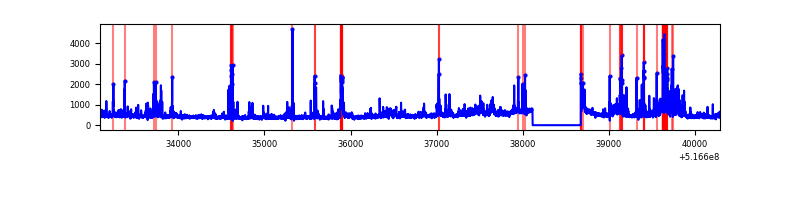 |
Top three noisy pixels from each quadrant. If the there are fewer than three noisy pixels in the level2.evt file, extra rows are filled as -1
| Pixel properties | Quadrant properties | ||||||
|---|---|---|---|---|---|---|---|
| Quadrant | DetID | PixID | Counts | Sigma | Mean | Median | Sigma |
| A | 3 | 14 | 532556 | 2955.68 | 718 | 697 | 179.9 |
| A | 7 | 14 | 208756 | 1156.24 | 718 | 697 | 179.9 |
| A | 13 | 248 | 34305 | 186.77 | 718 | 697 | 179.9 |
| B | 4 | 206 | 237861 | 1585.03 | 700 | 672 | 149.6 |
| B | 10 | 246 | 138316 | 919.82 | 700 | 672 | 149.6 |
| B | 5 | 185 | 100239 | 665.36 | 700 | 672 | 149.6 |
| C | 15 | 224 | 1145917 | 6109.33 | 684 | 676 | 187.5 |
| C | 14 | 246 | 177171 | 941.52 | 684 | 676 | 187.5 |
| C | 12 | 252 | 50065 | 263.47 | 684 | 676 | 187.5 |
| D | 15 | 142 | 384082 | 1963.85 | 691 | 662 | 195.2 |
| D | 3 | 12 | 155661 | 793.89 | 691 | 662 | 195.2 |
| D | 2 | 31 | 137974 | 703.3 | 691 | 662 | 195.2 |
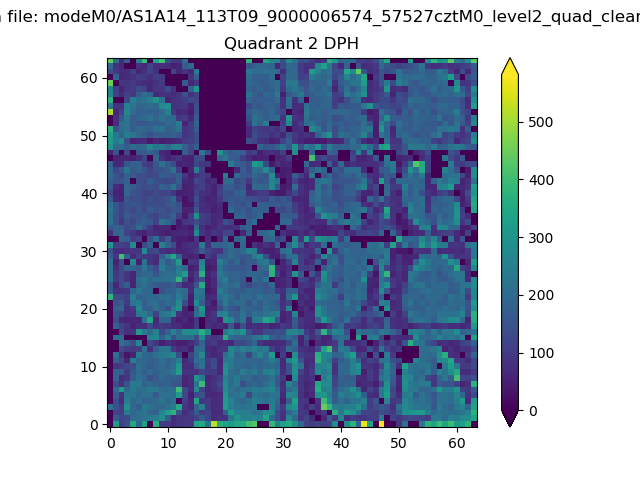
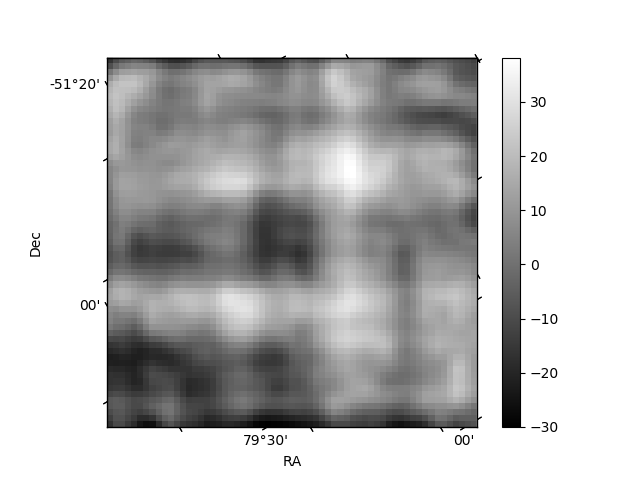
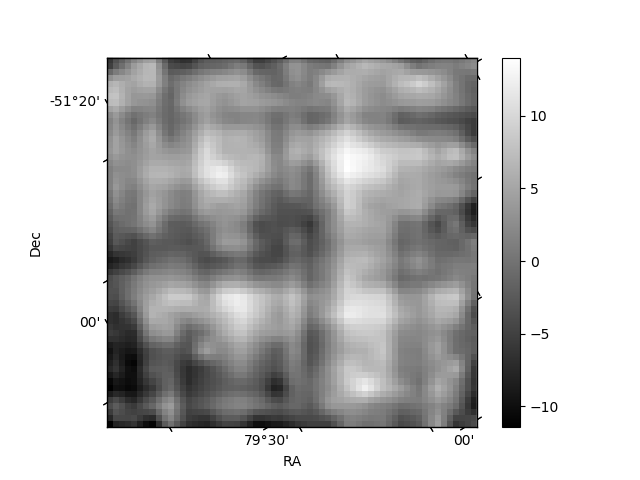
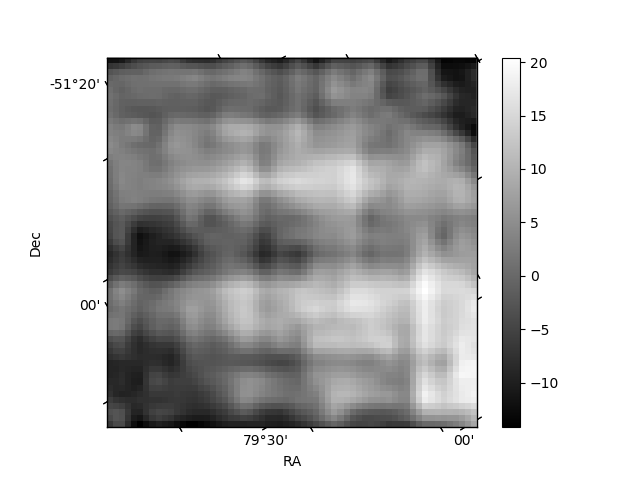
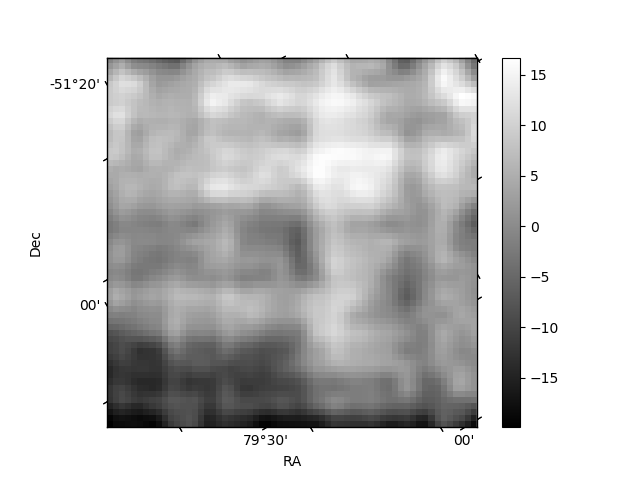
Histogram calculated using DETX and DETY for each event in the final _common_clean file
| Quadrant A | 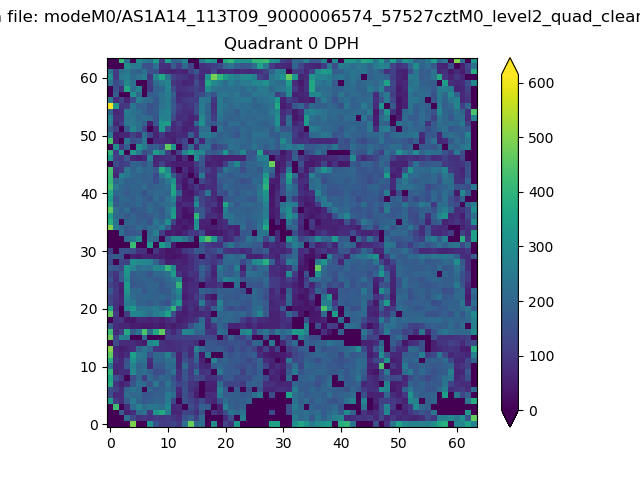 |
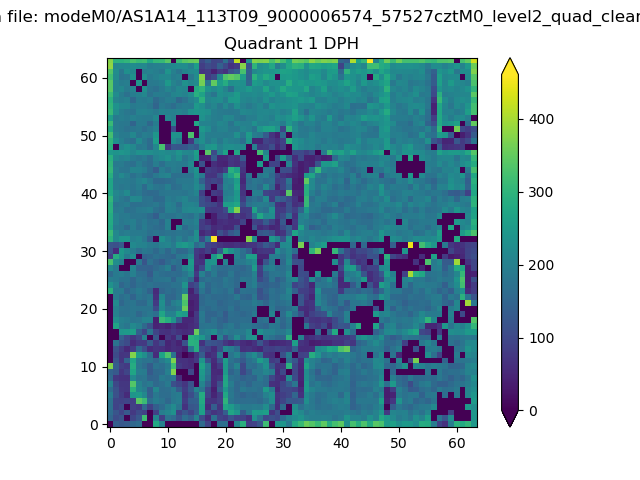 |
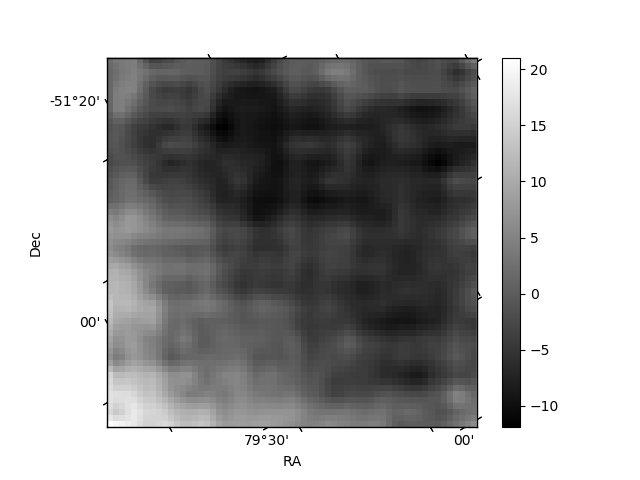
Quadrant B |
|---|---|---|---|
| Quadrant D | 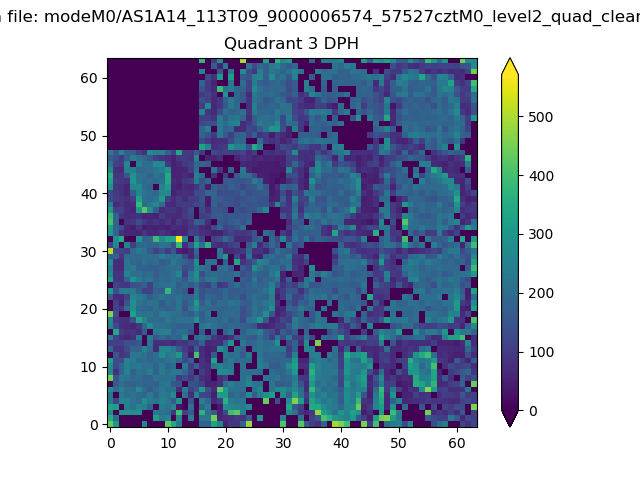 |
 |
Quadrant C |
| Plot type | Count rate plots | Images |
|---|---|---|
| Comparison with Poisson distribution Blue bars denote a histogram of data divided into 1 sec bins. Red curve is a Poisson curve with rate = median count rate of data. |
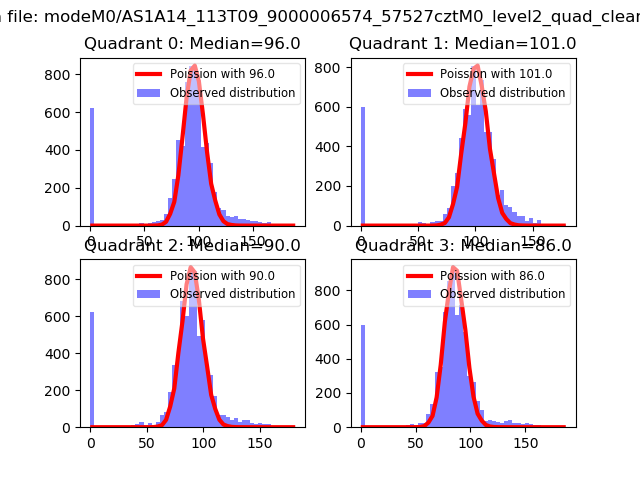 |
 |
| Quadrant-wise count rates Data is divided into 100 sec bins |
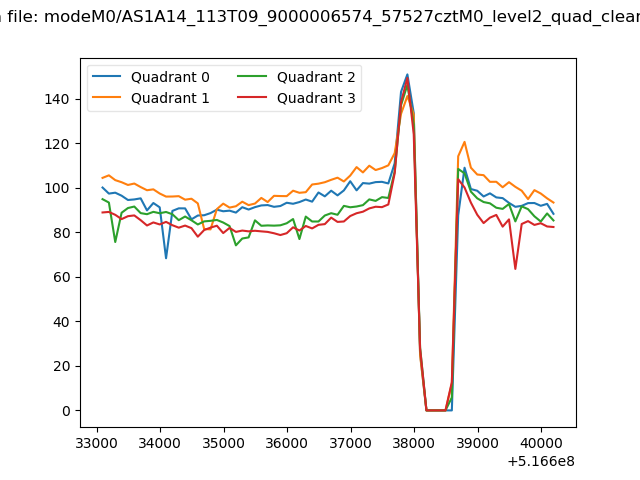 |
|
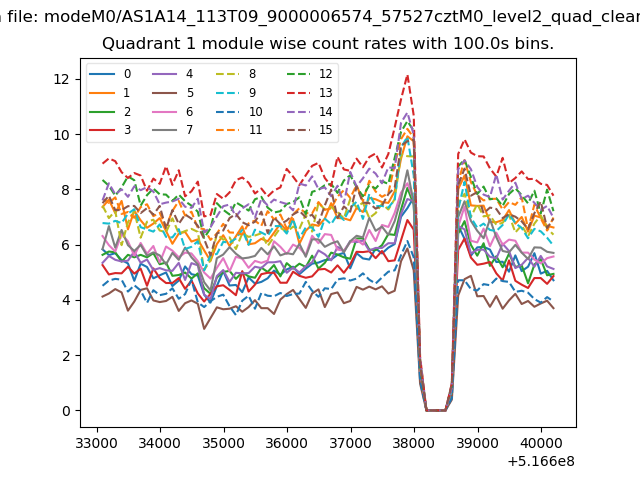
| Module-wise count rates for Quadrant A Data is divided into 100 sec bins |
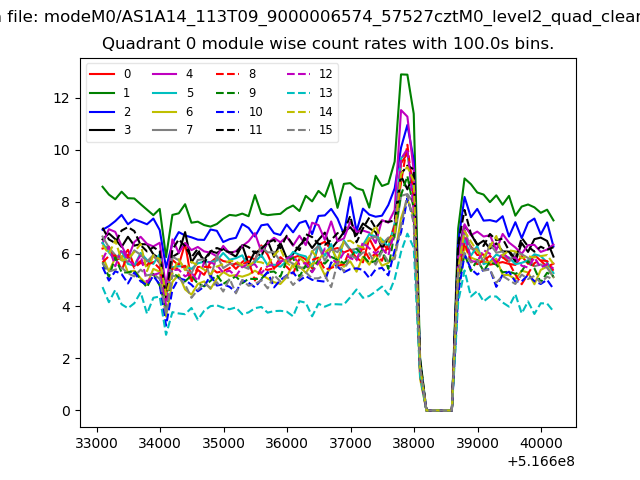 |
 |
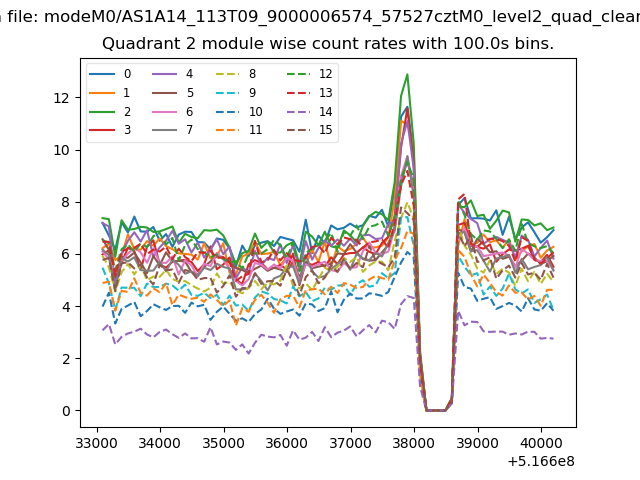
| Module-wise count rates for Quadrant B Data is divided into 100 sec bins |
 |
 |
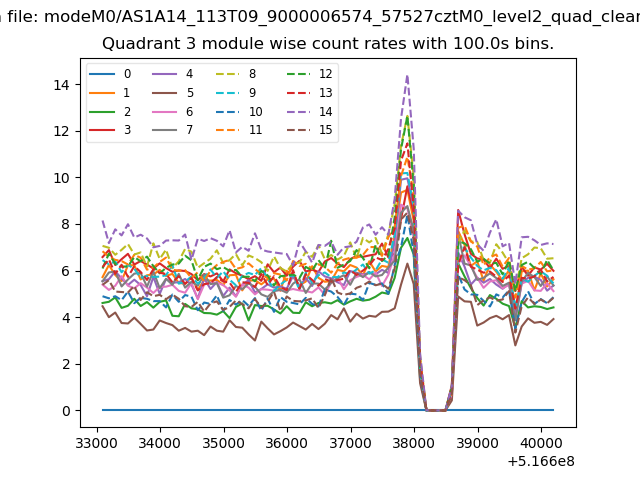
| Module-wise count rates for Quadrant C Data is divided into 100 sec bins |
 |
 |
| Module-wise count rates for Quadrant D Data is divided into 100 sec bins |
 |
 |
| Parameter | Plot |
|---|---|
| CZT HV Monitor | 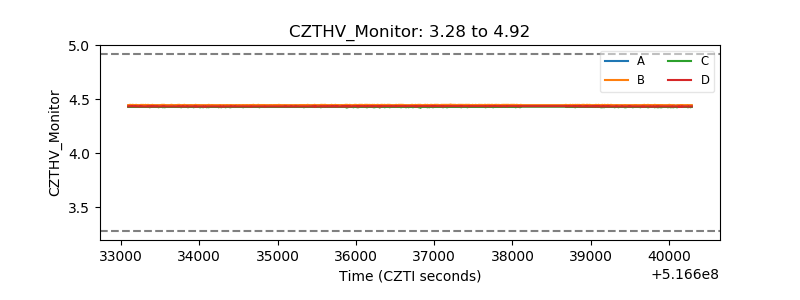 |
| D_VDD | 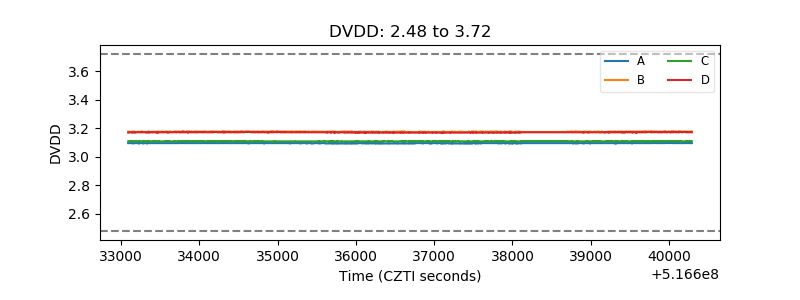 |
| Temperature 1 | 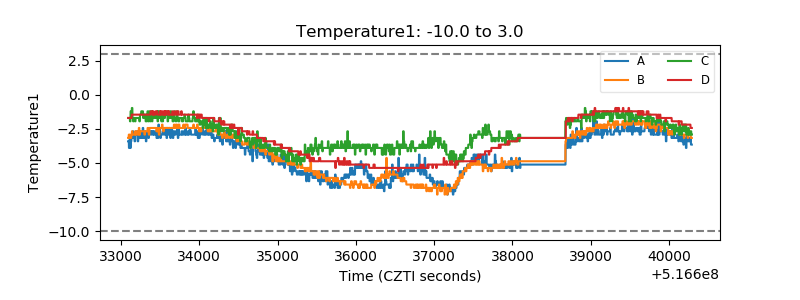 |
| Veto HV Monitor | 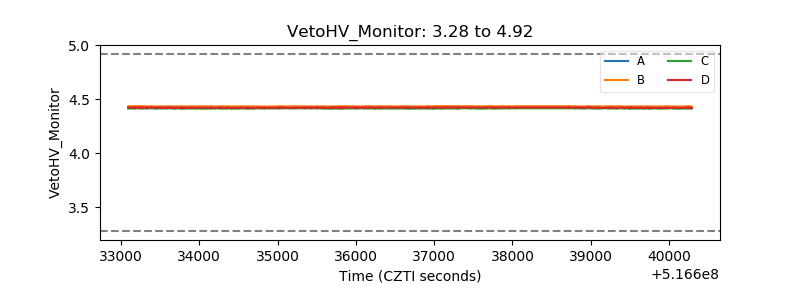 |
| Veto LLD | 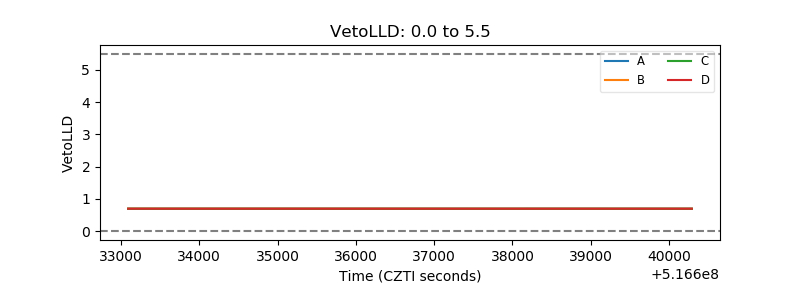 |
| Alpha Counter | 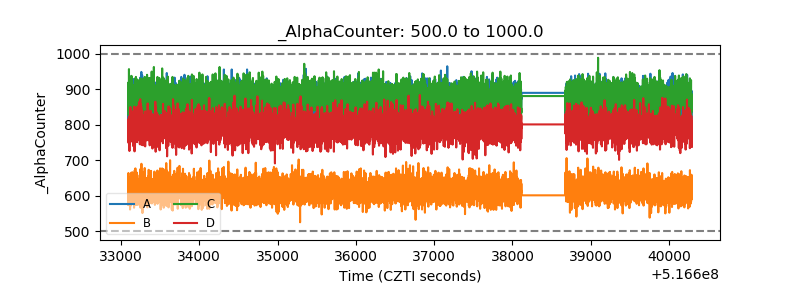 |
| _CPM_Rate | 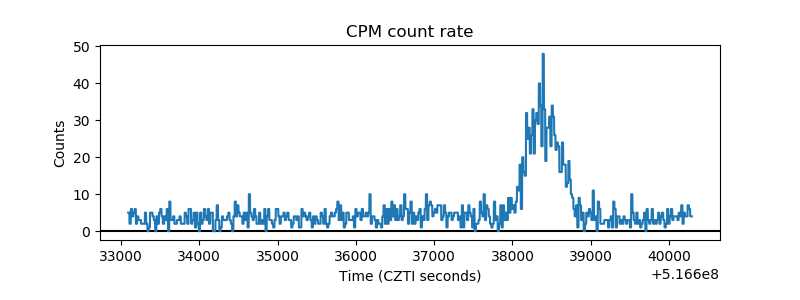 |
| CZT Counter | 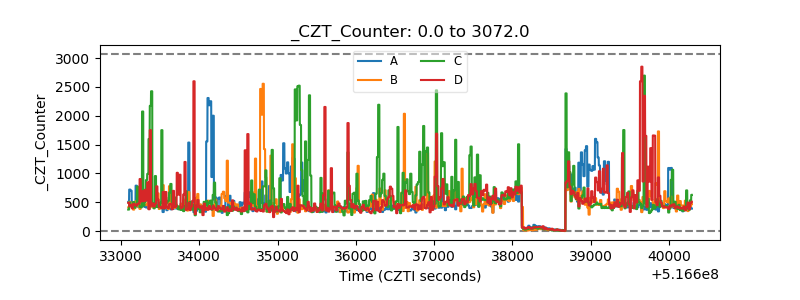 |
| +2.5 Volts monitor | 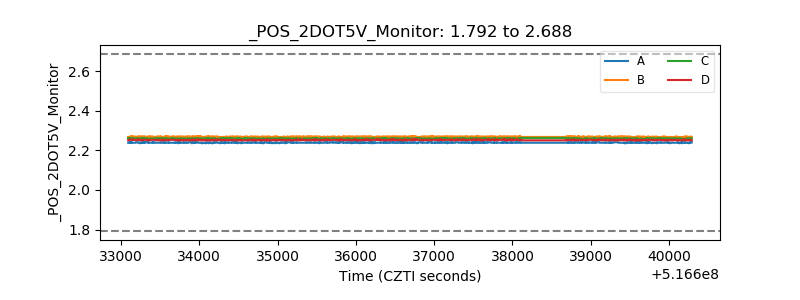 |
| +5 Volts monitor |  |
| _ROLL_ROT | 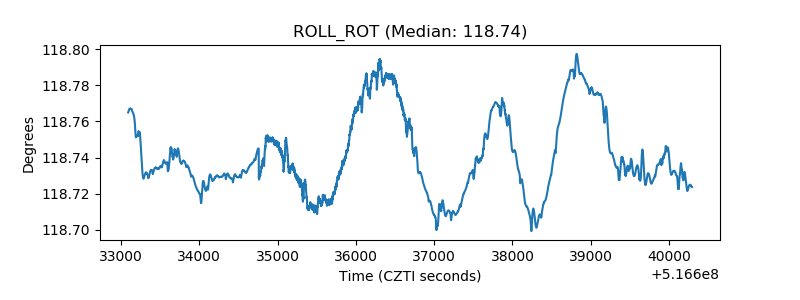 |
| _Roll_DEC | 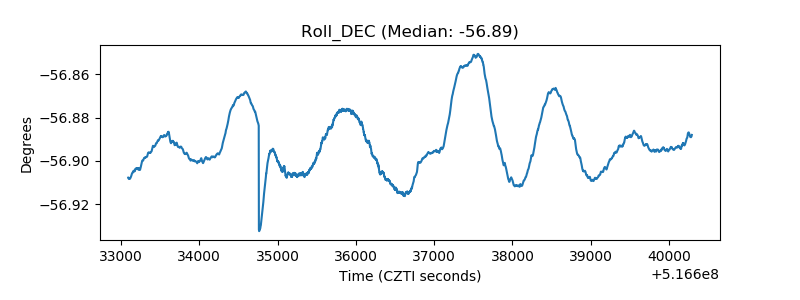 |
| _Roll_RA | 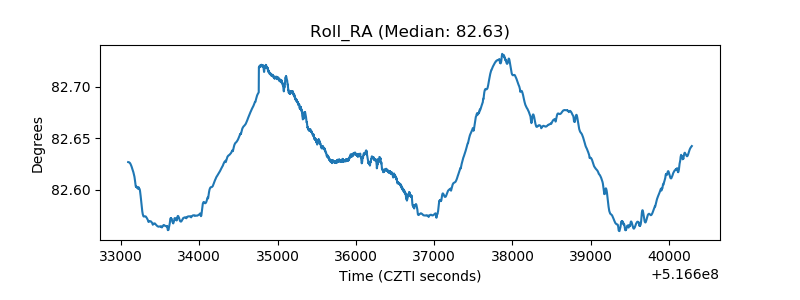 |
| Veto Counter | 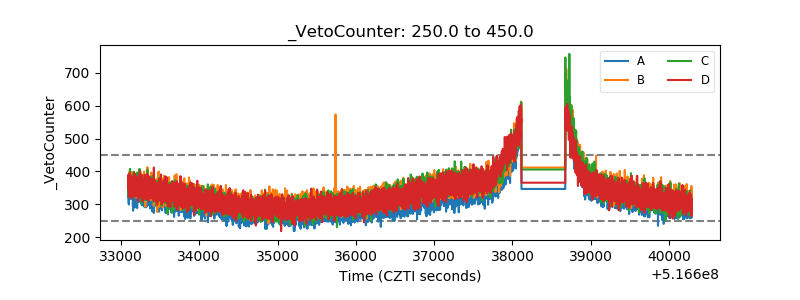 |