| Param | Original file | Final file |
|---|---|---|
| Filename | modeM0/AS1A14_113T09_9000006574_57528cztM0_level2.fits | modeM0/AS1A14_113T09_9000006574_57528cztM0_level2_quad_clean.evt |
| Size (bytes) | 465,091,200 | 103,420,800 |
| Size | 443.5 MB | 98.6 MB |
| Events in quadrant A | 4,639,497 | 667,148 |
| Events in quadrant B | 3,579,379 | 718,575 |
| Events in quadrant C | 4,524,203 | 638,909 |
| Events in quadrant D | 3,920,966 | 611,958 |
| Mode SS | |||
|---|---|---|---|
| Quadrant | BADHDUFLAG | Total packets | Discarded packets |
| A | 0 | 142 | 0 |
| B | 0 | 142 | 0 |
| C | 0 | 142 | 0 |
| D | 0 | 142 | 0 |
| Mode M0 | |||
|---|---|---|---|
| Quadrant | BADHDUFLAG | Total packets | Discarded packets |
| A | 0 | 19017 | 2 |
| B | 0 | 15615 | 3 |
| C | 0 | 18515 | 2 |
| D | 0 | 16850 | 2 |
| Quadrant | Total seconds | Saturated seconds | Saturation percentage |
|---|---|---|---|
| A | 7104 | 206 | 2.899775% |
| B | 7104 | 123 | 1.731419% |
| C | 7104 | 201 | 2.829392% |
| D | 7104 | 126 | 1.773649% |
Noise dominated data is calculated using 1-second bins in cleaned event files. If a bin has >2000 counts, and if more than 50% of those come from <1% of pixels, then it is considered to be noise-dominated and hence unusable.
| Quadrant | # 1 sec bins | Bins with >0 counts | Bins with >2000 counts | High rate bins dominated by noise | Noise dominated (total time) | Noise dominated (detector-on time) | Marked lightcurve |
|---|---|---|---|---|---|---|---|
| A | 7134 | 7106 | 10 | 10 | 0.14% | 0.14% | 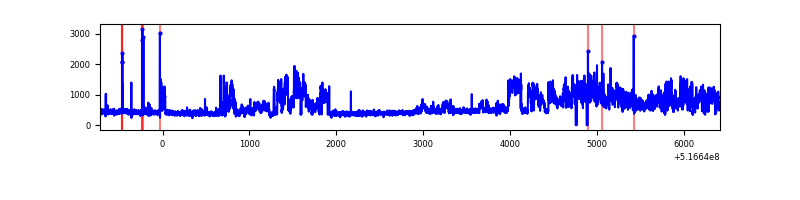 |
| B | 7134 | 7106 | 19 | 19 | 0.27% | 0.27% | 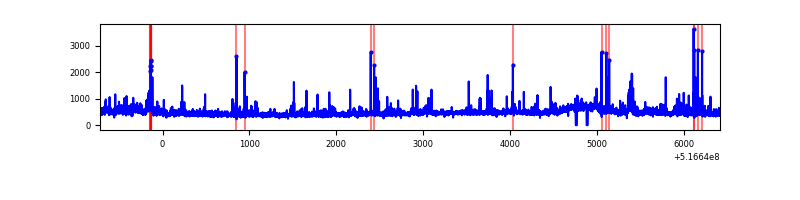 |
| C | 7134 | 7106 | 141 | 141 | 1.98% | 1.98% | 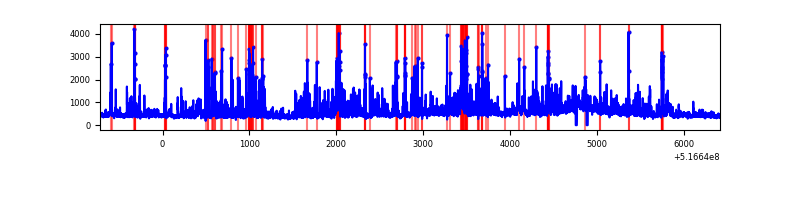 |
| D | 7134 | 7106 | 110 | 110 | 1.54% | 1.55% | 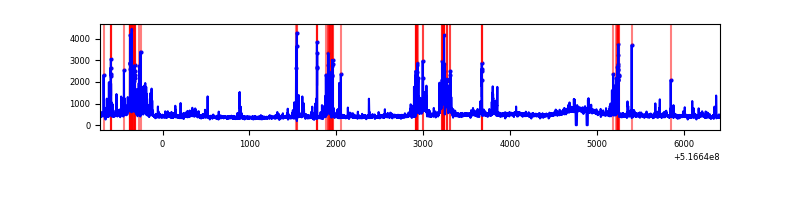 |
Top three noisy pixels from each quadrant. If the there are fewer than three noisy pixels in the level2.evt file, extra rows are filled as -1
| Pixel properties | Quadrant properties | ||||||
|---|---|---|---|---|---|---|---|
| Quadrant | DetID | PixID | Counts | Sigma | Mean | Median | Sigma |
| A | 3 | 14 | 1589730 | 8450.12 | 768 | 749 | 188.0 |
| A | 7 | 14 | 25022 | 129.08 | 768 | 749 | 188.0 |
| A | 10 | 251 | 22023 | 113.13 | 768 | 749 | 188.0 |
| B | 4 | 206 | 233547 | 1438.09 | 757 | 728 | 161.9 |
| B | 10 | 247 | 75634 | 462.68 | 757 | 728 | 161.9 |
| B | 0 | 245 | 61121 | 373.04 | 757 | 728 | 161.9 |
| C | 15 | 224 | 1323587 | 6553.54 | 738 | 732 | 201.9 |
| C | 12 | 252 | 167433 | 825.85 | 738 | 732 | 201.9 |
| C | 1 | 44 | 44708 | 217.86 | 738 | 732 | 201.9 |
| D | 15 | 142 | 442449 | 2117.46 | 743 | 710 | 208.6 |
| D | 3 | 12 | 160960 | 768.15 | 743 | 710 | 208.6 |
| D | 8 | 160 | 112254 | 534.68 | 743 | 710 | 208.6 |
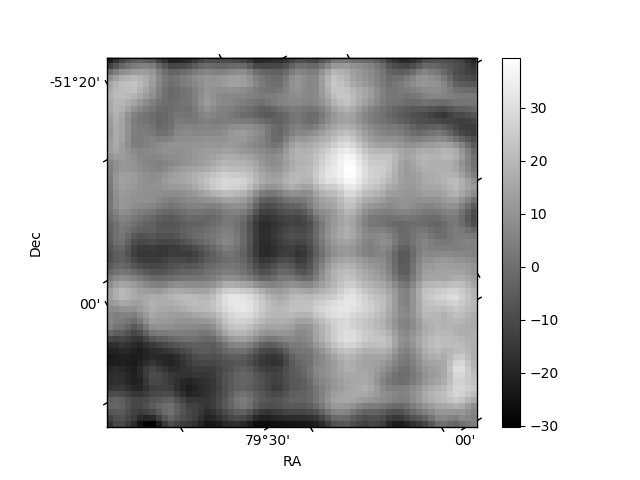
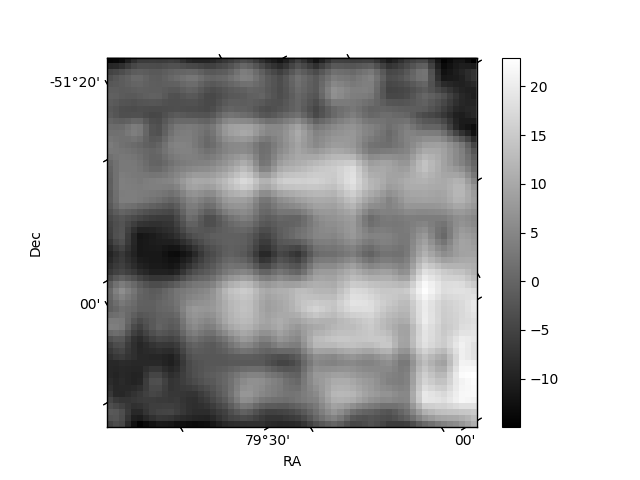
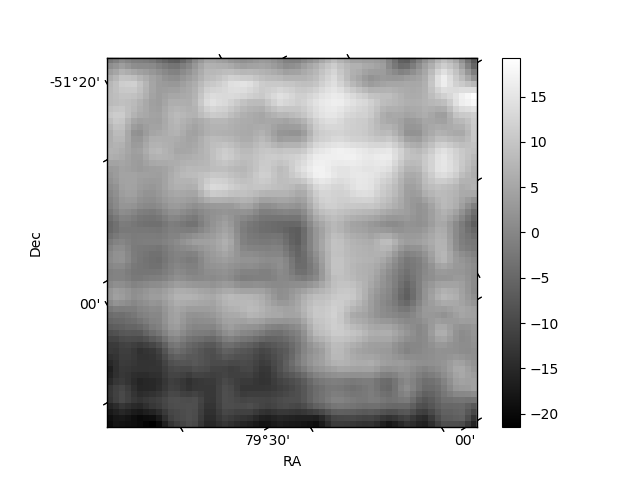
Histogram calculated using DETX and DETY for each event in the final _common_clean file
| Quadrant A | 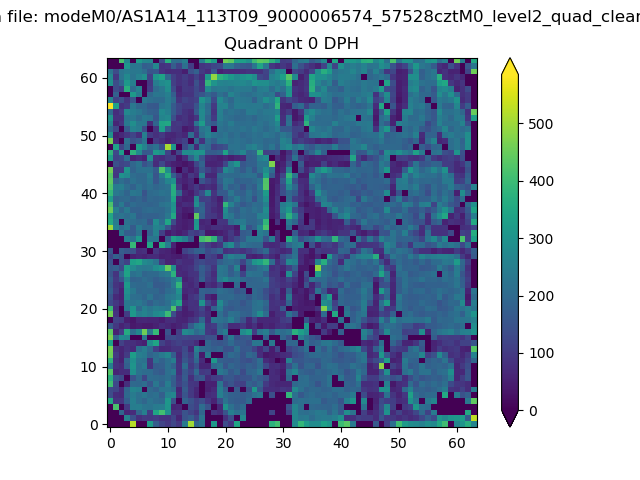 |
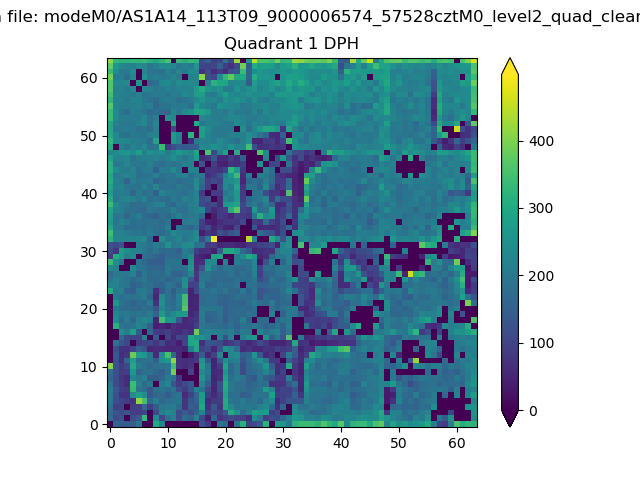 |
Quadrant B |
|---|---|---|---|
| Quadrant D | 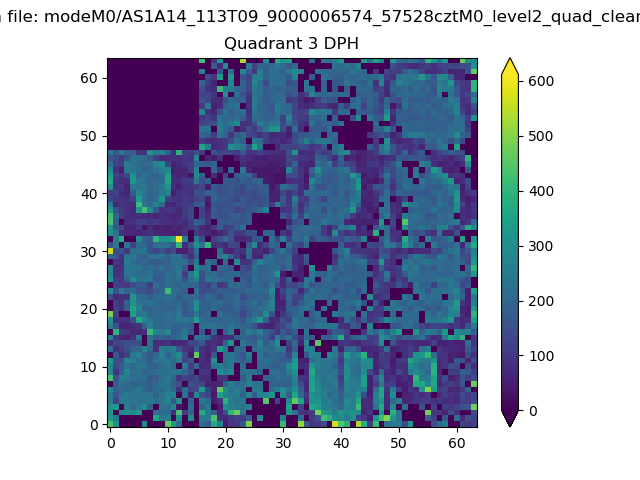 |
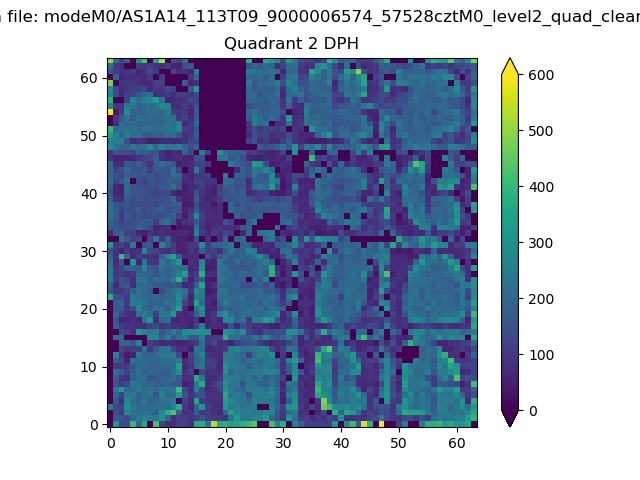 |
Quadrant C |
| Plot type | Count rate plots | Images |
|---|---|---|
| Comparison with Poisson distribution Blue bars denote a histogram of data divided into 1 sec bins. Red curve is a Poisson curve with rate = median count rate of data. |
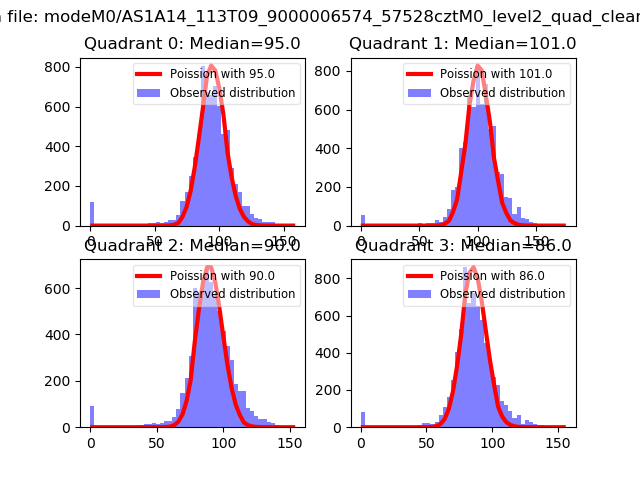 |
 |
| Quadrant-wise count rates Data is divided into 100 sec bins |
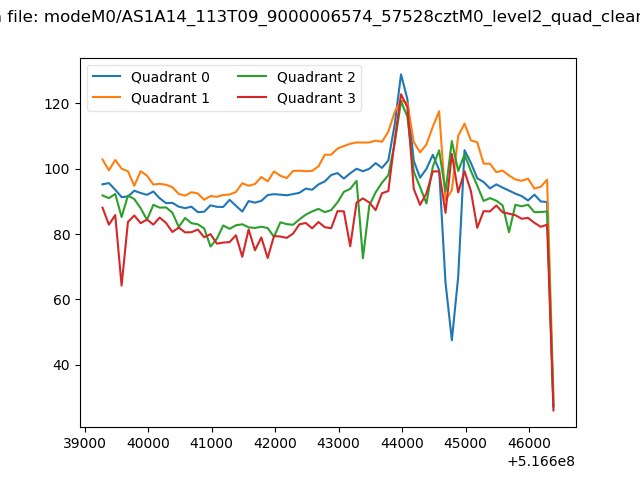 |
|
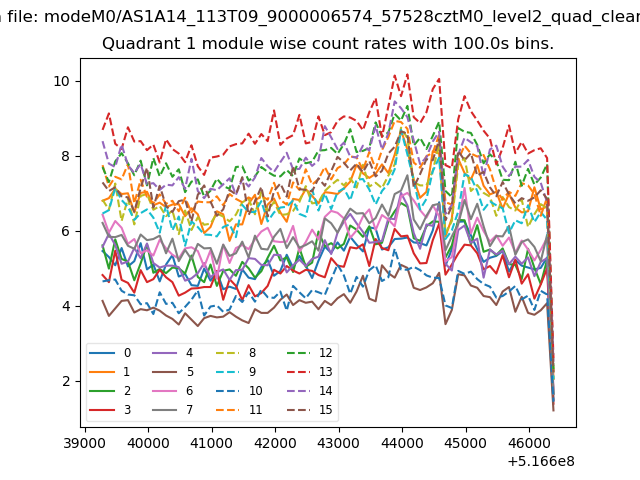
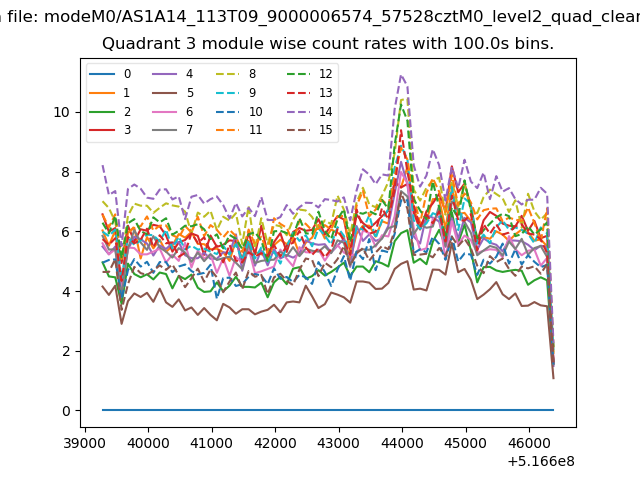
| Module-wise count rates for Quadrant A Data is divided into 100 sec bins |
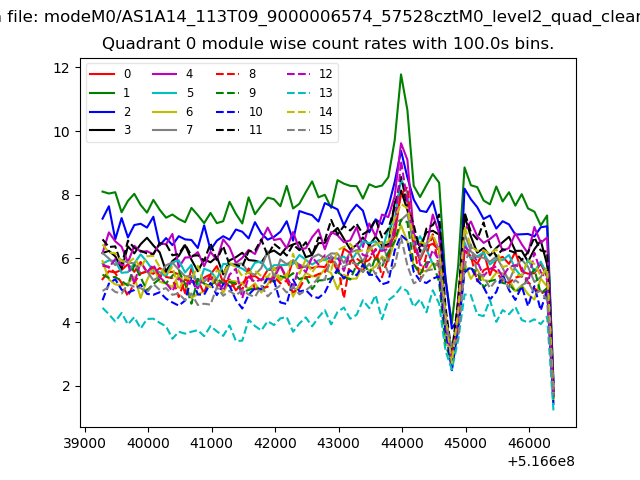 |
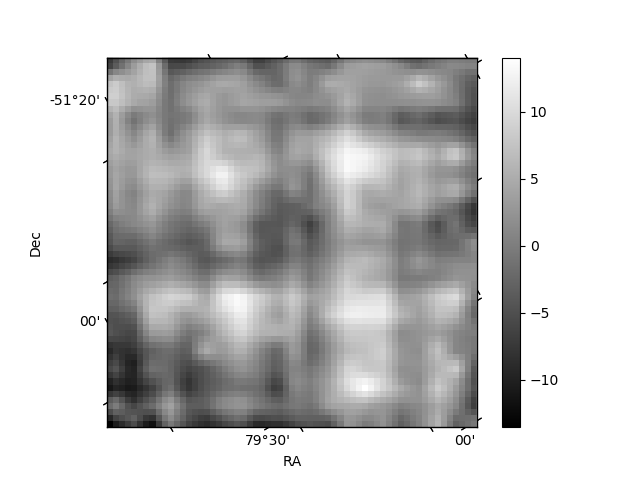 |
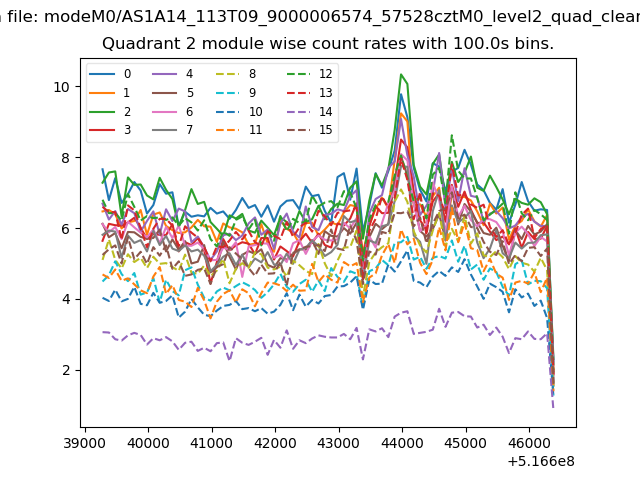
| Module-wise count rates for Quadrant B Data is divided into 100 sec bins |
 |
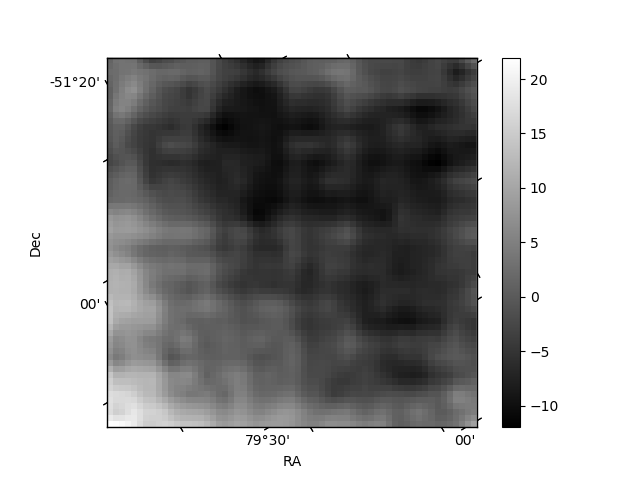 |
| Module-wise count rates for Quadrant C Data is divided into 100 sec bins |
 |
 |
| Module-wise count rates for Quadrant D Data is divided into 100 sec bins |
 |
 |
| Parameter | Plot |
|---|---|
| CZT HV Monitor | 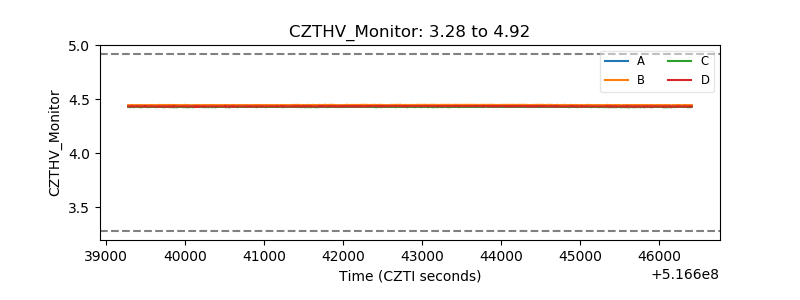 |
| D_VDD | 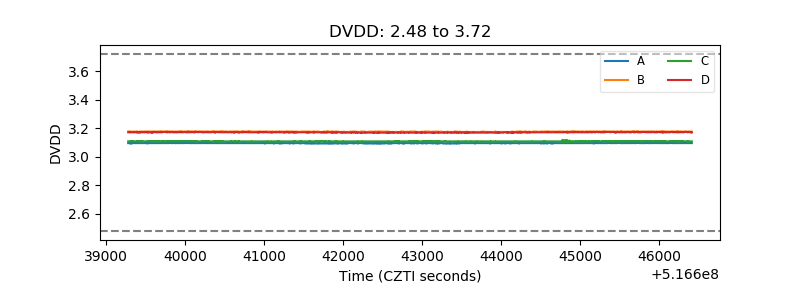 |
| Temperature 1 | 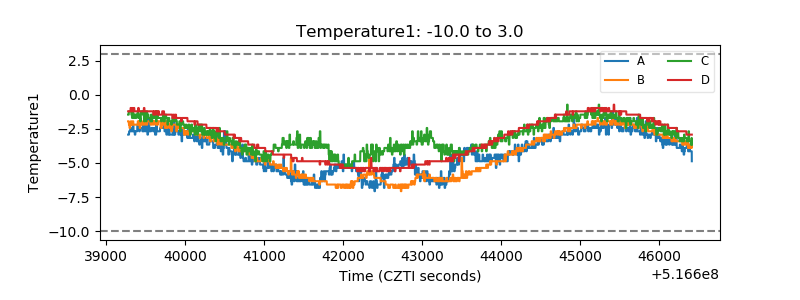 |
| Veto HV Monitor | 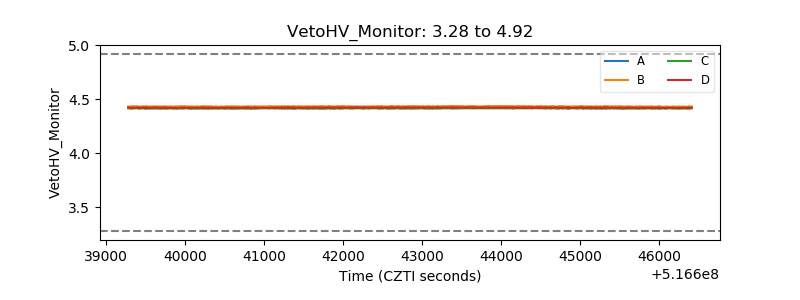 |
| Veto LLD | 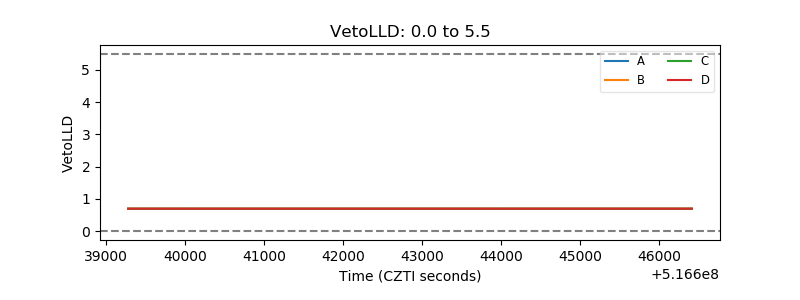 |
| Alpha Counter | 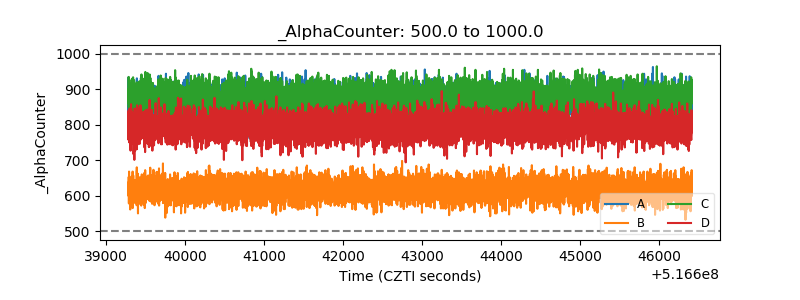 |
| _CPM_Rate | 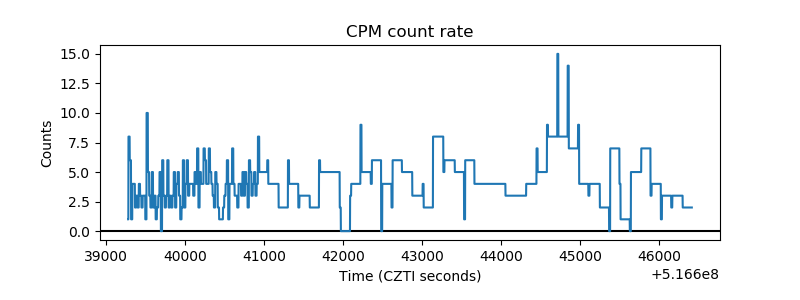 |
| CZT Counter | 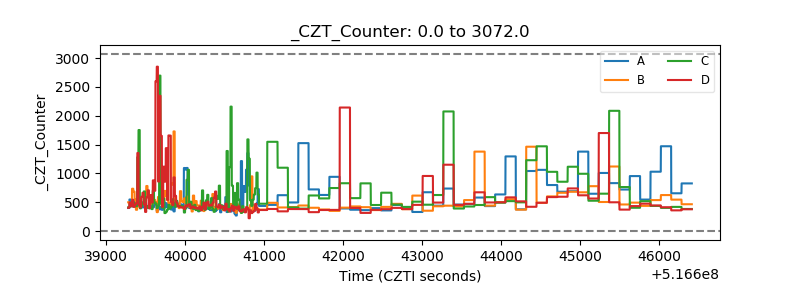 |
| +2.5 Volts monitor |  |
| +5 Volts monitor |  |
| _ROLL_ROT | 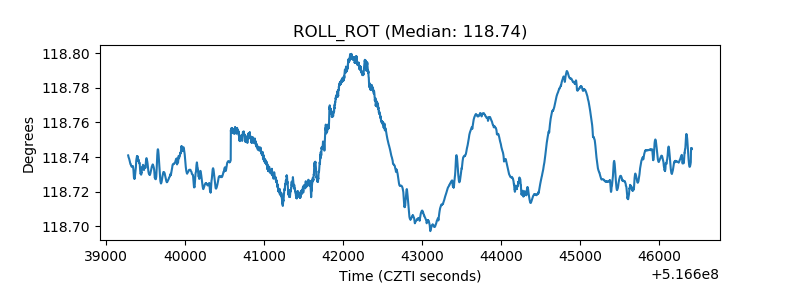 |
| _Roll_DEC | 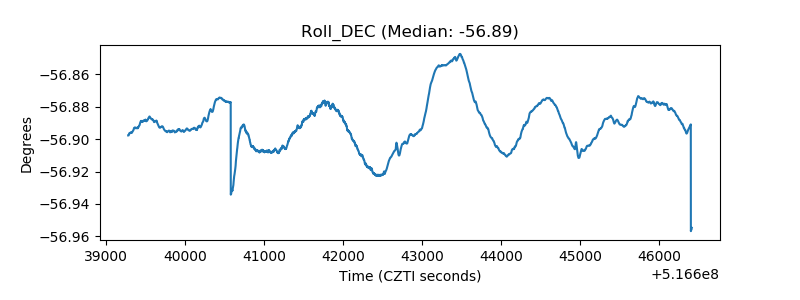 |
| _Roll_RA | 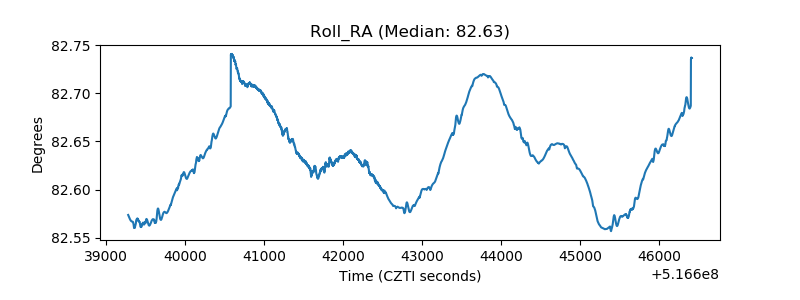 |
| Veto Counter | 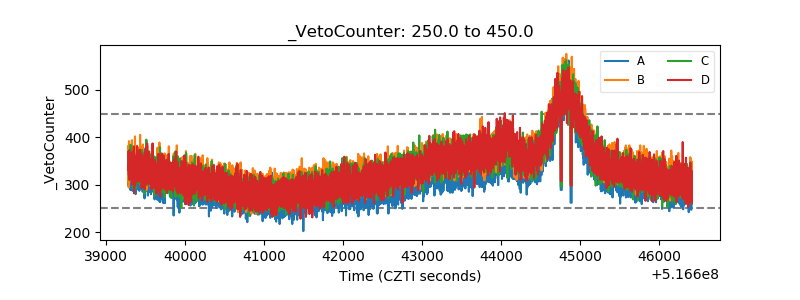 |