| Param | Original file | Final file |
|---|---|---|
| Filename | modeM0/AS1A14_113T09_9000006574_57529cztM0_level2.fits | modeM0/AS1A14_113T09_9000006574_57529cztM0_level2_quad_clean.evt |
| Size (bytes) | 481,118,400 | 109,586,880 |
| Size | 458.8 MB | 104.5 MB |
| Events in quadrant A | 4,476,852 | 719,432 |
| Events in quadrant B | 3,883,388 | 762,679 |
| Events in quadrant C | 5,294,195 | 652,760 |
| Events in quadrant D | 3,562,869 | 653,031 |
| Mode SS | |||
|---|---|---|---|
| Quadrant | BADHDUFLAG | Total packets | Discarded packets |
| A | 0 | 152 | 0 |
| B | 0 | 152 | 0 |
| C | 0 | 152 | 0 |
| D | 0 | 152 | 0 |
| Mode M0 | |||
|---|---|---|---|
| Quadrant | BADHDUFLAG | Total packets | Discarded packets |
| A | 0 | 18805 | 0 |
| B | 0 | 16844 | 1 |
| C | 0 | 21223 | 0 |
| D | 0 | 16166 | 0 |
| Quadrant | Total seconds | Saturated seconds | Saturation percentage |
|---|---|---|---|
| A | 7623 | 28 | 0.367309% |
| B | 7622 | 56 | 0.734715% |
| C | 7622 | 383 | 5.024928% |
| D | 7623 | 21 | 0.275482% |
Noise dominated data is calculated using 1-second bins in cleaned event files. If a bin has >2000 counts, and if more than 50% of those come from <1% of pixels, then it is considered to be noise-dominated and hence unusable.
| Quadrant | # 1 sec bins | Bins with >0 counts | Bins with >2000 counts | High rate bins dominated by noise | Noise dominated (total time) | Noise dominated (detector-on time) | Marked lightcurve |
|---|---|---|---|---|---|---|---|
| A | 7623 | 7623 | 20 | 20 | 0.26% | 0.26% | 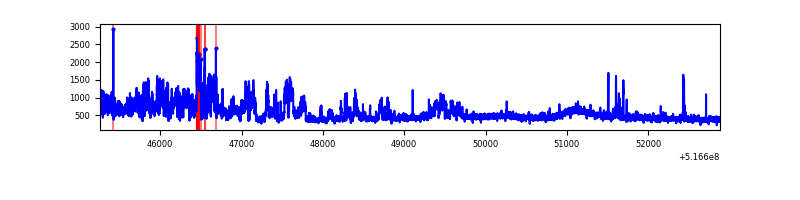 |
| B | 7622 | 7622 | 23 | 23 | 0.30% | 0.30% | 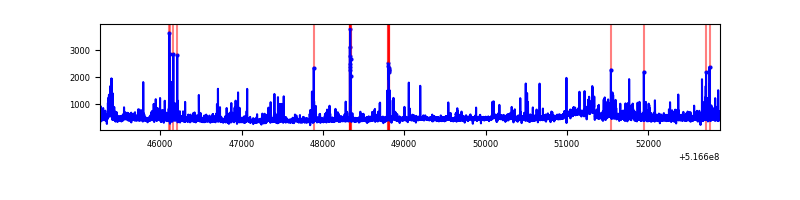 |
| C | 7622 | 7622 | 306 | 306 | 4.01% | 4.01% | 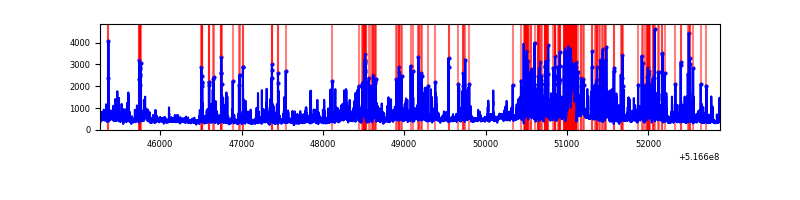 |
| D | 7623 | 7623 | 19 | 19 | 0.25% | 0.25% | 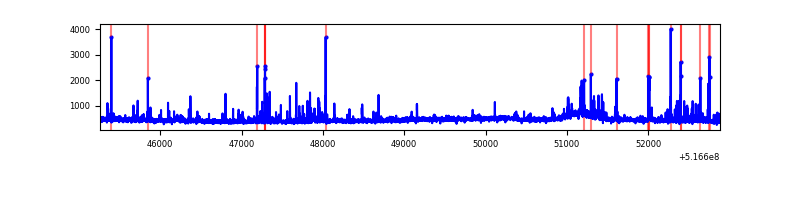 |
Top three noisy pixels from each quadrant. If the there are fewer than three noisy pixels in the level2.evt file, extra rows are filled as -1
| Pixel properties | Quadrant properties | ||||||
|---|---|---|---|---|---|---|---|
| Quadrant | DetID | PixID | Counts | Sigma | Mean | Median | Sigma |
| A | 3 | 14 | 1169826 | 5854.16 | 814 | 793 | 199.7 |
| A | 7 | 14 | 74630 | 369.75 | 814 | 793 | 199.7 |
| A | 3 | 245 | 29110 | 141.8 | 814 | 793 | 199.7 |
| B | 4 | 206 | 271278 | 1569.29 | 801 | 771 | 172.4 |
| B | 0 | 245 | 73224 | 420.32 | 801 | 771 | 172.4 |
| B | 7 | 252 | 57115 | 326.87 | 801 | 771 | 172.4 |
| C | 15 | 224 | 1614886 | 7670.18 | 766 | 758 | 210.4 |
| C | 14 | 245 | 306056 | 1450.75 | 766 | 758 | 210.4 |
| C | 12 | 252 | 220155 | 1042.55 | 766 | 758 | 210.4 |
| D | 3 | 12 | 101391 | 454.79 | 787 | 752 | 221.3 |
| D | 5 | 173 | 72779 | 325.49 | 787 | 752 | 221.3 |
| D | 7 | 253 | 52028 | 231.72 | 787 | 752 | 221.3 |
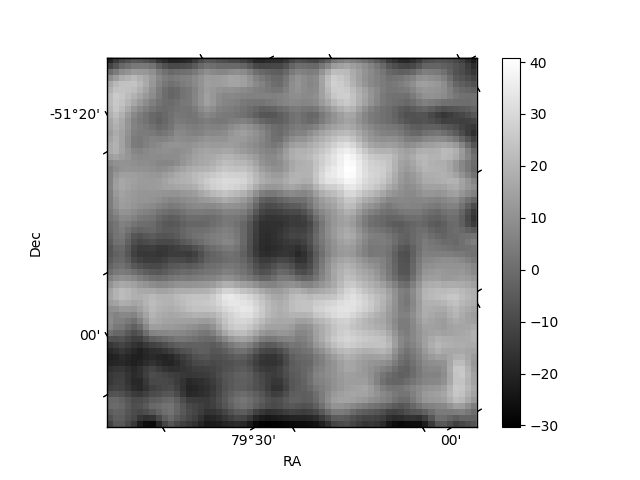
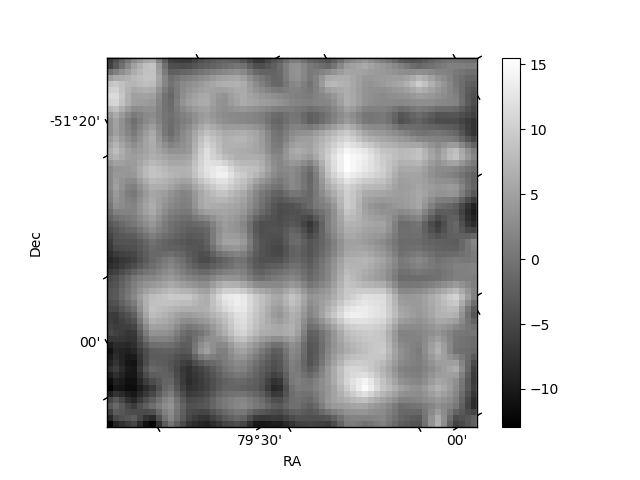
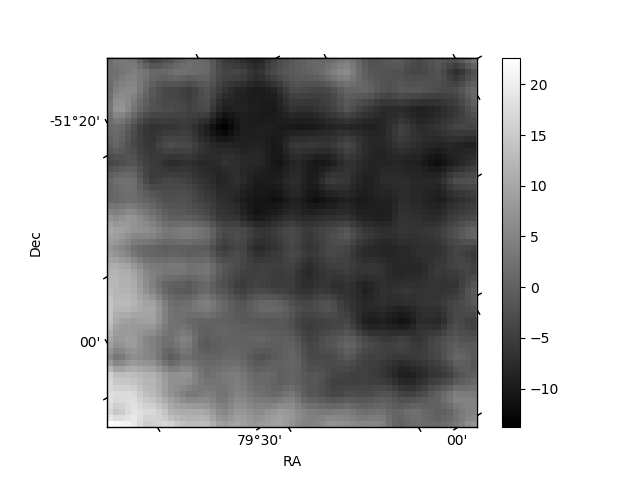
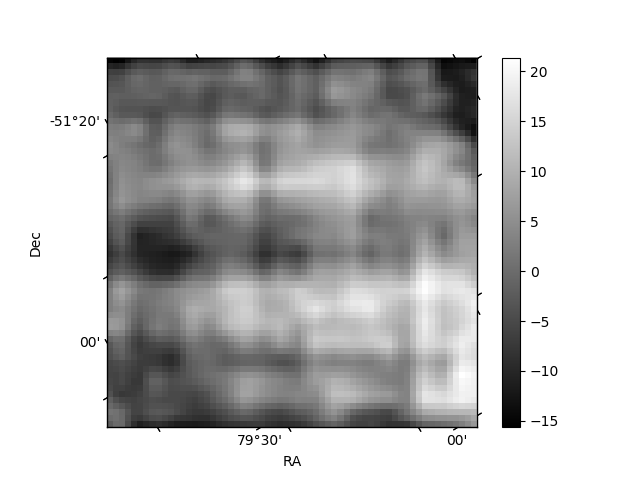
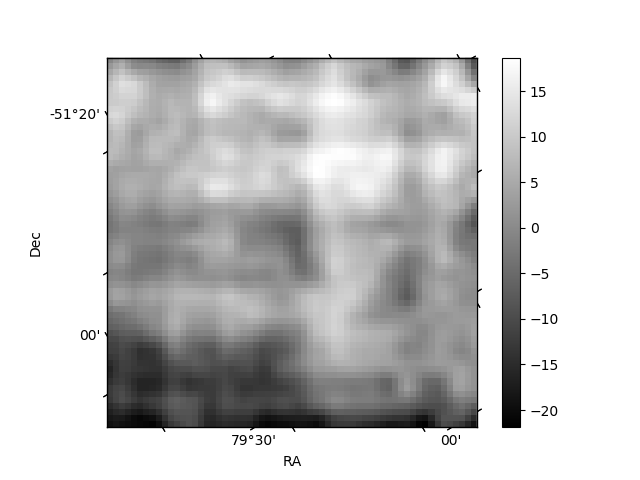
Histogram calculated using DETX and DETY for each event in the final _common_clean file
| Quadrant A | 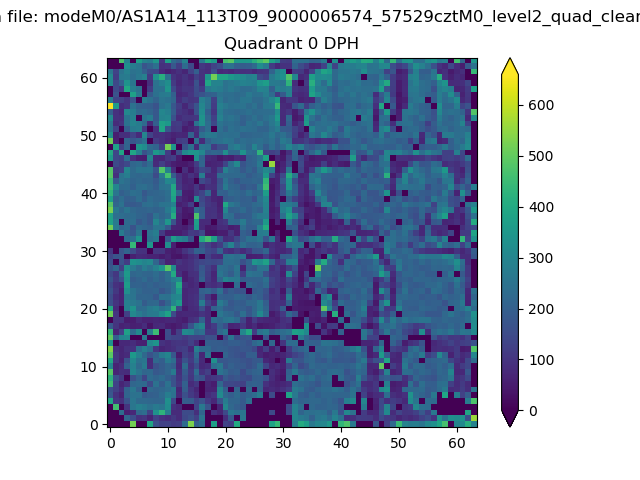 |
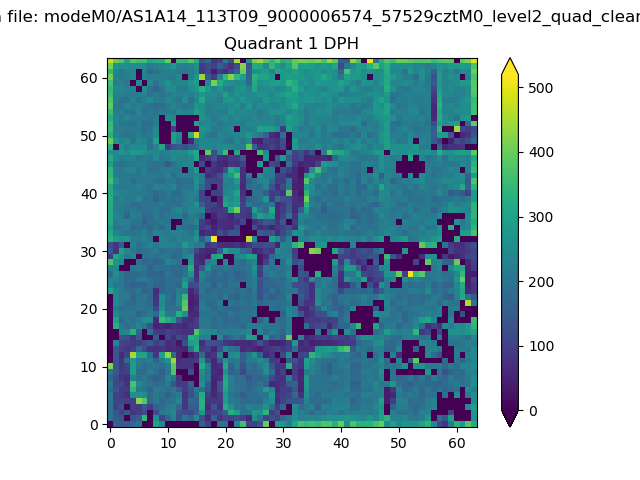 |
Quadrant B |
|---|---|---|---|
| Quadrant D | 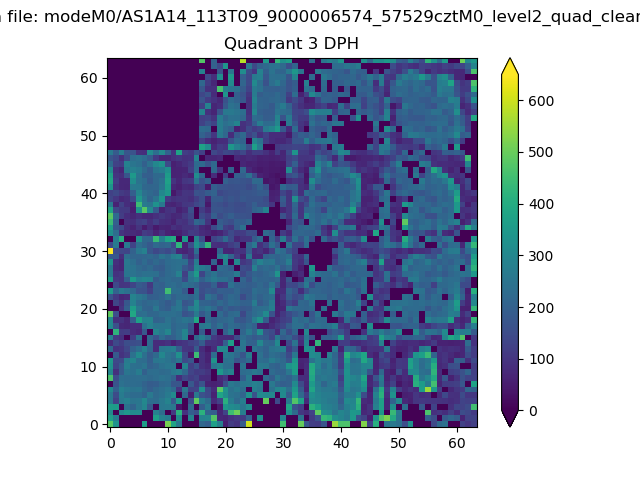 |
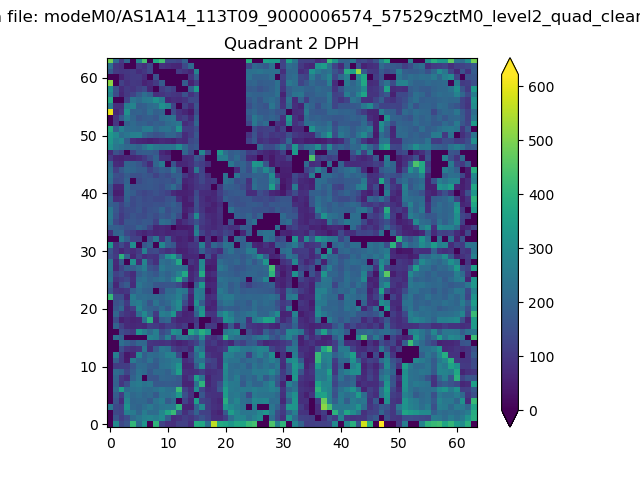 |
Quadrant C |
| Plot type | Count rate plots | Images |
|---|---|---|
| Comparison with Poisson distribution Blue bars denote a histogram of data divided into 1 sec bins. Red curve is a Poisson curve with rate = median count rate of data. |
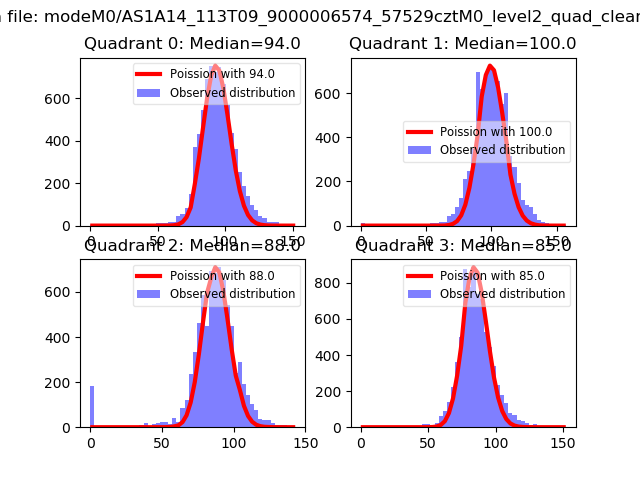 |
 |
| Quadrant-wise count rates Data is divided into 100 sec bins |
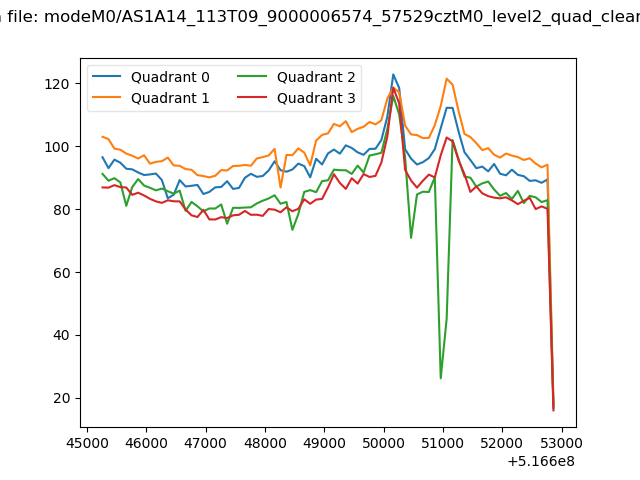 |
|
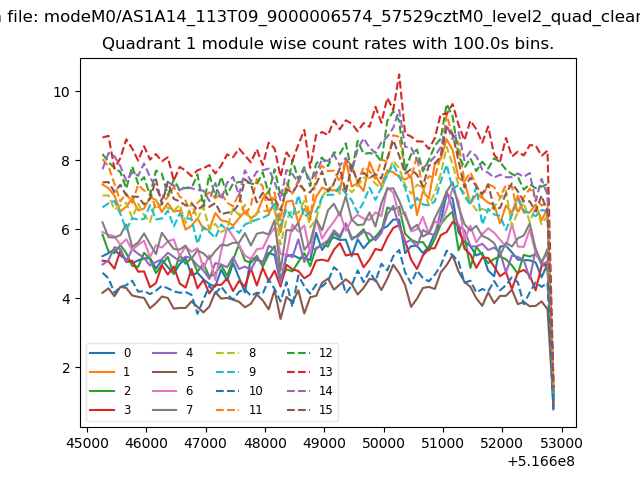
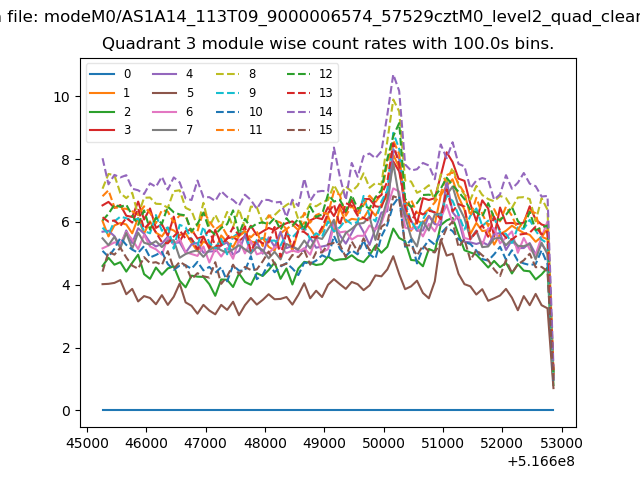
| Module-wise count rates for Quadrant A Data is divided into 100 sec bins |
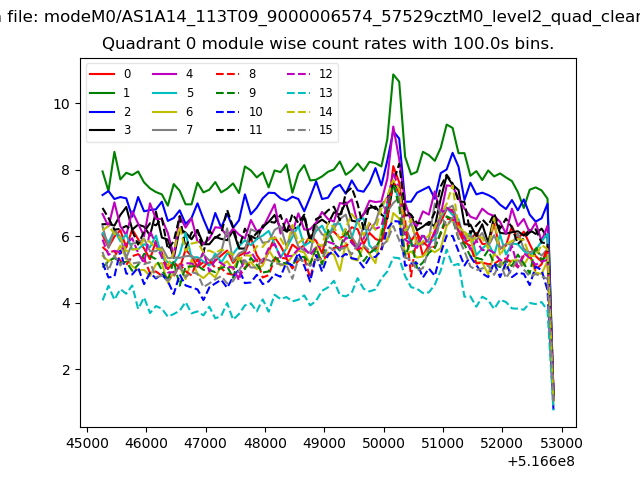 |
 |
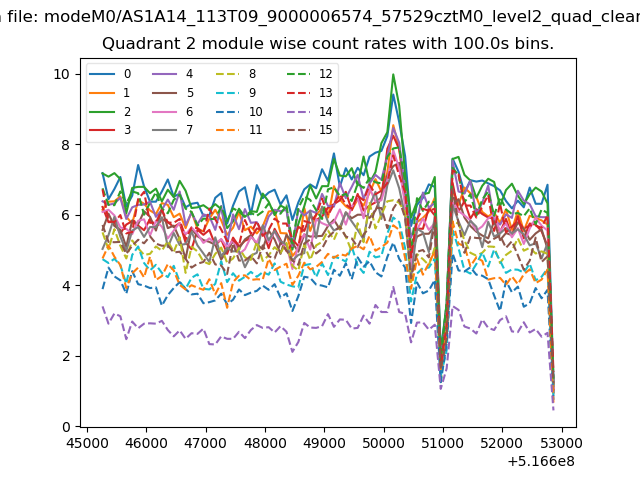
| Module-wise count rates for Quadrant B Data is divided into 100 sec bins |
 |
 |
| Module-wise count rates for Quadrant C Data is divided into 100 sec bins |
 |
 |
| Module-wise count rates for Quadrant D Data is divided into 100 sec bins |
 |
 |
| Parameter | Plot |
|---|---|
| CZT HV Monitor | 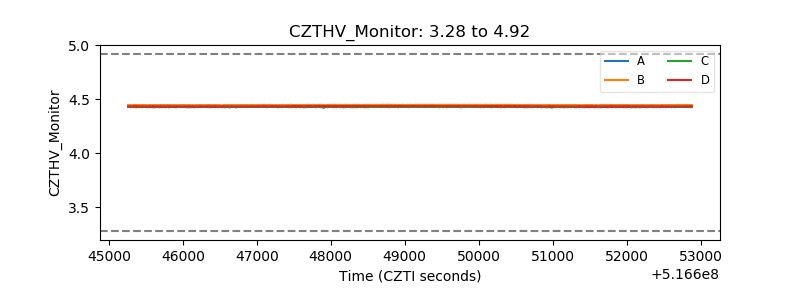 |
| D_VDD | 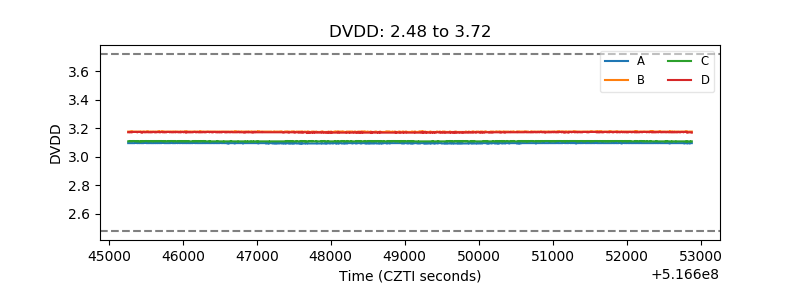 |
| Temperature 1 | 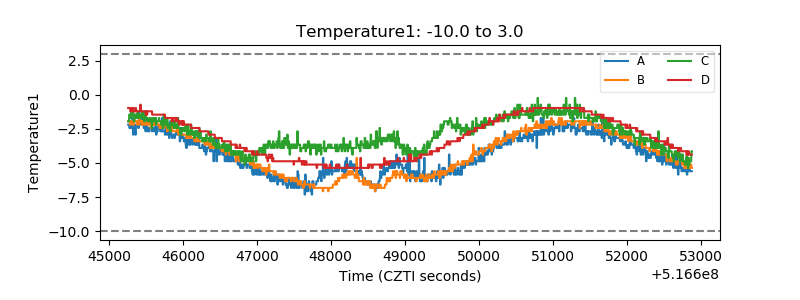 |
| Veto HV Monitor | 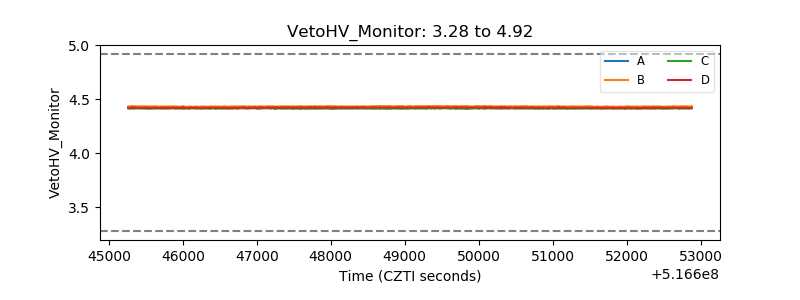 |
| Veto LLD | 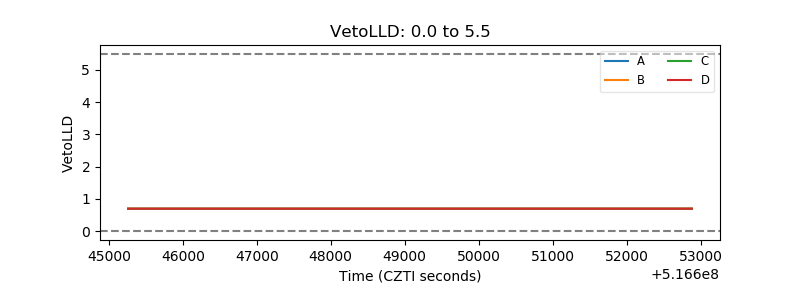 |
| Alpha Counter | 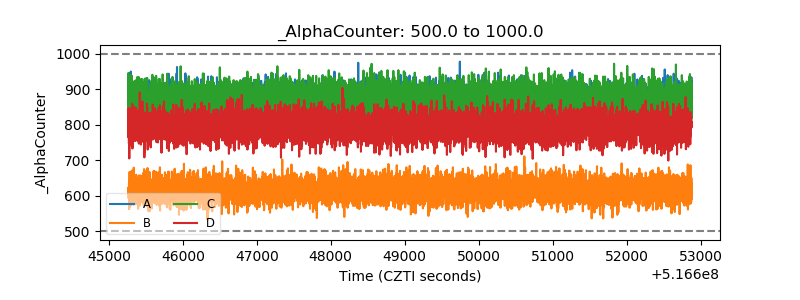 |
| _CPM_Rate | 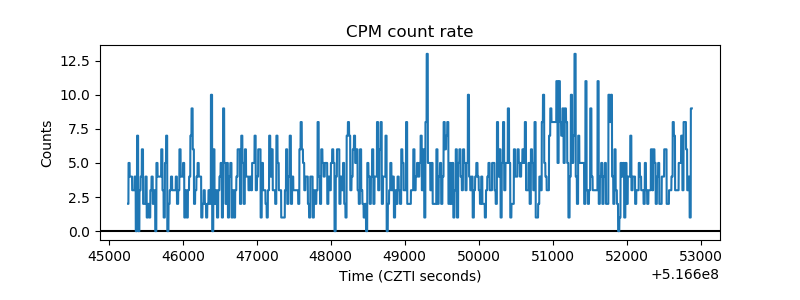 |
| CZT Counter | 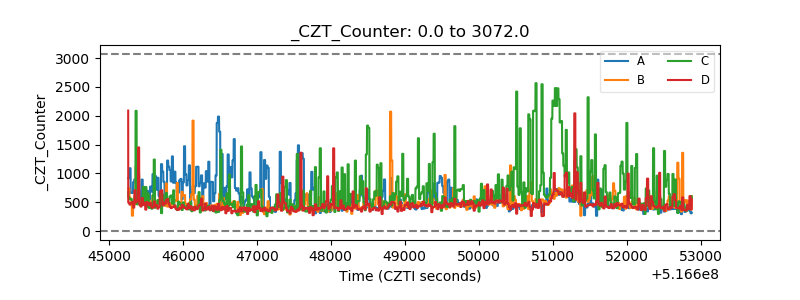 |
| +2.5 Volts monitor |  |
| +5 Volts monitor |  |
| _ROLL_ROT | 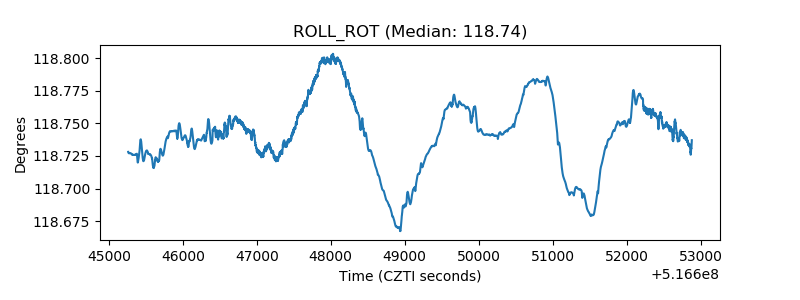 |
| _Roll_DEC | 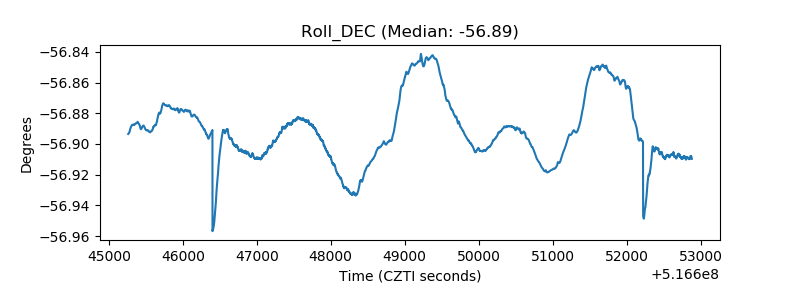 |
| _Roll_RA | 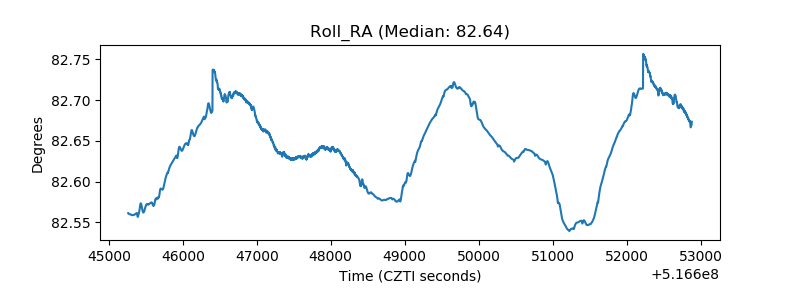 |
| Veto Counter | 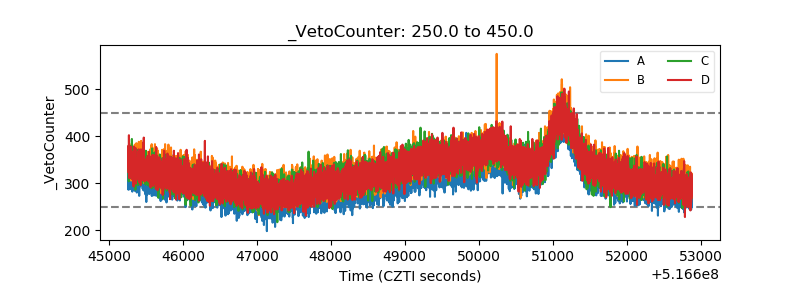 |