| Param | Original file | Final file |
|---|---|---|
| Filename | modeM0/AS1A14_113T09_9000006574_57530cztM0_level2.fits | modeM0/AS1A14_113T09_9000006574_57530cztM0_level2_quad_clean.evt |
| Size (bytes) | 484,534,080 | 100,981,440 |
| Size | 462.1 MB | 96.3 MB |
| Events in quadrant A | 3,376,521 | 640,557 |
| Events in quadrant B | 4,033,655 | 680,748 |
| Events in quadrant C | 5,682,309 | 614,958 |
| Events in quadrant D | 4,238,135 | 579,218 |
| Mode SS | |||
|---|---|---|---|
| Quadrant | BADHDUFLAG | Total packets | Discarded packets |
| A | 0 | 158 | 0 |
| B | 0 | 158 | 0 |
| C | 0 | 158 | 0 |
| D | 0 | 158 | 0 |
| Mode M9 | |||
|---|---|---|---|
| Quadrant | BADHDUFLAG | Total packets | Discarded packets |
| A | 0 | 1 | 0 |
| B | 0 | 1 | 0 |
| C | 0 | 1 | 0 |
| D | 0 | 1 | 0 |
| Mode M0 | |||
|---|---|---|---|
| Quadrant | BADHDUFLAG | Total packets | Discarded packets |
| A | 0 | 16039 | 1 |
| B | 0 | 17406 | 1 |
| C | 0 | 22417 | 1 |
| D | 0 | 18244 | 1 |
| Quadrant | Total seconds | Saturated seconds | Saturation percentage |
|---|---|---|---|
| A | 7790 | 20 | 0.256739% |
| B | 7790 | 92 | 1.181001% |
| C | 7790 | 290 | 3.722721% |
| D | 7790 | 137 | 1.758665% |
Noise dominated data is calculated using 1-second bins in cleaned event files. If a bin has >2000 counts, and if more than 50% of those come from <1% of pixels, then it is considered to be noise-dominated and hence unusable.
| Quadrant | # 1 sec bins | Bins with >0 counts | Bins with >2000 counts | High rate bins dominated by noise | Noise dominated (total time) | Noise dominated (detector-on time) | Marked lightcurve |
|---|---|---|---|---|---|---|---|
| A | 8200 | 8066 | 1 | 1 | 0.01% | 0.01% | 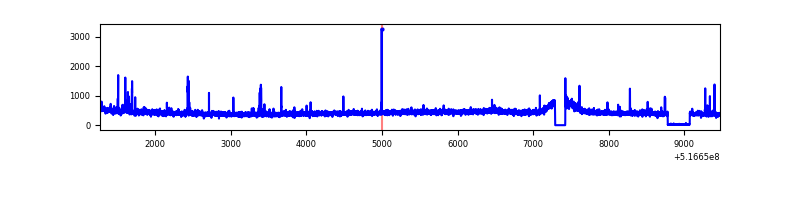 |
| B | 8200 | 8066 | 23 | 23 | 0.28% | 0.29% | 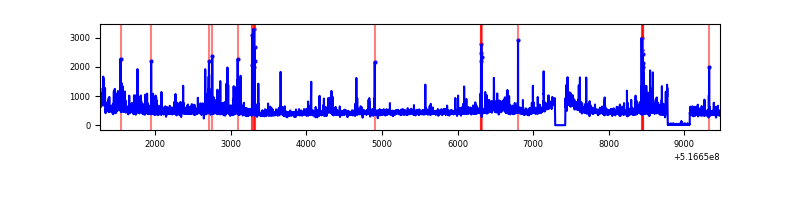 |
| C | 8200 | 8066 | 247 | 247 | 3.01% | 3.06% | 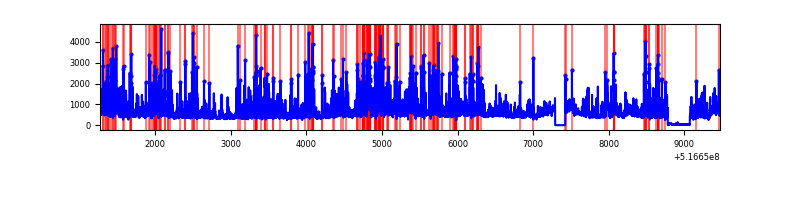 |
| D | 8200 | 8066 | 120 | 120 | 1.46% | 1.49% | 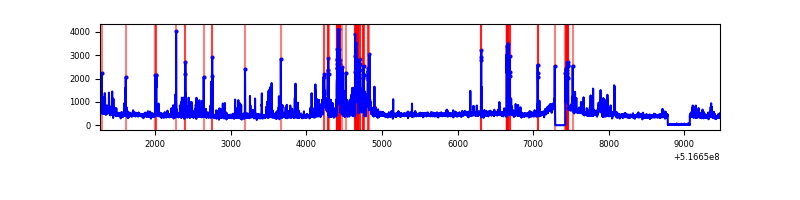 |
Top three noisy pixels from each quadrant. If the there are fewer than three noisy pixels in the level2.evt file, extra rows are filled as -1
| Pixel properties | Quadrant properties | ||||||
|---|---|---|---|---|---|---|---|
| Quadrant | DetID | PixID | Counts | Sigma | Mean | Median | Sigma |
| A | 3 | 245 | 34380 | 163.01 | 837 | 817 | 205.9 |
| A | 10 | 251 | 33538 | 158.92 | 837 | 817 | 205.9 |
| A | 13 | 248 | 25441 | 119.6 | 837 | 817 | 205.9 |
| B | 4 | 206 | 253746 | 1426.07 | 823 | 791 | 177.4 |
| B | 5 | 185 | 162089 | 909.34 | 823 | 791 | 177.4 |
| B | 7 | 252 | 68561 | 382.06 | 823 | 791 | 177.4 |
| C | 15 | 224 | 2052051 | 9491.98 | 791 | 783 | 216.1 |
| C | 12 | 252 | 343356 | 1585.21 | 791 | 783 | 216.1 |
| C | 14 | 254 | 66607 | 304.59 | 791 | 783 | 216.1 |
| D | 8 | 240 | 503009 | 2228.83 | 798 | 761 | 225.3 |
| D | 3 | 12 | 153169 | 676.34 | 798 | 761 | 225.3 |
| D | 8 | 160 | 115122 | 507.5 | 798 | 761 | 225.3 |
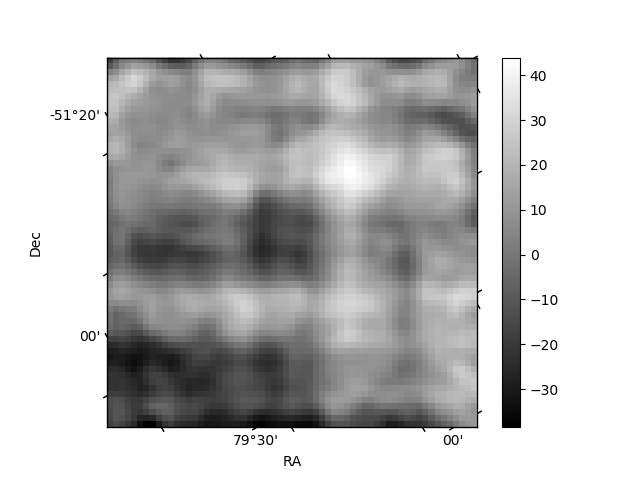
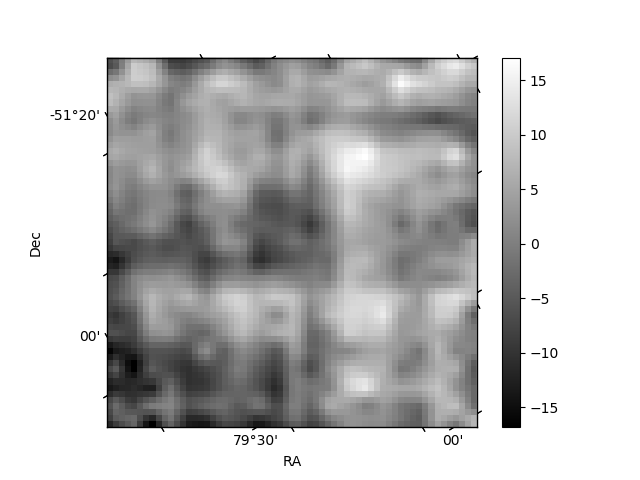
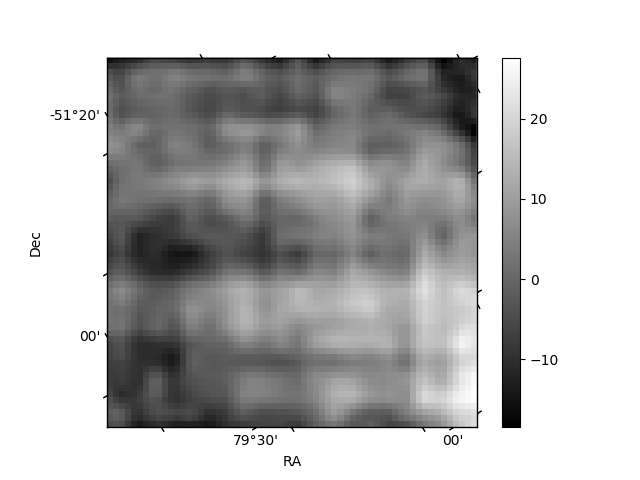
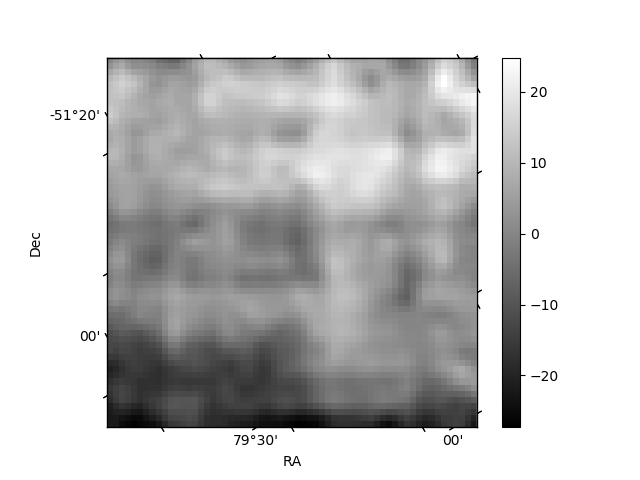
Histogram calculated using DETX and DETY for each event in the final _common_clean file
| Quadrant A | 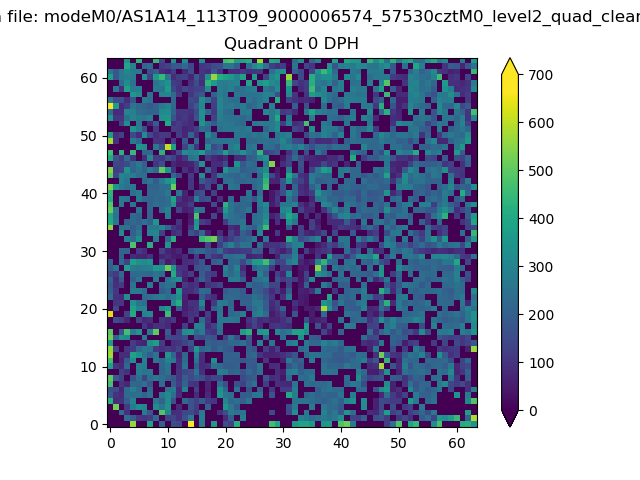 |
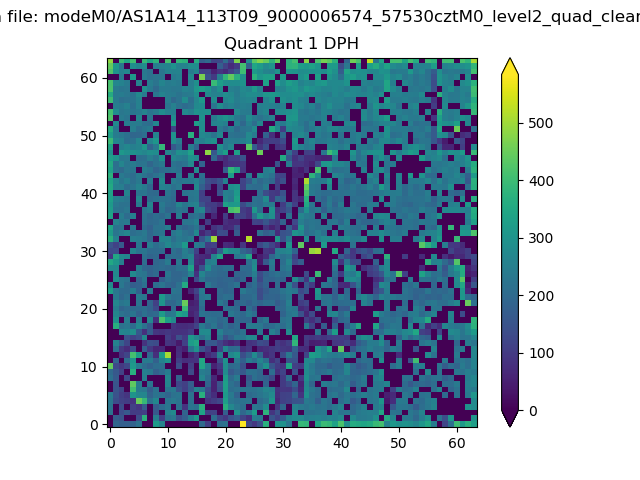 |
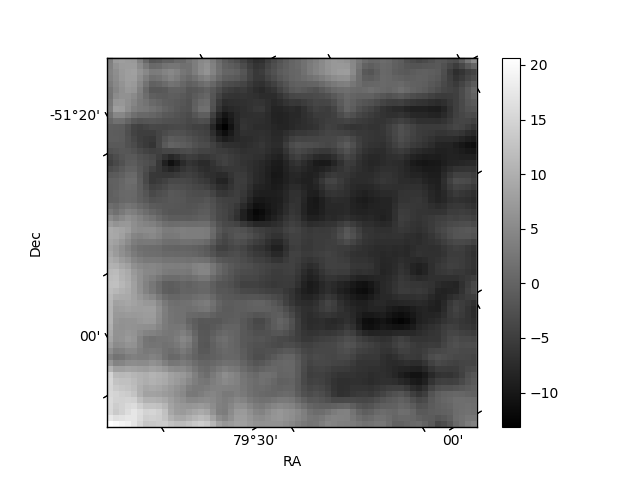
Quadrant B |
|---|---|---|---|
| Quadrant D | 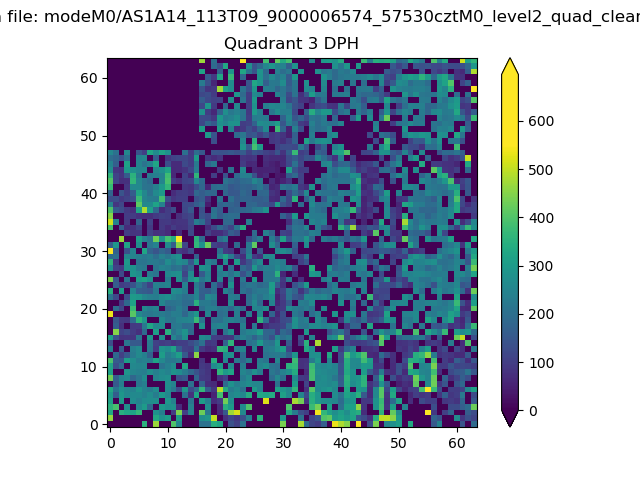 |
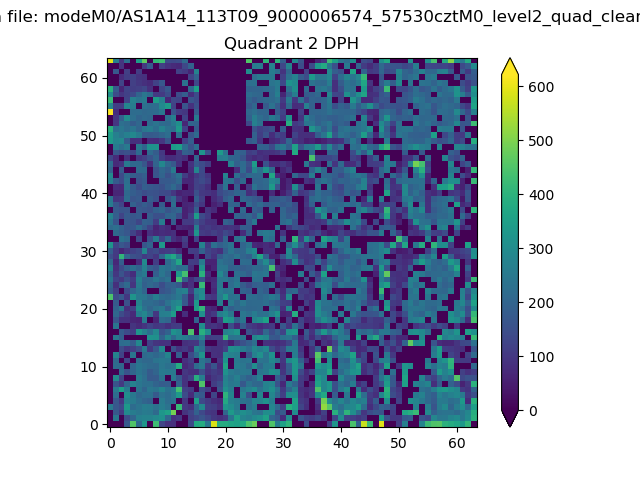 |
Quadrant C |
| Plot type | Count rate plots | Images |
|---|---|---|
| Comparison with Poisson distribution Blue bars denote a histogram of data divided into 1 sec bins. Red curve is a Poisson curve with rate = median count rate of data. |
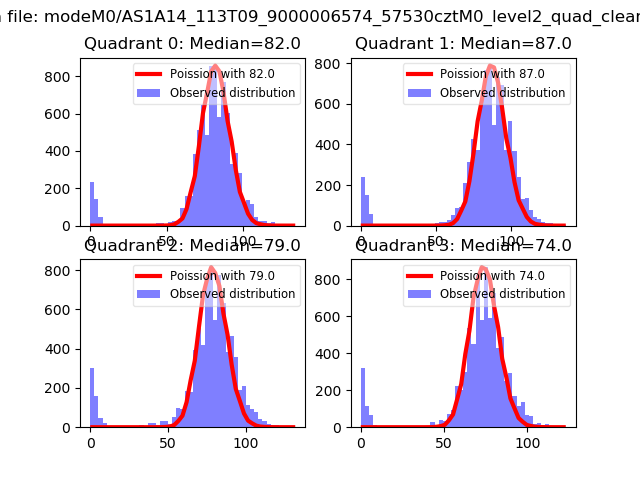 |
 |
| Quadrant-wise count rates Data is divided into 100 sec bins |
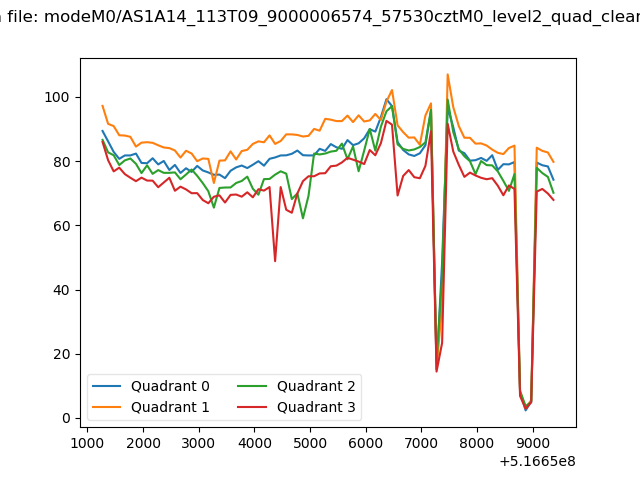 |
|
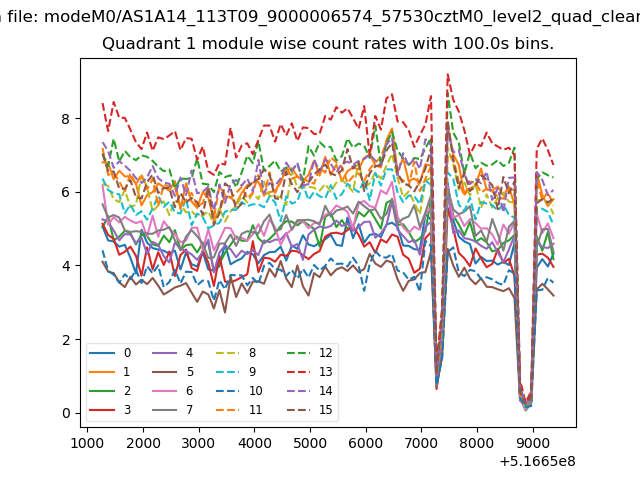
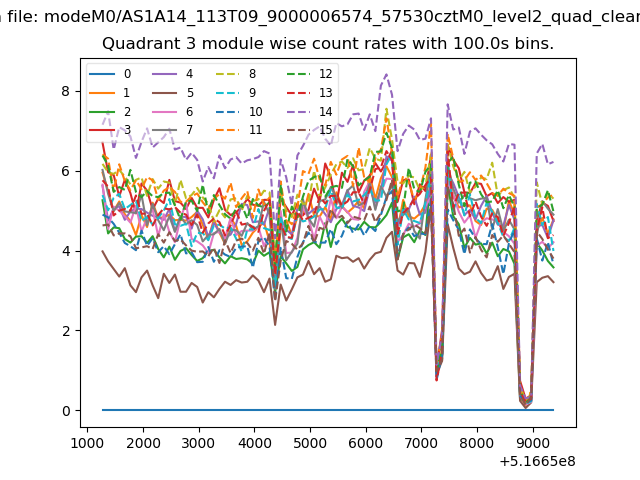
| Module-wise count rates for Quadrant A Data is divided into 100 sec bins |
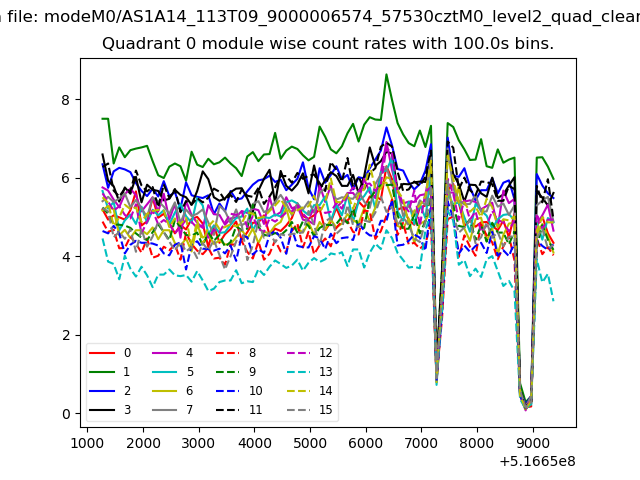 |
 |
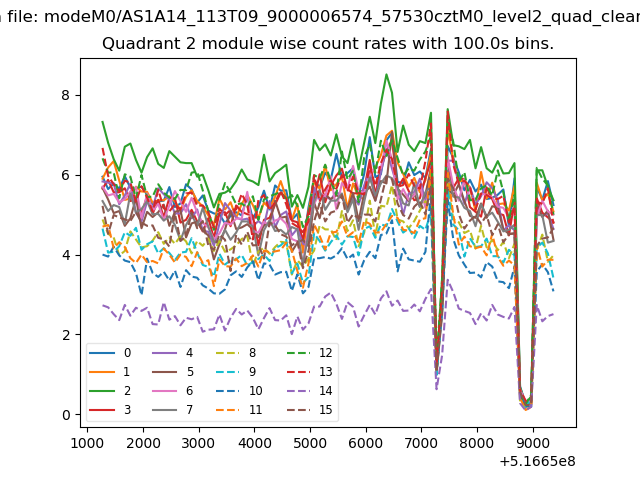
| Module-wise count rates for Quadrant B Data is divided into 100 sec bins |
 |
 |
| Module-wise count rates for Quadrant C Data is divided into 100 sec bins |
 |
 |
| Module-wise count rates for Quadrant D Data is divided into 100 sec bins |
 |
 |
| Parameter | Plot |
|---|---|
| CZT HV Monitor | 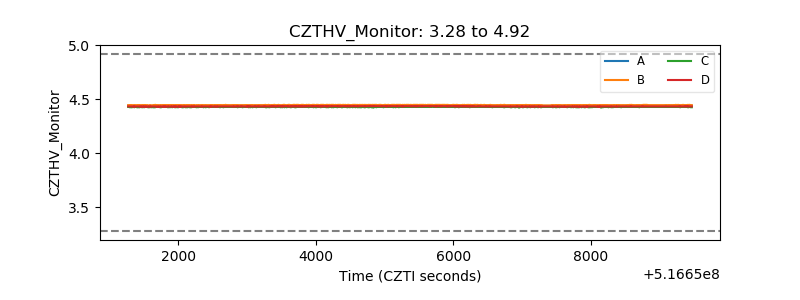 |
| D_VDD | 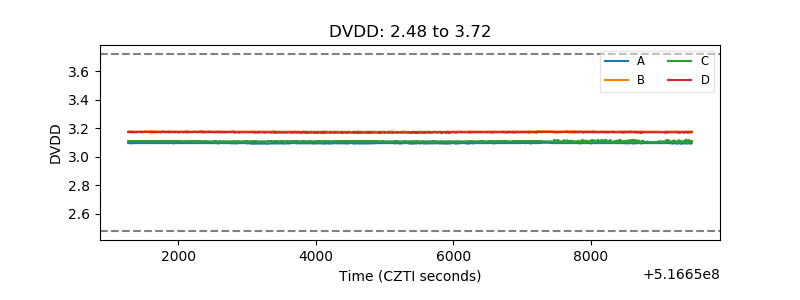 |
| Temperature 1 | 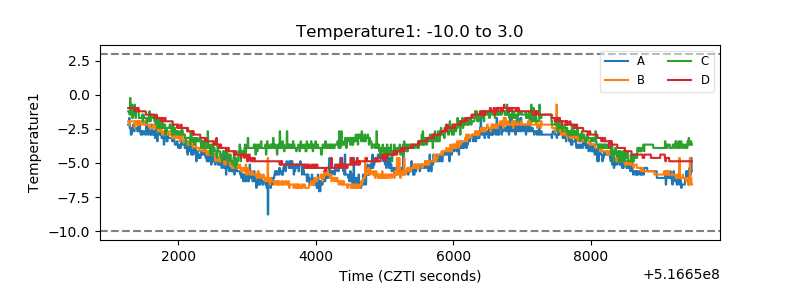 |
| Veto HV Monitor | 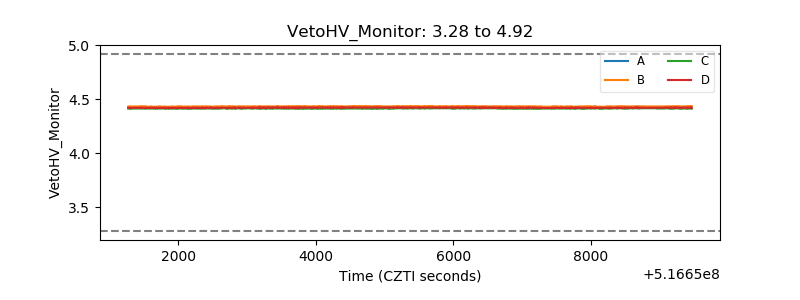 |
| Veto LLD | 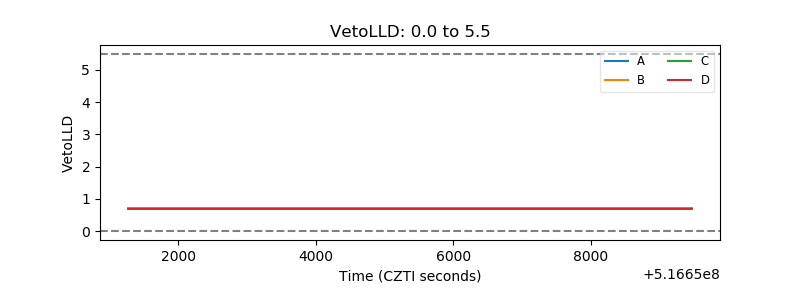 |
| Alpha Counter | 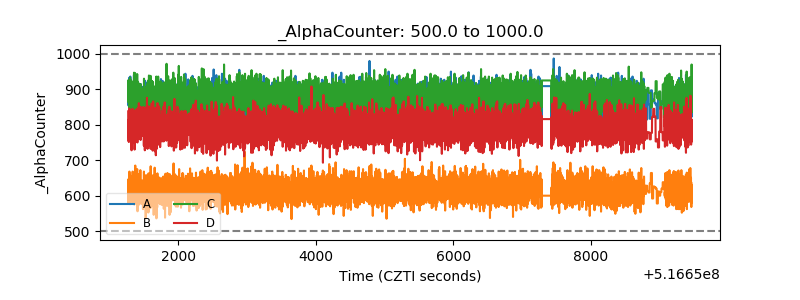 |
| _CPM_Rate | 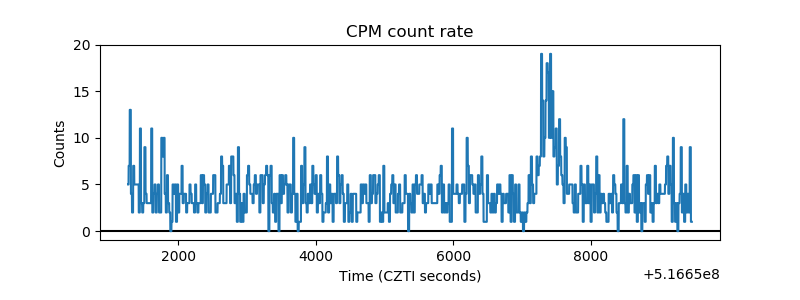 |
| CZT Counter | 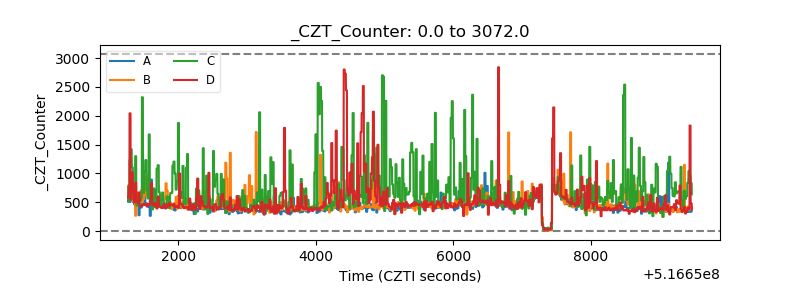 |
| +2.5 Volts monitor |  |
| +5 Volts monitor |  |
| _ROLL_ROT | 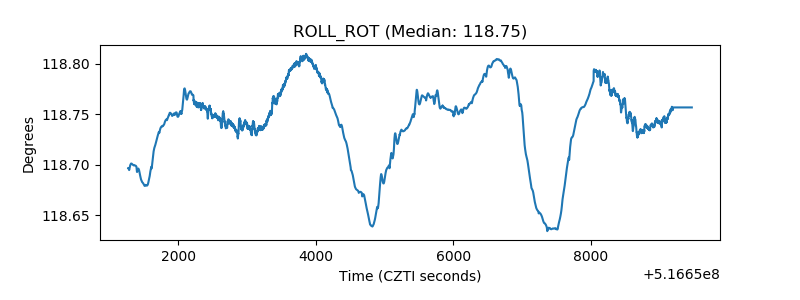 |
| _Roll_DEC | 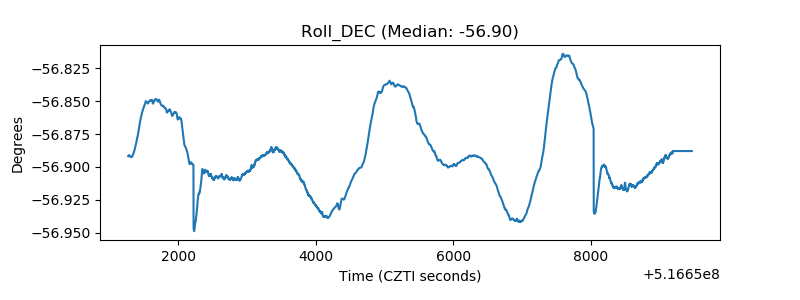 |
| _Roll_RA | 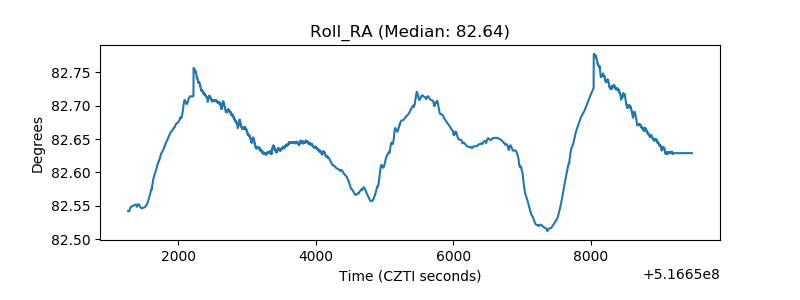 |
| Veto Counter | 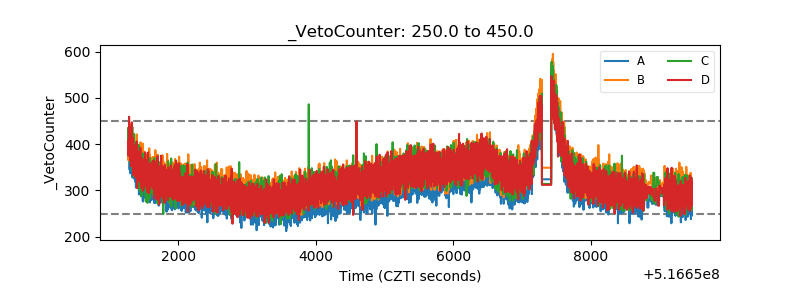 |