| Param | Original file | Final file |
|---|---|---|
| Filename | modeM0/AS1A14_113T09_9000006574_57534cztM0_level2.fits | modeM0/AS1A14_113T09_9000006574_57534cztM0_level2_quad_clean.evt |
| Size (bytes) | 1,396,929,600 | 323,691,840 |
| Size | 1.3 GB | 308.7 MB |
| Events in quadrant A | 9,968,531 | 2,130,322 |
| Events in quadrant B | 10,905,729 | 2,257,791 |
| Events in quadrant C | 16,100,854 | 1,947,692 |
| Events in quadrant D | 12,965,224 | 1,891,640 |
| Mode SS | |||
|---|---|---|---|
| Quadrant | BADHDUFLAG | Total packets | Discarded packets |
| A | 0 | 464 | 0 |
| B | 0 | 464 | 0 |
| C | 0 | 464 | 0 |
| D | 0 | 464 | 0 |
| Mode M9 | |||
|---|---|---|---|
| Quadrant | BADHDUFLAG | Total packets | Discarded packets |
| A | 0 | 26 | 0 |
| B | 0 | 26 | 0 |
| C | 0 | 26 | 0 |
| D | 0 | 26 | 0 |
| Mode M0 | |||
|---|---|---|---|
| Quadrant | BADHDUFLAG | Total packets | Discarded packets |
| A | 0 | 47201 | 4 |
| B | 0 | 48726 | 4 |
| C | 0 | 64058 | 4 |
| D | 0 | 54849 | 4 |
| Quadrant | Total seconds | Saturated seconds | Saturation percentage |
|---|---|---|---|
| A | 22858 | 122 | 0.533730% |
| B | 22858 | 312 | 1.364949% |
| C | 22858 | 1115 | 4.877942% |
| D | 22858 | 452 | 1.977426% |
Noise dominated data is calculated using 1-second bins in cleaned event files. If a bin has >2000 counts, and if more than 50% of those come from <1% of pixels, then it is considered to be noise-dominated and hence unusable.
| Quadrant | # 1 sec bins | Bins with >0 counts | Bins with >2000 counts | High rate bins dominated by noise | Noise dominated (total time) | Noise dominated (detector-on time) | Marked lightcurve |
|---|---|---|---|---|---|---|---|
| A | 25738 | 23136 | 20 | 20 | 0.08% | 0.09% | 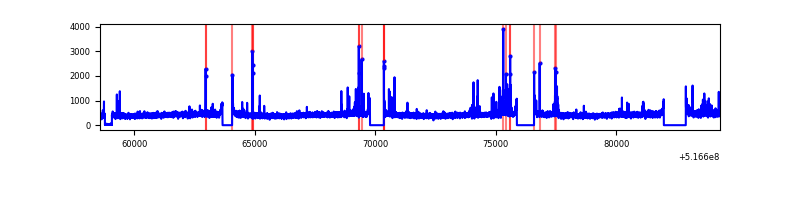 |
| B | 25738 | 23135 | 82 | 82 | 0.32% | 0.35% | 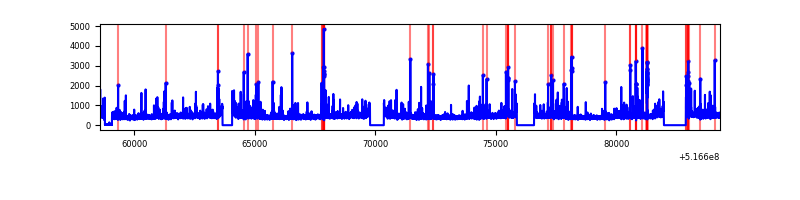 |
| C | 25738 | 23136 | 846 | 846 | 3.29% | 3.66% | 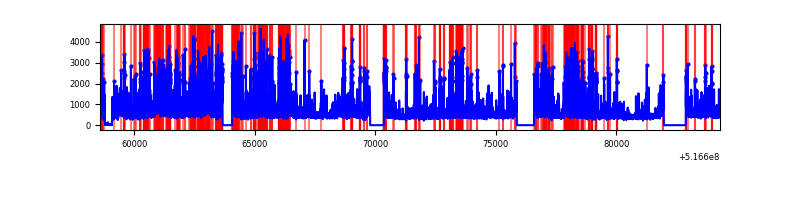 |
| D | 25738 | 23136 | 338 | 338 | 1.31% | 1.46% | 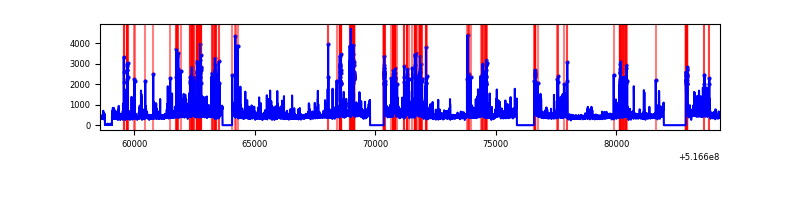 |
Top three noisy pixels from each quadrant. If the there are fewer than three noisy pixels in the level2.evt file, extra rows are filled as -1
| Pixel properties | Quadrant properties | ||||||
|---|---|---|---|---|---|---|---|
| Quadrant | DetID | PixID | Counts | Sigma | Mean | Median | Sigma |
| A | 3 | 14 | 234209 | 387.7 | 2446 | 2385 | 597.9 |
| A | 13 | 248 | 55516 | 88.86 | 2446 | 2385 | 597.9 |
| A | 10 | 251 | 49159 | 78.23 | 2446 | 2385 | 597.9 |
| B | 5 | 185 | 223452 | 431.09 | 2408 | 2311 | 513.0 |
| B | 7 | 252 | 212889 | 410.49 | 2408 | 2311 | 513.0 |
| B | 4 | 206 | 208760 | 402.45 | 2408 | 2311 | 513.0 |
| C | 15 | 224 | 5227876 | 8199.15 | 2340 | 2311 | 637.3 |
| C | 12 | 252 | 1061667 | 1662.18 | 2340 | 2311 | 637.3 |
| C | 9 | 38 | 169562 | 262.42 | 2340 | 2311 | 637.3 |
| D | 15 | 94 | 658578 | 982.27 | 2358 | 2246 | 668.2 |
| D | 8 | 160 | 593373 | 884.69 | 2358 | 2246 | 668.2 |
| D | 15 | 142 | 579082 | 863.3 | 2358 | 2246 | 668.2 |
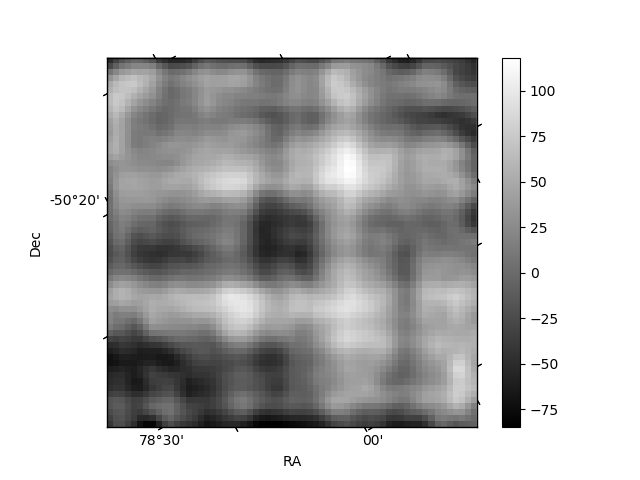
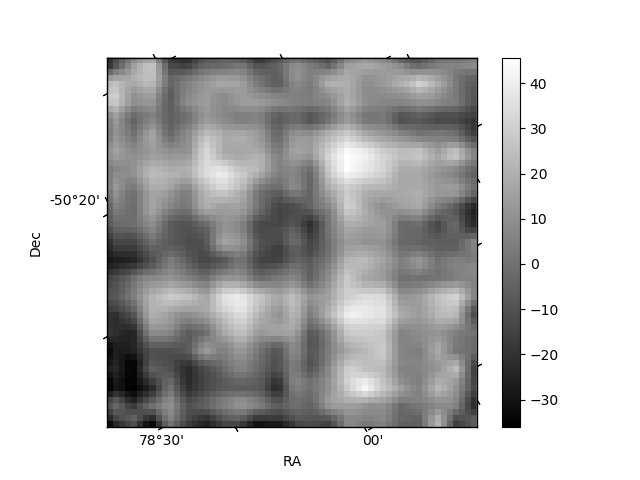
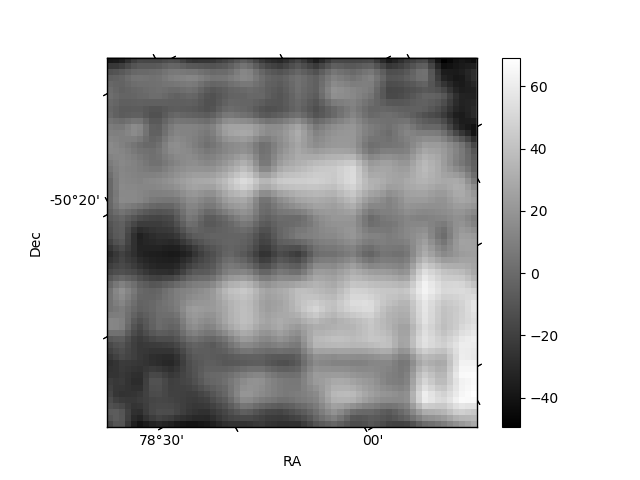
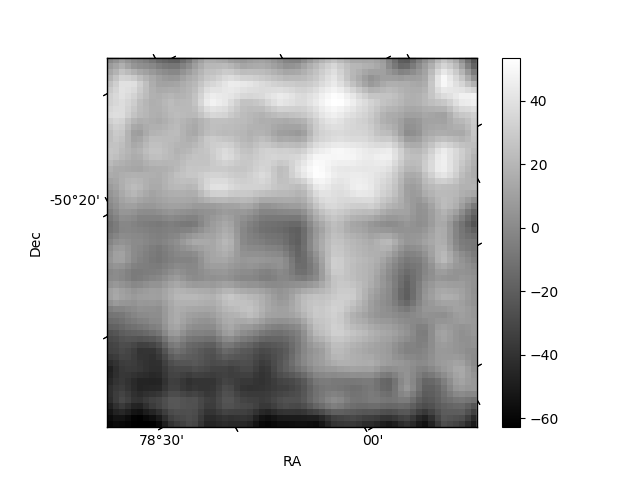
Histogram calculated using DETX and DETY for each event in the final _common_clean file
| Quadrant A | 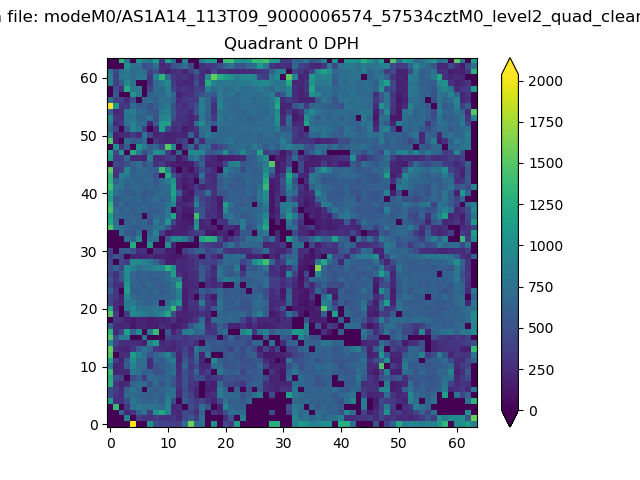 |
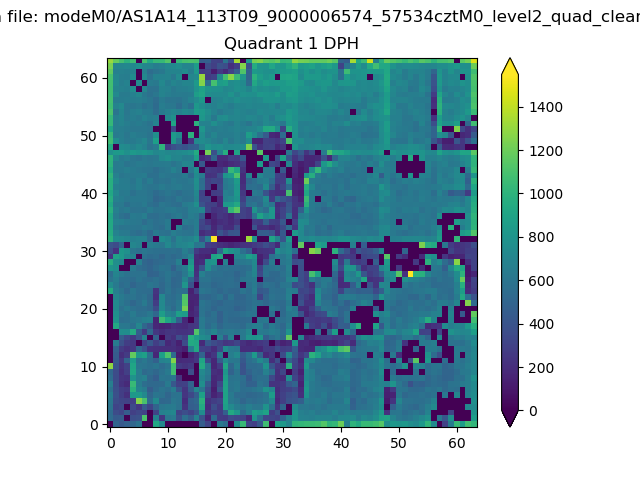 |
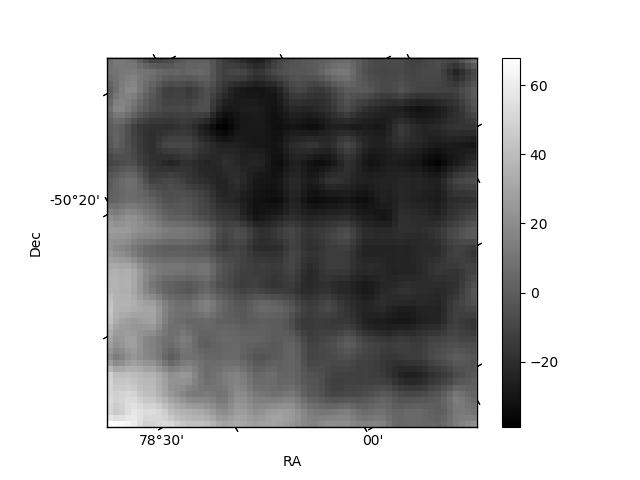
Quadrant B |
|---|---|---|---|
| Quadrant D | 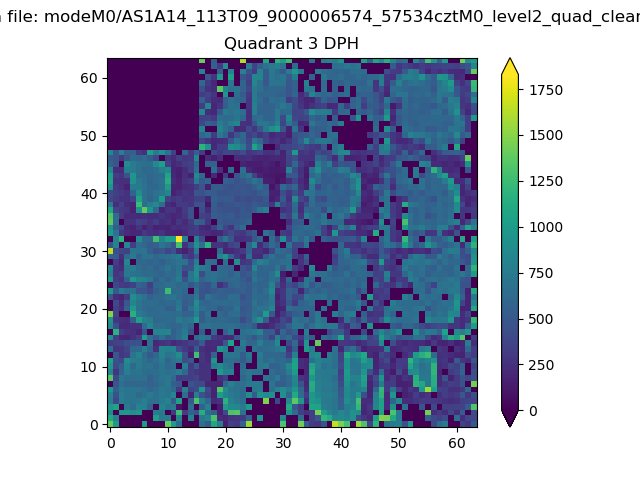 |
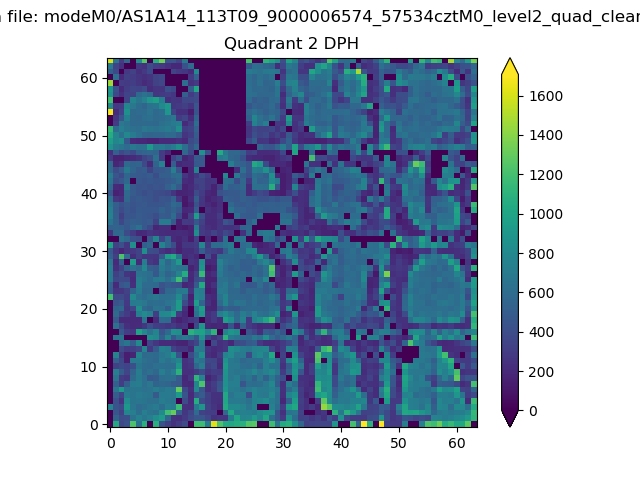 |
Quadrant C |
| Plot type | Count rate plots | Images |
|---|---|---|
| Comparison with Poisson distribution Blue bars denote a histogram of data divided into 1 sec bins. Red curve is a Poisson curve with rate = median count rate of data. |
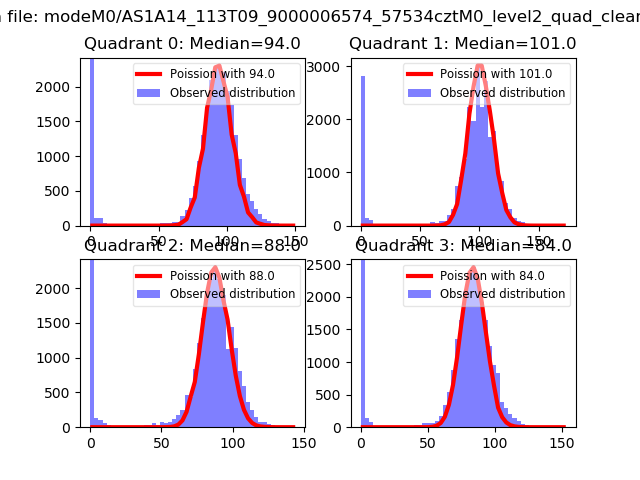 |
 |
| Quadrant-wise count rates Data is divided into 100 sec bins |
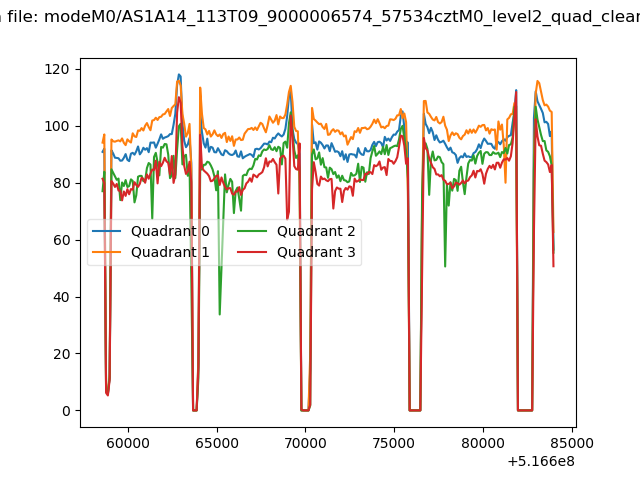 |
|
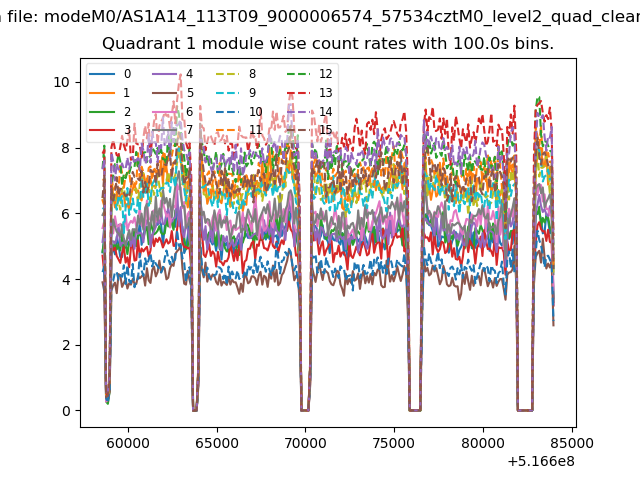
| Module-wise count rates for Quadrant A Data is divided into 100 sec bins |
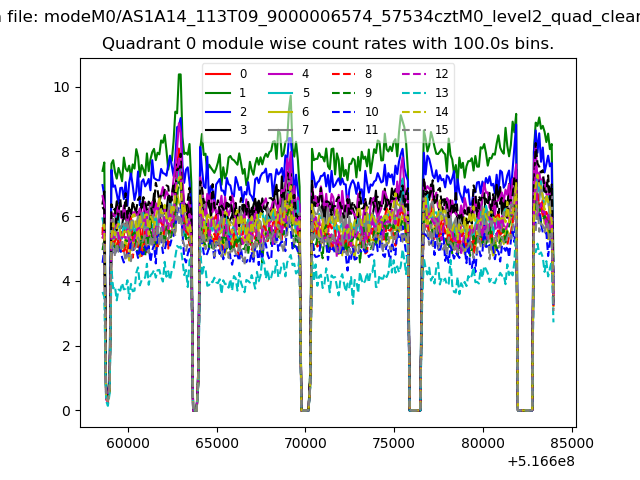 |
 |
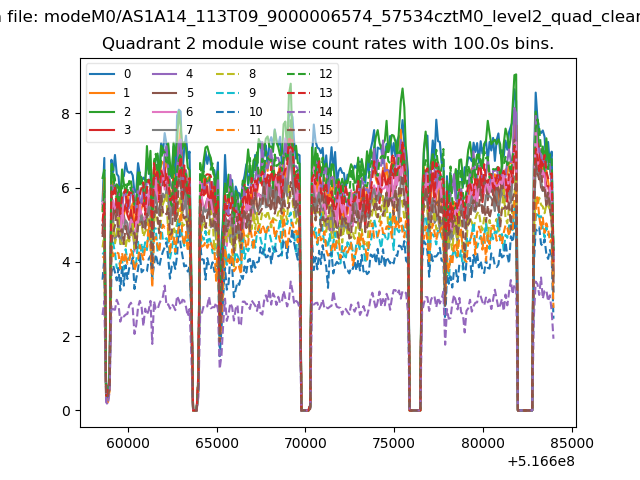
| Module-wise count rates for Quadrant B Data is divided into 100 sec bins |
 |
 |
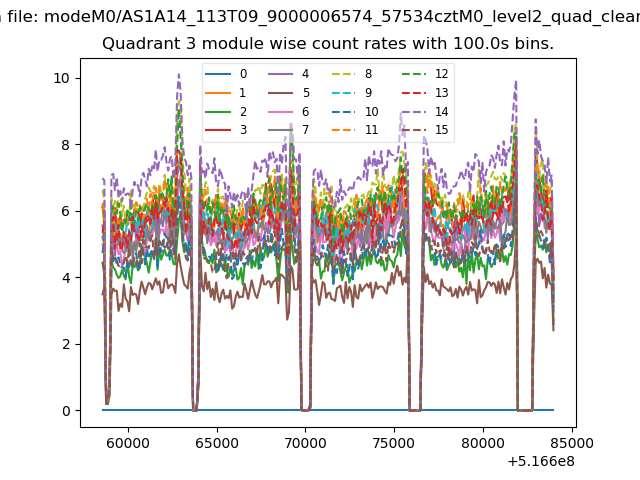
| Module-wise count rates for Quadrant C Data is divided into 100 sec bins |
 |
 |
| Module-wise count rates for Quadrant D Data is divided into 100 sec bins |
 |
 |
| Parameter | Plot |
|---|---|
| CZT HV Monitor | 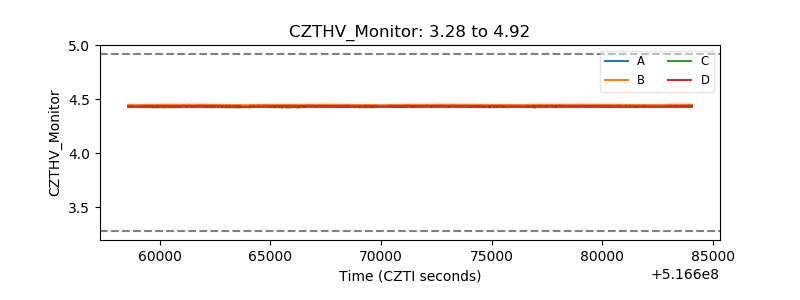 |
| D_VDD | 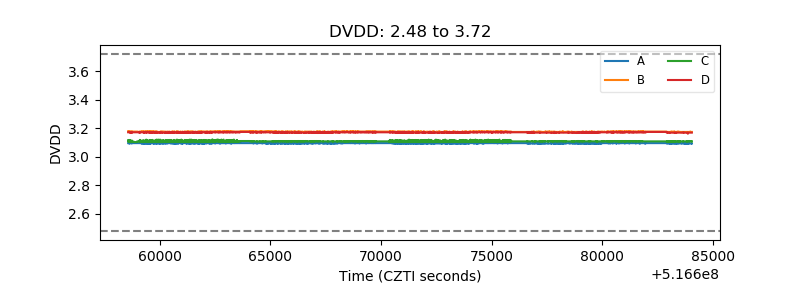 |
| Temperature 1 | 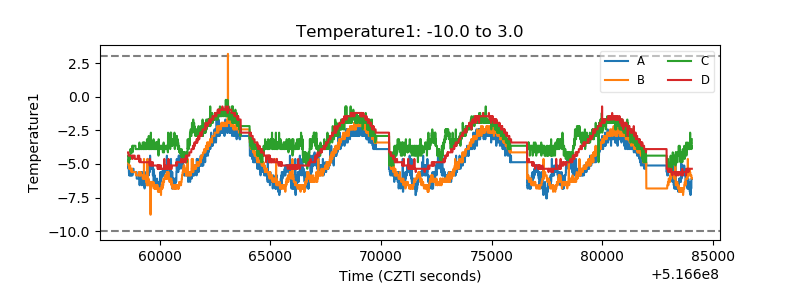 |
| Veto HV Monitor | 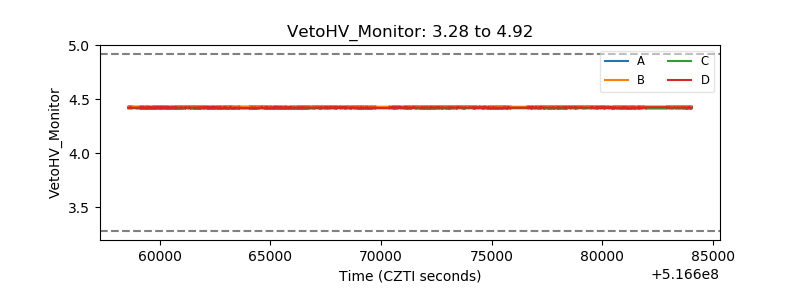 |
| Veto LLD | 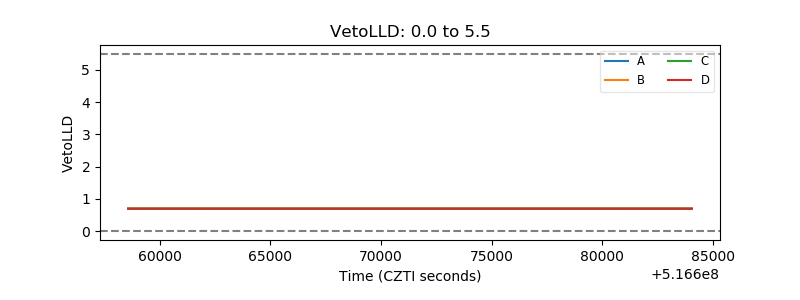 |
| Alpha Counter | 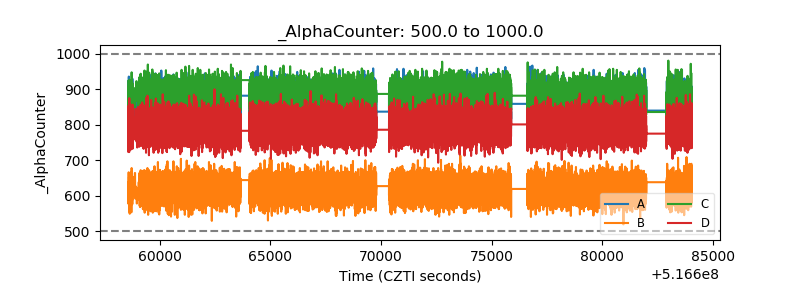 |
| _CPM_Rate | 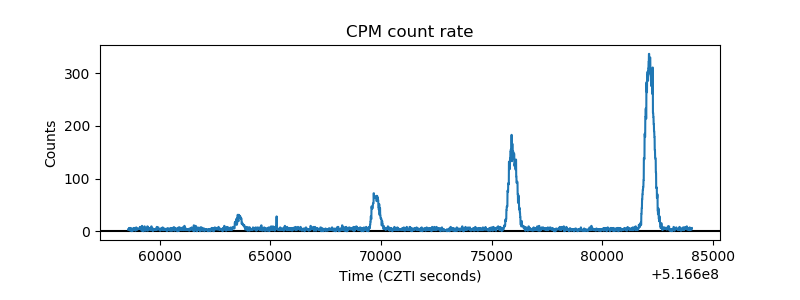 |
| CZT Counter | 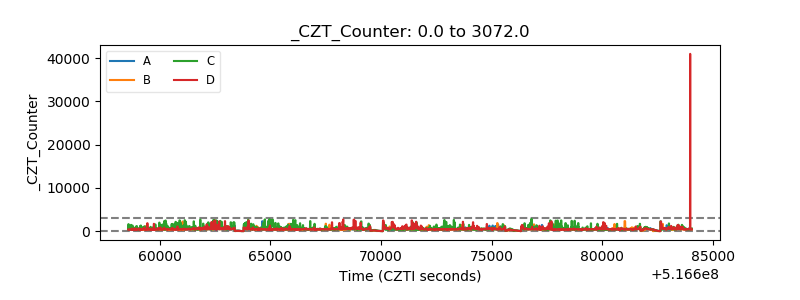 |
| +2.5 Volts monitor | 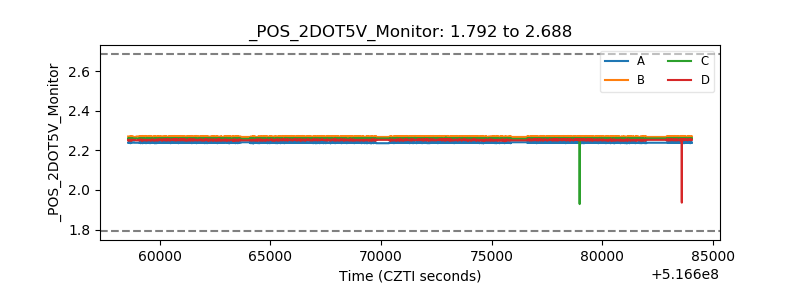 |
| +5 Volts monitor |  |
| _ROLL_ROT | 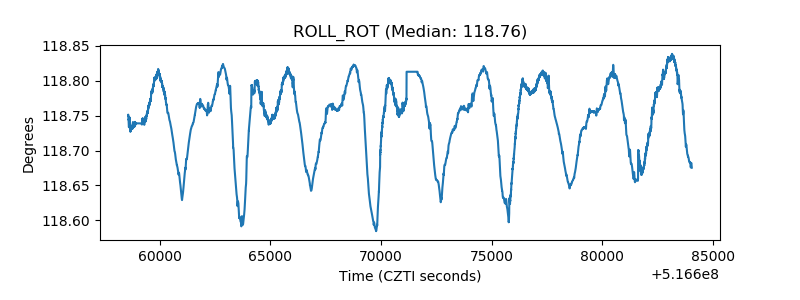 |
| _Roll_DEC | 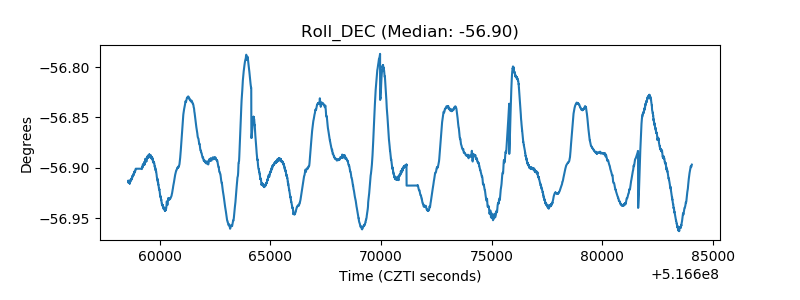 |
| _Roll_RA | 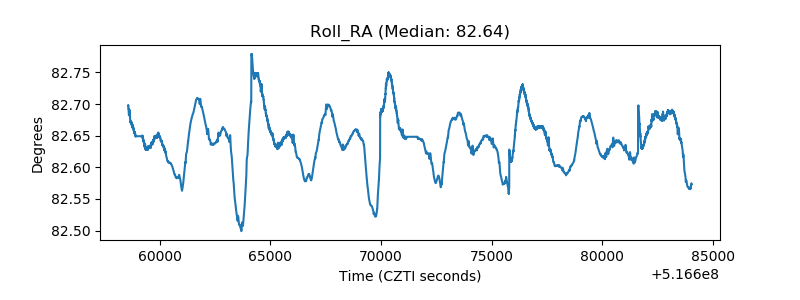 |
| Veto Counter | 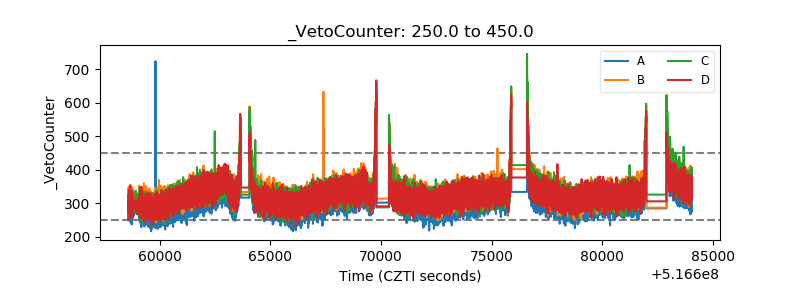 |