| Param | Original file | Final file |
|---|---|---|
| Filename | modeM0/AS1A14_113T09_9000006574_57536cztM0_level2.fits | modeM0/AS1A14_113T09_9000006574_57536cztM0_level2_quad_clean.evt |
| Size (bytes) | 424,578,240 | 105,079,680 |
| Size | 404.9 MB | 100.2 MB |
| Events in quadrant A | 3,467,776 | 690,300 |
| Events in quadrant B | 3,558,682 | 733,567 |
| Events in quadrant C | 4,030,727 | 651,899 |
| Events in quadrant D | 4,109,631 | 613,908 |
| Mode SS | |||
|---|---|---|---|
| Quadrant | BADHDUFLAG | Total packets | Discarded packets |
| A | 0 | 146 | 0 |
| B | 0 | 146 | 0 |
| C | 0 | 146 | 0 |
| D | 0 | 146 | 0 |
| Mode M9 | |||
|---|---|---|---|
| Quadrant | BADHDUFLAG | Total packets | Discarded packets |
| A | 0 | 19 | 0 |
| B | 0 | 19 | 0 |
| C | 0 | 19 | 0 |
| D | 0 | 19 | 0 |
| Mode M0 | |||
|---|---|---|---|
| Quadrant | BADHDUFLAG | Total packets | Discarded packets |
| A | 0 | 15267 | 2 |
| B | 0 | 15458 | 2 |
| C | 0 | 16903 | 2 |
| D | 0 | 17185 | 2 |
| Quadrant | Total seconds | Saturated seconds | Saturation percentage |
|---|---|---|---|
| A | 7065 | 101 | 1.429582% |
| B | 7065 | 169 | 2.392074% |
| C | 7066 | 163 | 2.306821% |
| D | 7066 | 206 | 2.915369% |
Noise dominated data is calculated using 1-second bins in cleaned event files. If a bin has >2000 counts, and if more than 50% of those come from <1% of pixels, then it is considered to be noise-dominated and hence unusable.
| Quadrant | # 1 sec bins | Bins with >0 counts | Bins with >2000 counts | High rate bins dominated by noise | Noise dominated (total time) | Noise dominated (detector-on time) | Marked lightcurve |
|---|---|---|---|---|---|---|---|
| A | 8990 | 7066 | 24 | 24 | 0.27% | 0.34% | 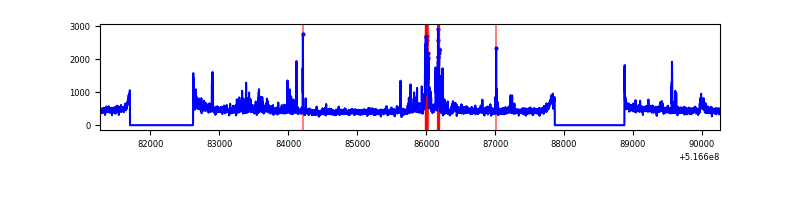 |
| B | 8990 | 7066 | 32 | 32 | 0.36% | 0.45% | 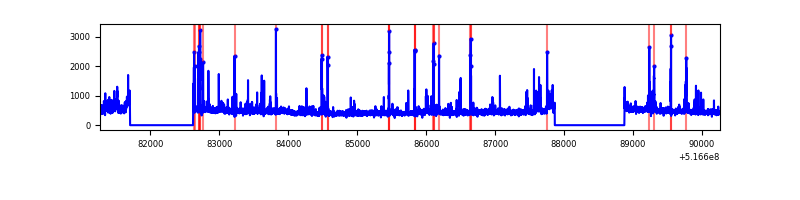 |
| C | 8991 | 7067 | 62 | 62 | 0.69% | 0.88% | 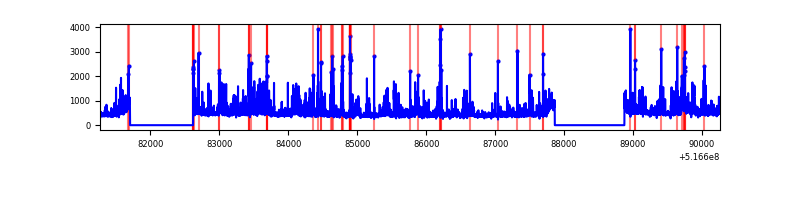 |
| D | 8991 | 7067 | 136 | 136 | 1.51% | 1.92% | 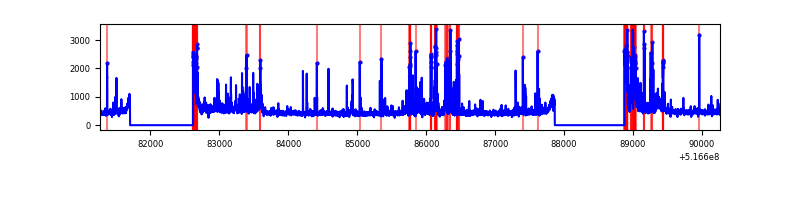 |
Top three noisy pixels from each quadrant. If the there are fewer than three noisy pixels in the level2.evt file, extra rows are filled as -1
| Pixel properties | Quadrant properties | ||||||
|---|---|---|---|---|---|---|---|
| Quadrant | DetID | PixID | Counts | Sigma | Mean | Median | Sigma |
| A | 3 | 14 | 302202 | 1562.64 | 781 | 760 | 192.9 |
| A | 4 | 249 | 95780 | 492.57 | 781 | 760 | 192.9 |
| A | 4 | 95 | 40646 | 206.76 | 781 | 760 | 192.9 |
| B | 5 | 185 | 102884 | 621.38 | 768 | 740 | 164.4 |
| B | 4 | 67 | 90929 | 548.66 | 768 | 740 | 164.4 |
| B | 10 | 247 | 67500 | 406.13 | 768 | 740 | 164.4 |
| C | 15 | 224 | 809379 | 3875.7 | 762 | 754 | 208.6 |
| C | 14 | 96 | 80852 | 383.9 | 762 | 754 | 208.6 |
| C | 6 | 223 | 52825 | 249.57 | 762 | 754 | 208.6 |
| D | 15 | 142 | 406506 | 1893.83 | 757 | 723 | 214.3 |
| D | 2 | 31 | 211080 | 981.76 | 757 | 723 | 214.3 |
| D | 8 | 160 | 132097 | 613.14 | 757 | 723 | 214.3 |
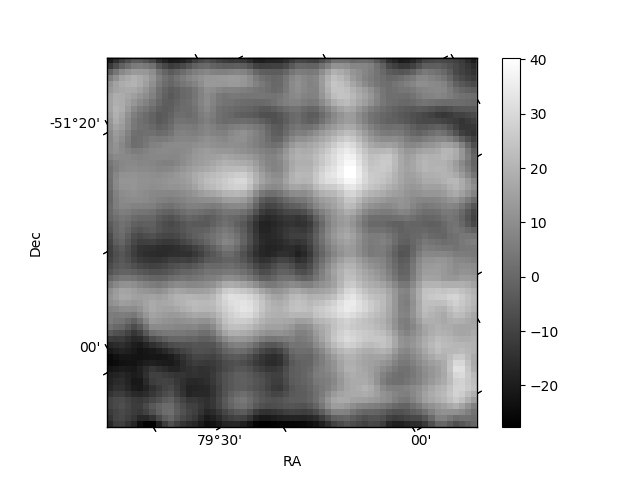
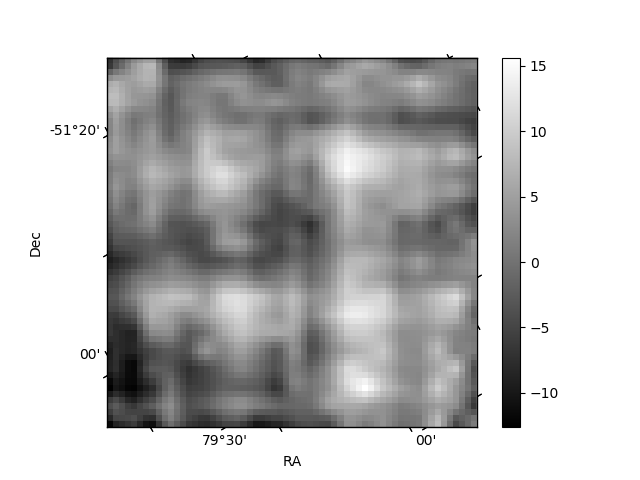
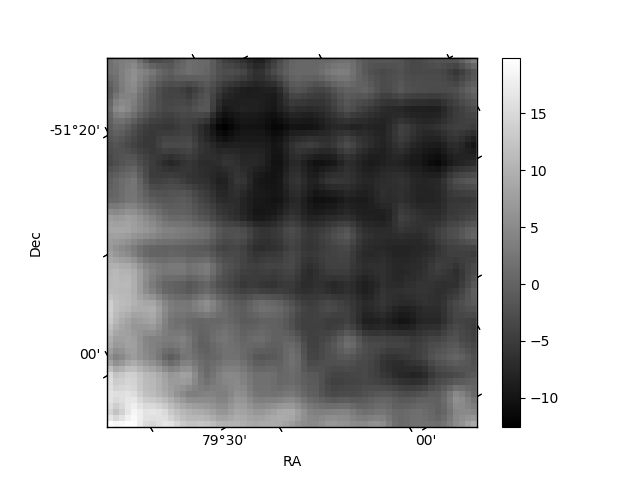
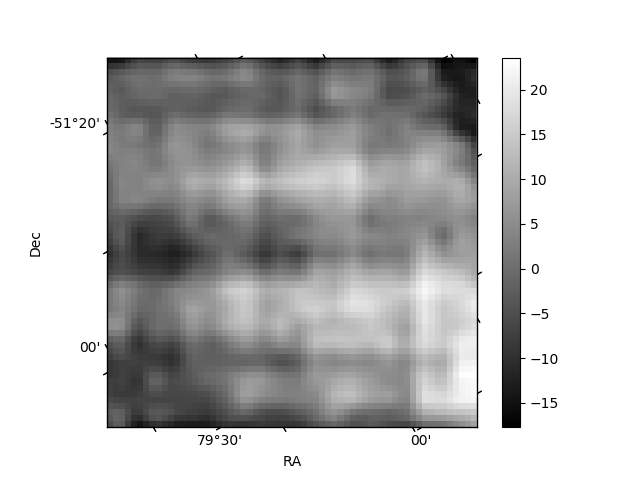
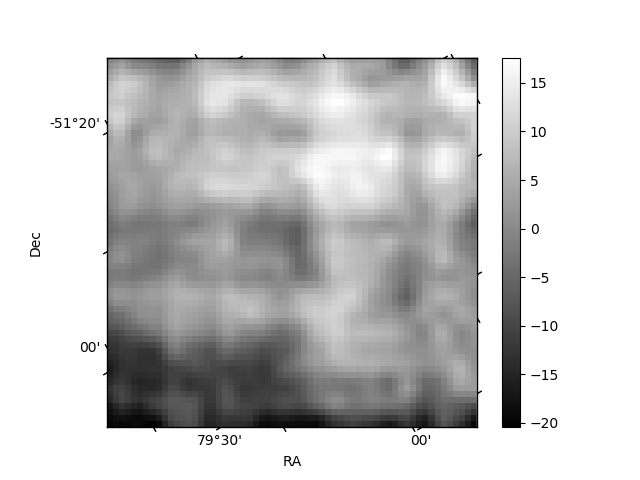
Histogram calculated using DETX and DETY for each event in the final _common_clean file
| Quadrant A | 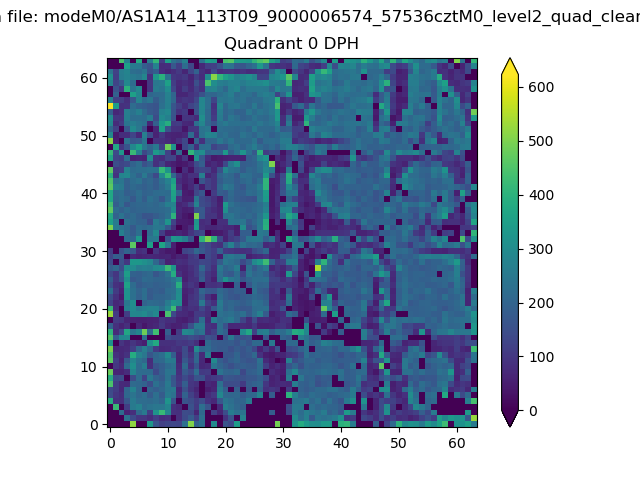 |
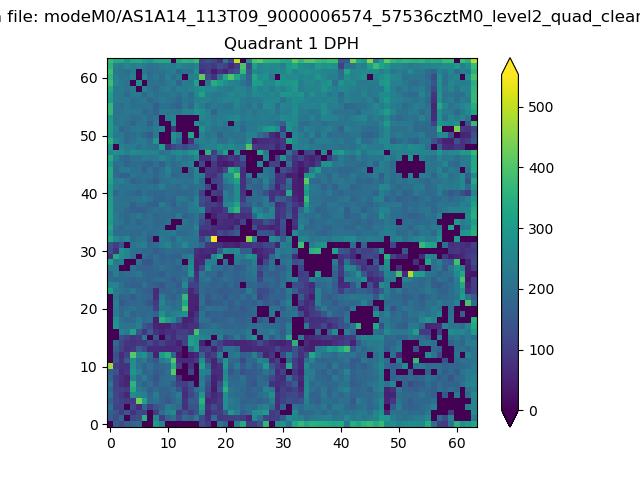 |
Quadrant B |
|---|---|---|---|
| Quadrant D | 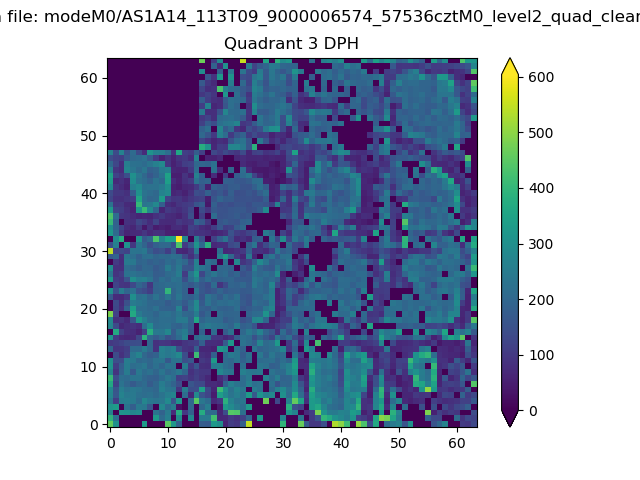 |
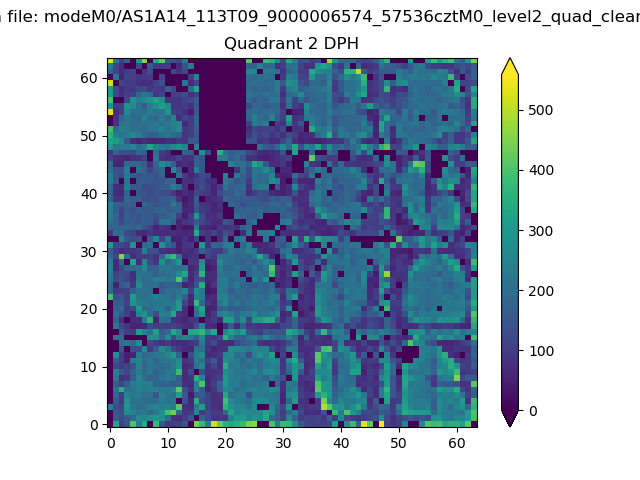 |
Quadrant C |
| Plot type | Count rate plots | Images |
|---|---|---|
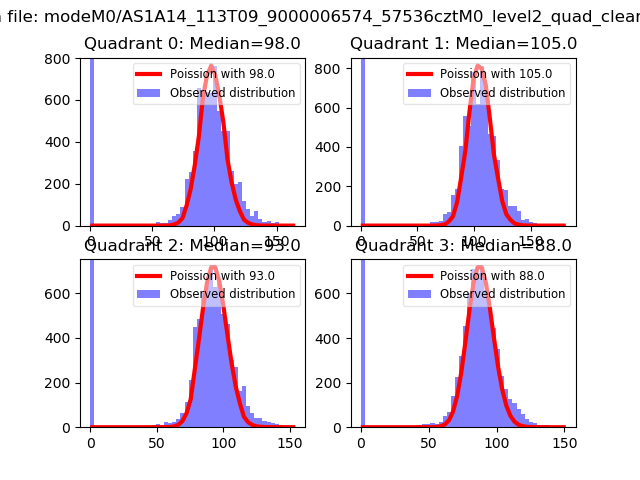
| Comparison with Poisson distribution Blue bars denote a histogram of data divided into 1 sec bins. Red curve is a Poisson curve with rate = median count rate of data. |
 |
 |
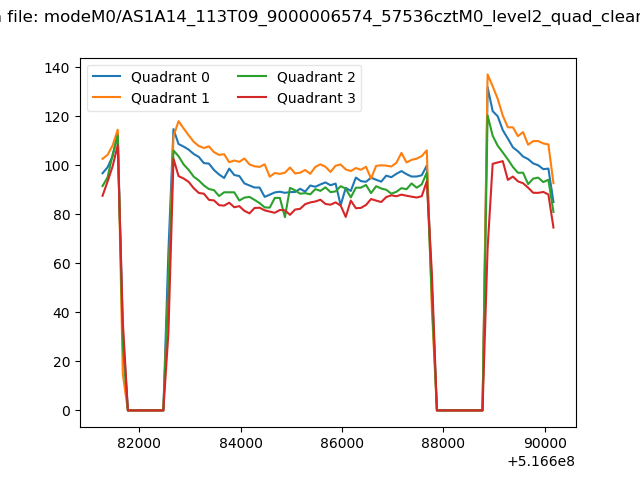
| Quadrant-wise count rates Data is divided into 100 sec bins |
 |
|
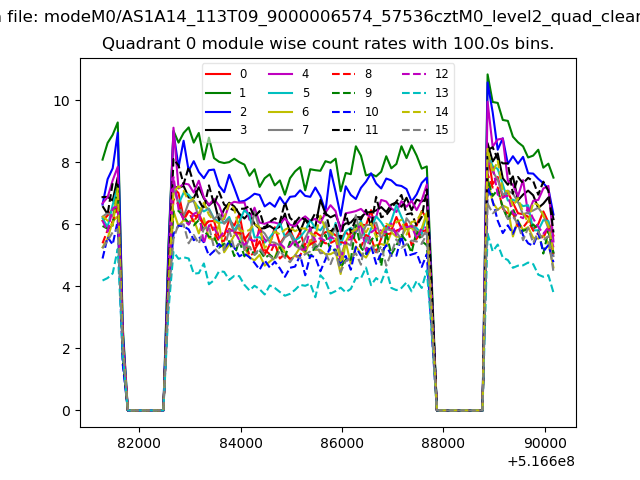
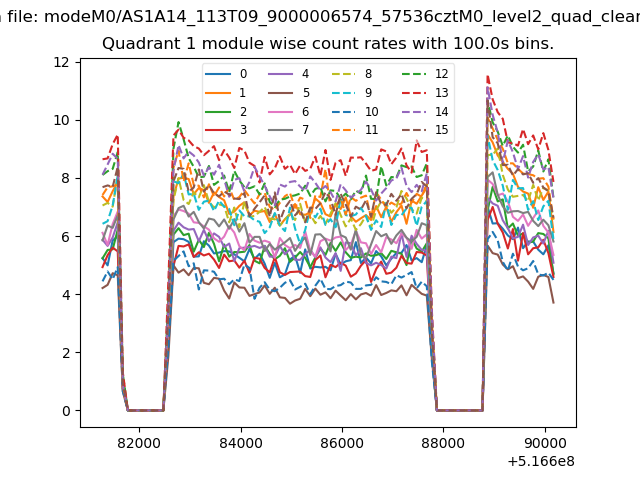
| Module-wise count rates for Quadrant A Data is divided into 100 sec bins |
 |
 |
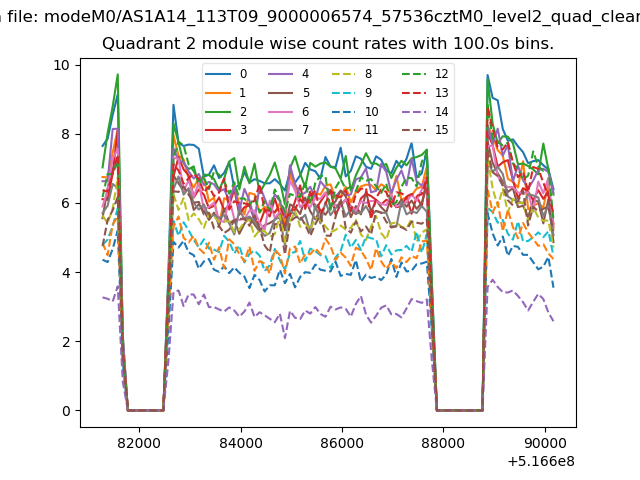
| Module-wise count rates for Quadrant B Data is divided into 100 sec bins |
 |
 |
| Module-wise count rates for Quadrant C Data is divided into 100 sec bins |
 |
 |
| Module-wise count rates for Quadrant D Data is divided into 100 sec bins |
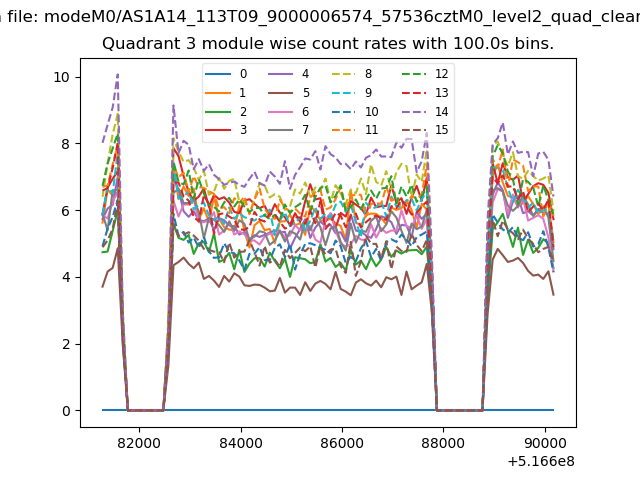 |
 |
| Parameter | Plot |
|---|---|
| CZT HV Monitor | 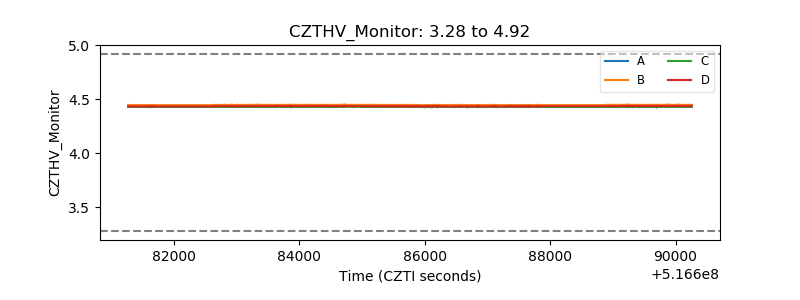 |
| D_VDD | 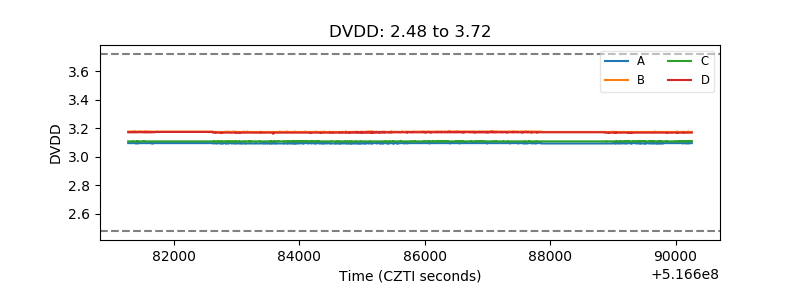 |
| Temperature 1 | 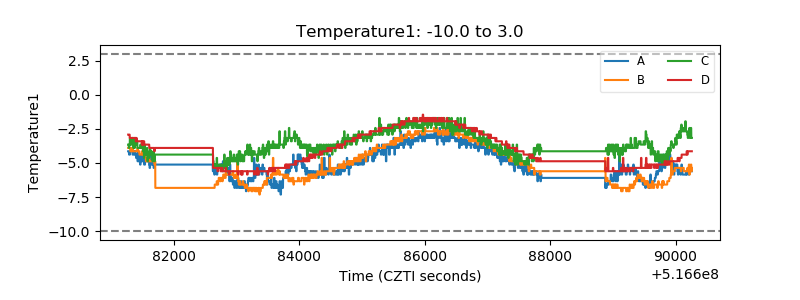 |
| Veto HV Monitor | 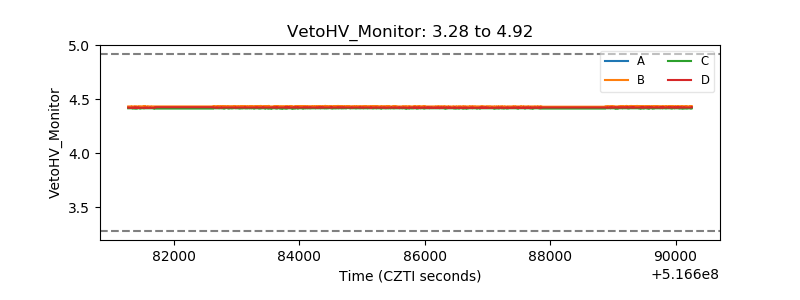 |
| Veto LLD | 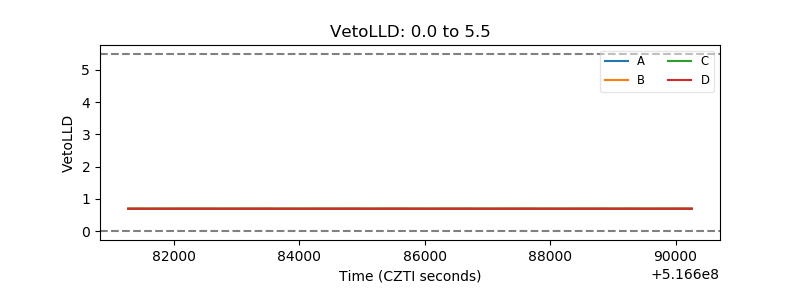 |
| Alpha Counter | 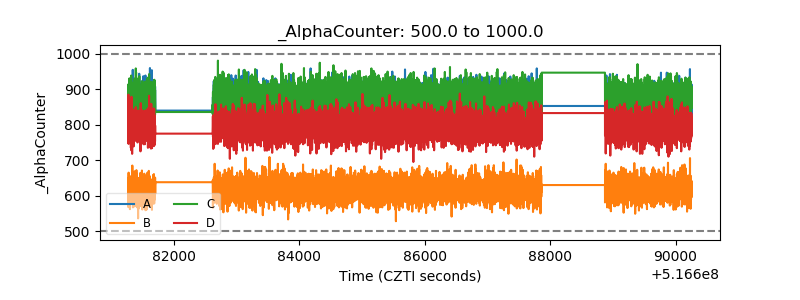 |
| _CPM_Rate | 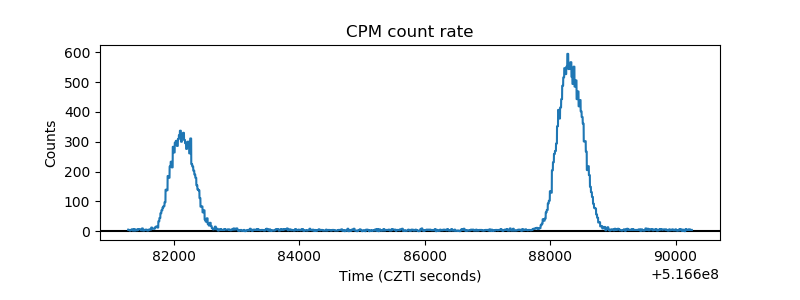 |
| CZT Counter | 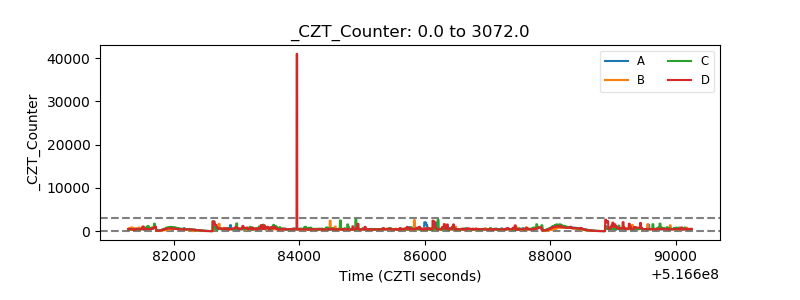 |
| +2.5 Volts monitor |  |
| +5 Volts monitor |  |
| _ROLL_ROT | 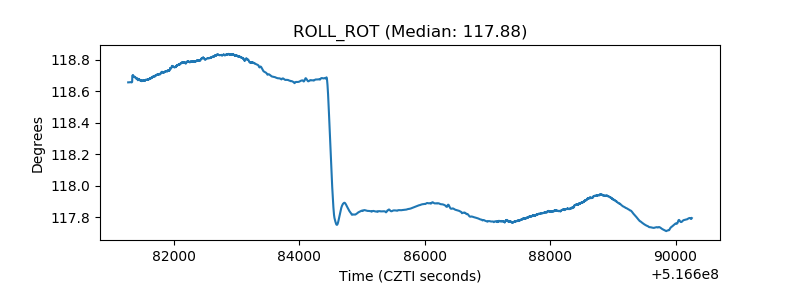 |
| _Roll_DEC | 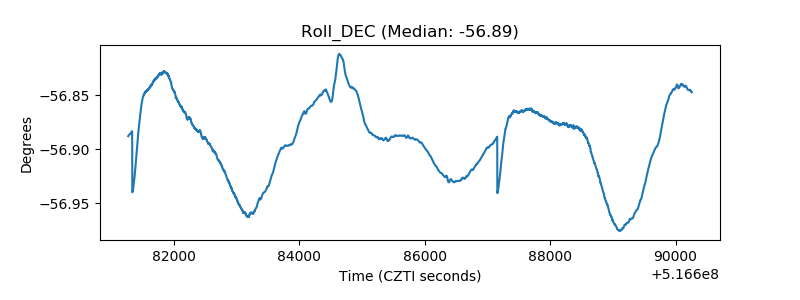 |
| _Roll_RA | 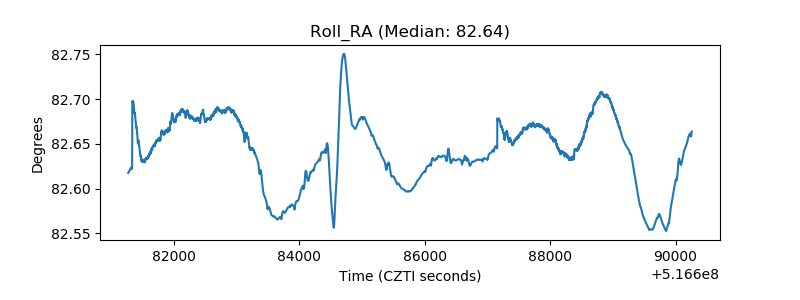 |
| Veto Counter | 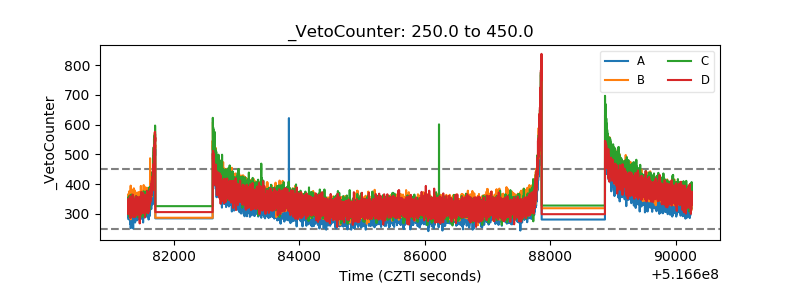 |