| Param | Original file | Final file |
|---|---|---|
| Filename | modeM0/AS1A14_113T09_9000006574_57537cztM0_level2.fits | modeM0/AS1A14_113T09_9000006574_57537cztM0_level2_quad_clean.evt |
| Size (bytes) | 420,016,320 | 99,374,400 |
| Size | 400.6 MB | 94.8 MB |
| Events in quadrant A | 3,281,846 | 657,163 |
| Events in quadrant B | 3,235,361 | 705,459 |
| Events in quadrant C | 4,387,237 | 617,212 |
| Events in quadrant D | 4,132,307 | 571,586 |
| Mode SS | |||
|---|---|---|---|
| Quadrant | BADHDUFLAG | Total packets | Discarded packets |
| A | 0 | 132 | 0 |
| B | 0 | 132 | 0 |
| C | 0 | 132 | 0 |
| D | 0 | 132 | 0 |
| Mode M9 | |||
|---|---|---|---|
| Quadrant | BADHDUFLAG | Total packets | Discarded packets |
| A | 0 | 18 | 0 |
| B | 0 | 19 | 0 |
| C | 0 | 19 | 0 |
| D | 0 | 19 | 0 |
| Mode M0 | |||
|---|---|---|---|
| Quadrant | BADHDUFLAG | Total packets | Discarded packets |
| A | 0 | 14302 | 2 |
| B | 0 | 14036 | 2 |
| C | 0 | 17560 | 2 |
| D | 0 | 16807 | 2 |
| Quadrant | Total seconds | Saturated seconds | Saturation percentage |
|---|---|---|---|
| A | 6567 | 93 | 1.416172% |
| B | 6567 | 125 | 1.903457% |
| C | 6567 | 264 | 4.020101% |
| D | 6567 | 328 | 4.994670% |
Noise dominated data is calculated using 1-second bins in cleaned event files. If a bin has >2000 counts, and if more than 50% of those come from <1% of pixels, then it is considered to be noise-dominated and hence unusable.
| Quadrant | # 1 sec bins | Bins with >0 counts | Bins with >2000 counts | High rate bins dominated by noise | Noise dominated (total time) | Noise dominated (detector-on time) | Marked lightcurve |
|---|---|---|---|---|---|---|---|
| A | 7627 | 6568 | 7 | 7 | 0.09% | 0.11% | 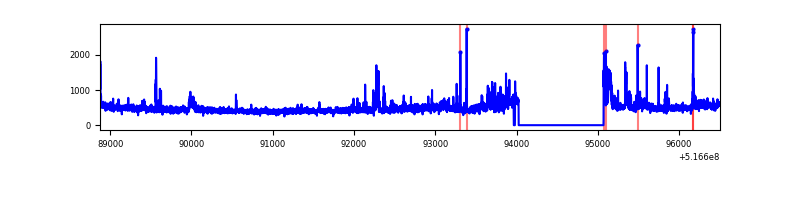 |
| B | 7627 | 6568 | 19 | 19 | 0.25% | 0.29% | 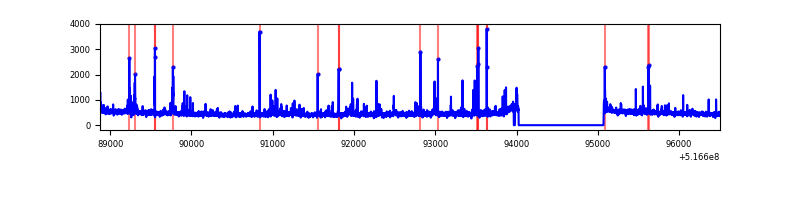 |
| C | 7627 | 6568 | 154 | 154 | 2.02% | 2.34% | 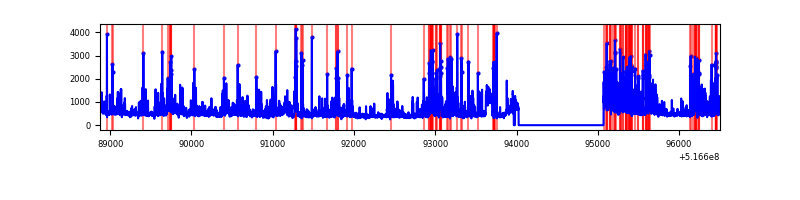 |
| D | 7627 | 6568 | 252 | 252 | 3.30% | 3.84% | 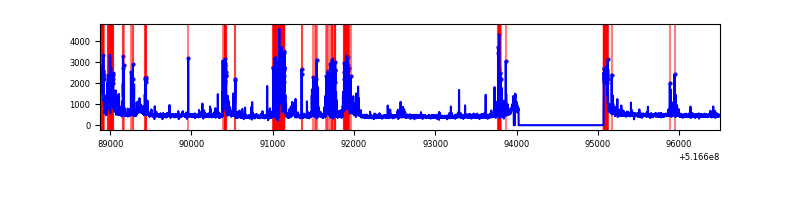 |
Top three noisy pixels from each quadrant. If the there are fewer than three noisy pixels in the level2.evt file, extra rows are filled as -1
| Pixel properties | Quadrant properties | ||||||
|---|---|---|---|---|---|---|---|
| Quadrant | DetID | PixID | Counts | Sigma | Mean | Median | Sigma |
| A | 3 | 14 | 300830 | 1659.92 | 735 | 715 | 180.8 |
| A | 4 | 249 | 82593 | 452.86 | 735 | 715 | 180.8 |
| A | 10 | 251 | 25728 | 138.35 | 735 | 715 | 180.8 |
| B | 4 | 67 | 68856 | 441.61 | 722 | 696 | 154.3 |
| B | 4 | 206 | 50286 | 321.29 | 722 | 696 | 154.3 |
| B | 10 | 247 | 48270 | 308.23 | 722 | 696 | 154.3 |
| C | 15 | 224 | 1198545 | 6227.47 | 710 | 702 | 192.3 |
| C | 12 | 252 | 167364 | 866.46 | 710 | 702 | 192.3 |
| C | 14 | 245 | 154586 | 800.03 | 710 | 702 | 192.3 |
| D | 15 | 94 | 523031 | 2633.36 | 704 | 673 | 198.4 |
| D | 15 | 142 | 413935 | 2083.37 | 704 | 673 | 198.4 |
| D | 8 | 160 | 129954 | 651.74 | 704 | 673 | 198.4 |
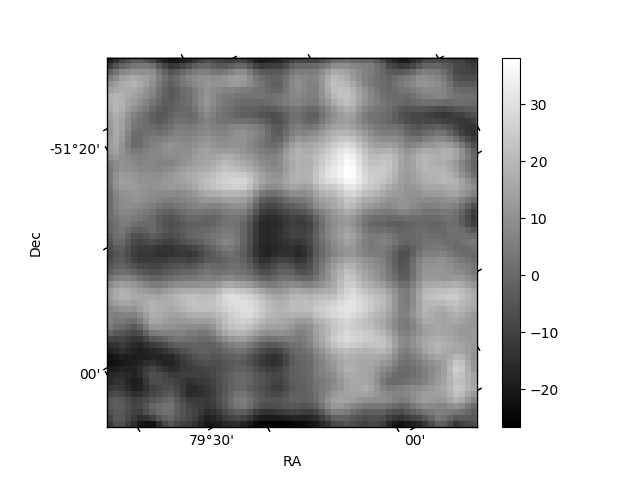
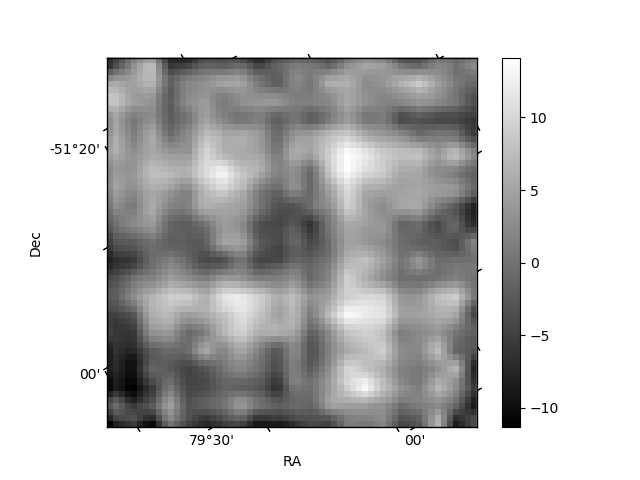
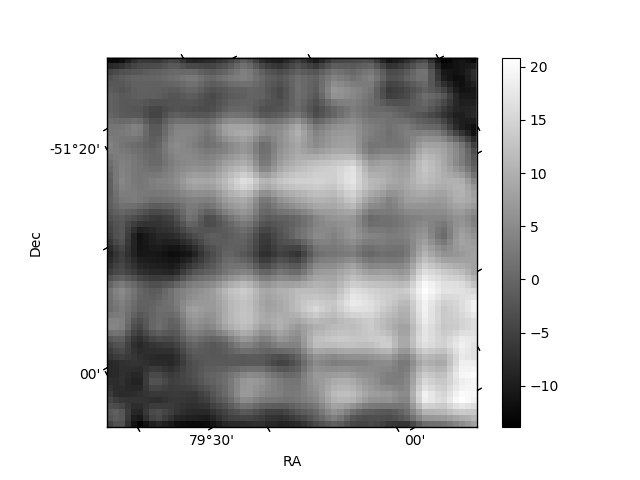
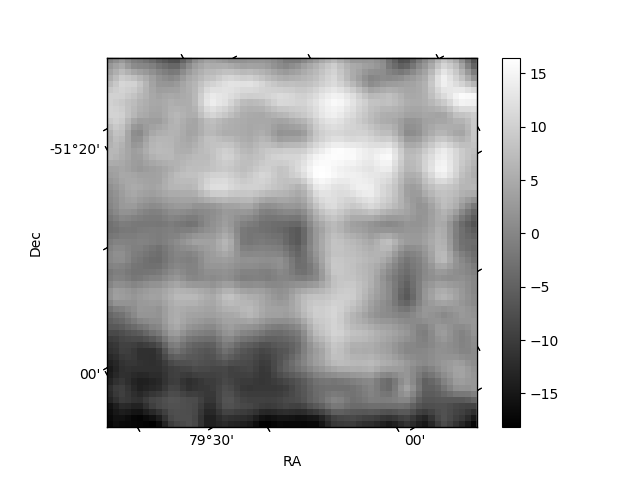
Histogram calculated using DETX and DETY for each event in the final _common_clean file
| Quadrant A | 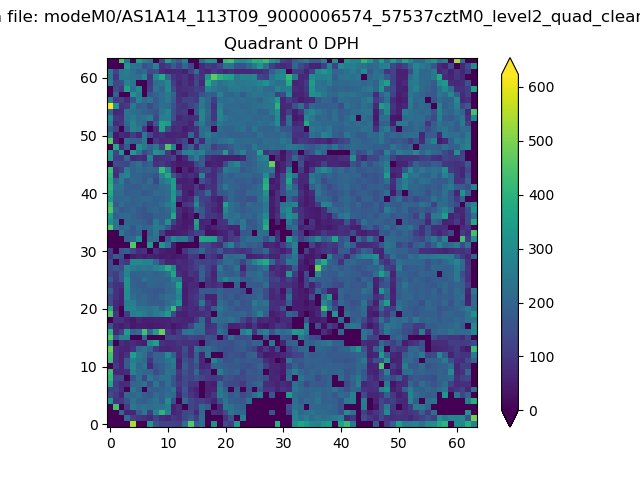 |
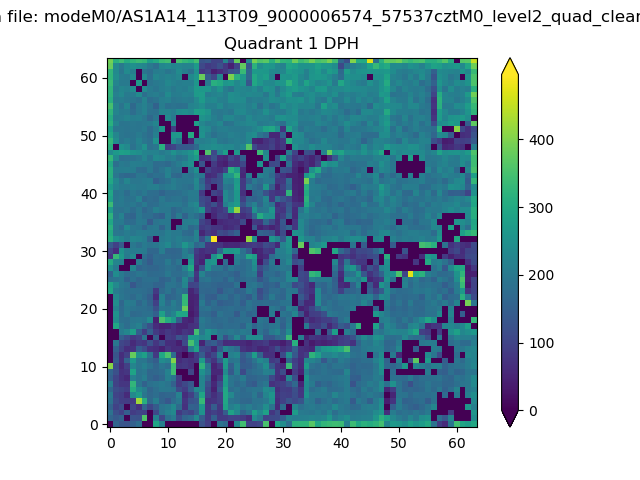 |
Quadrant B |
|---|---|---|---|
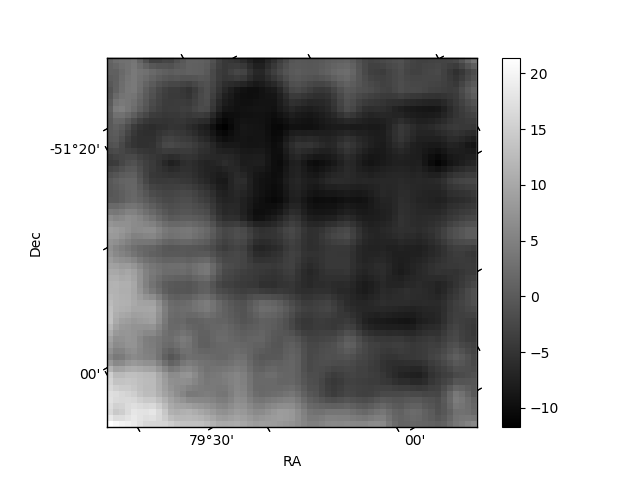
| Quadrant D | 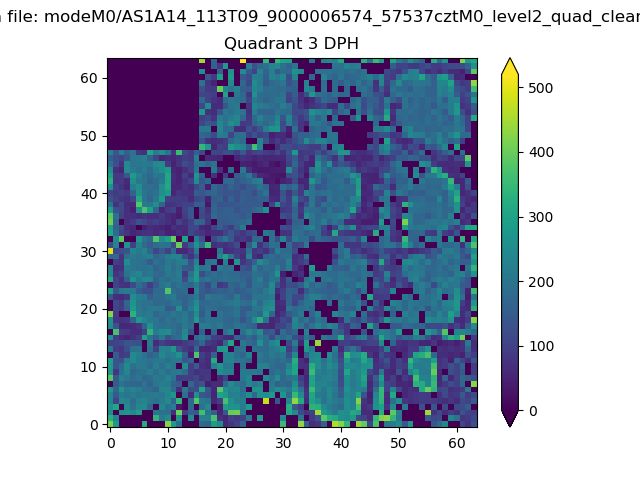 |
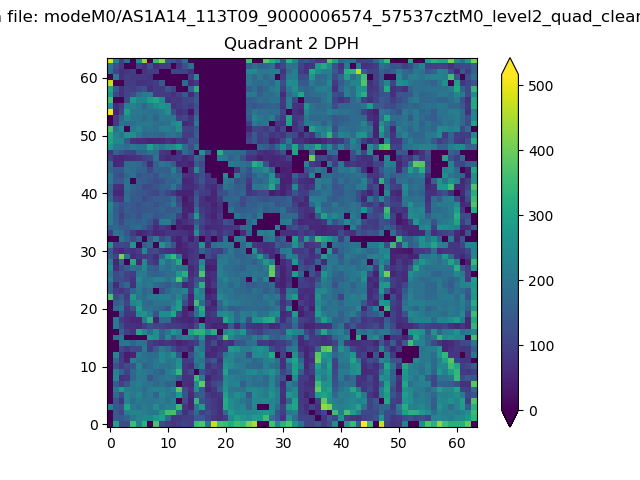 |
Quadrant C |
| Plot type | Count rate plots | Images |
|---|---|---|
| Comparison with Poisson distribution Blue bars denote a histogram of data divided into 1 sec bins. Red curve is a Poisson curve with rate = median count rate of data. |
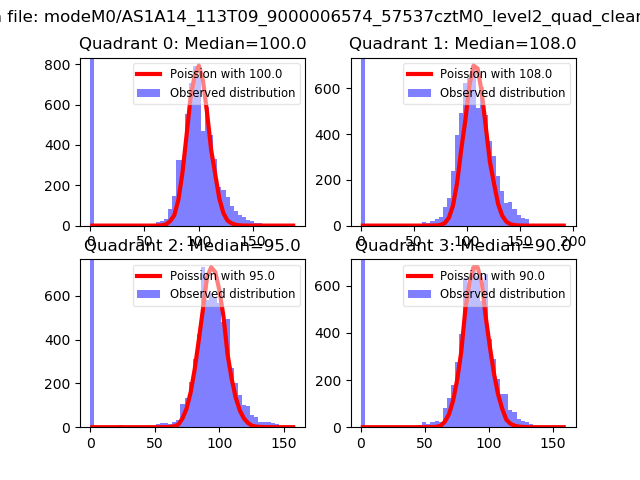 |
 |
| Quadrant-wise count rates Data is divided into 100 sec bins |
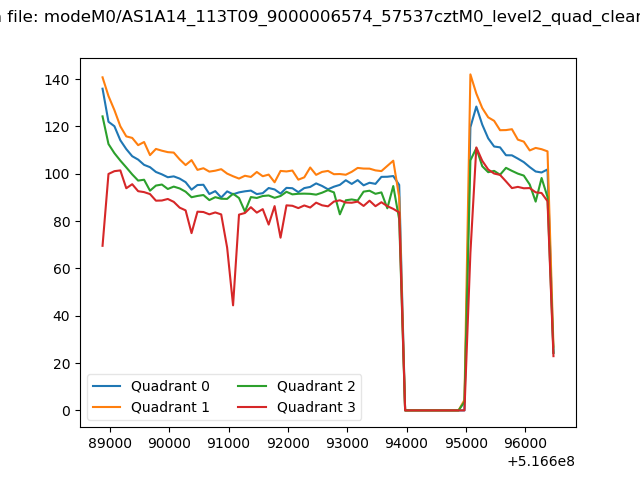 |
|
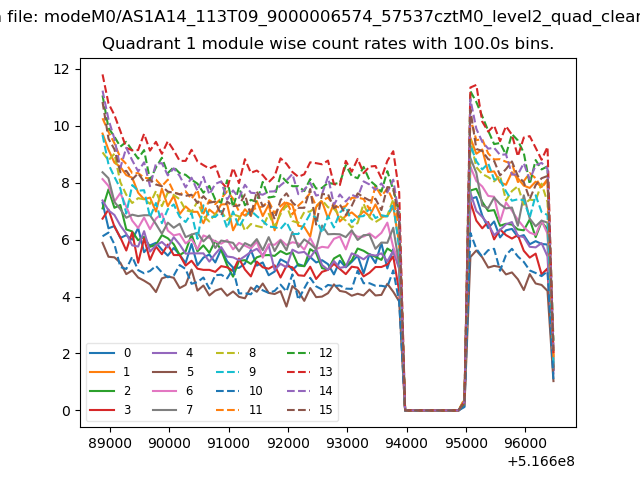
| Module-wise count rates for Quadrant A Data is divided into 100 sec bins |
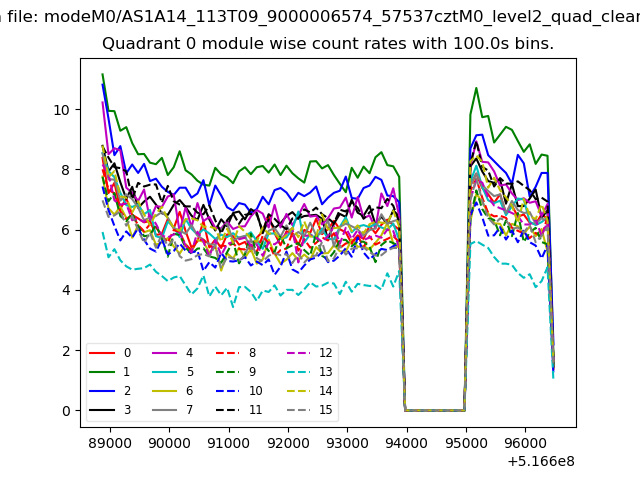 |
 |
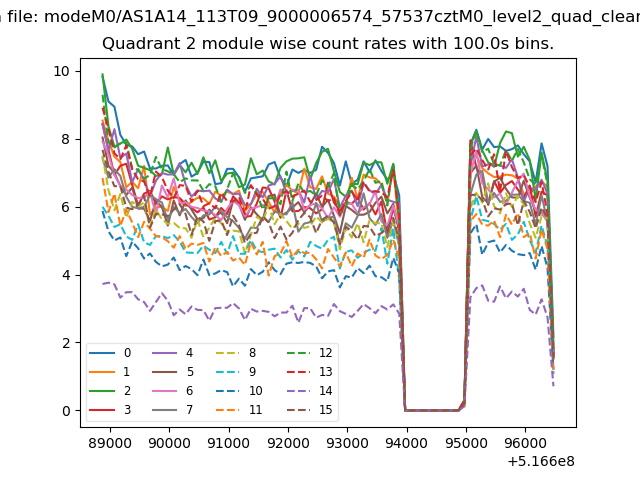
| Module-wise count rates for Quadrant B Data is divided into 100 sec bins |
 |
 |
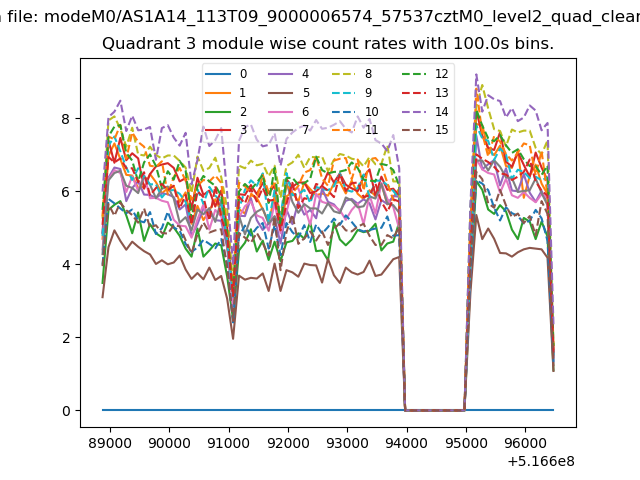
| Module-wise count rates for Quadrant C Data is divided into 100 sec bins |
 |
 |
| Module-wise count rates for Quadrant D Data is divided into 100 sec bins |
 |
 |
| Parameter | Plot |
|---|---|
| CZT HV Monitor | 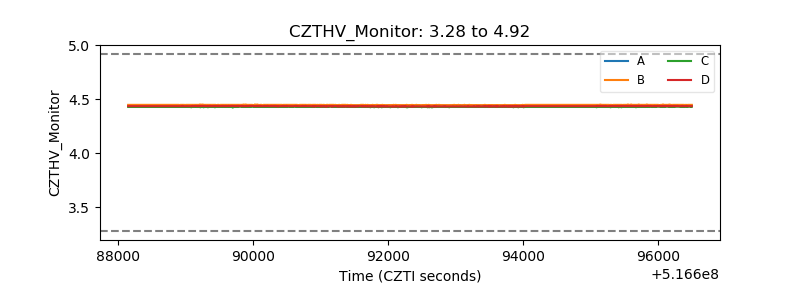 |
| D_VDD | 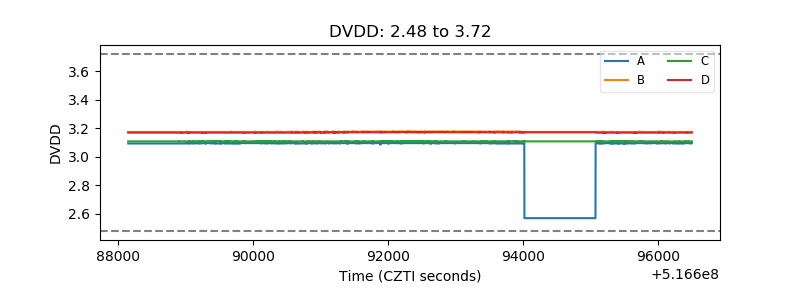 |
| Temperature 1 | 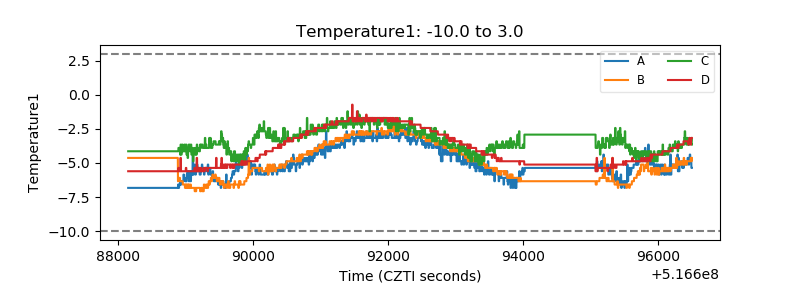 |
| Veto HV Monitor | 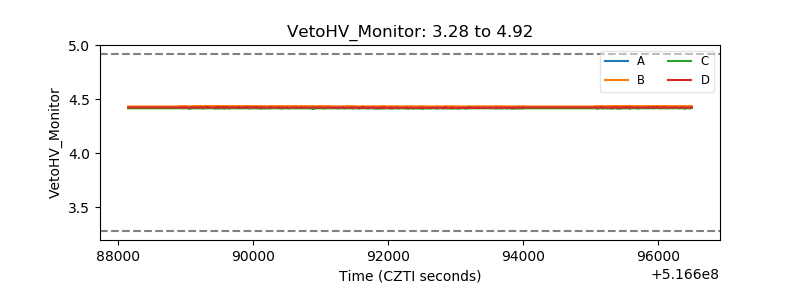 |
| Veto LLD | 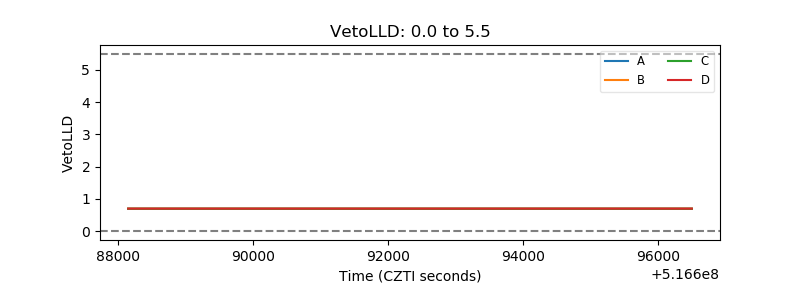 |
| Alpha Counter | 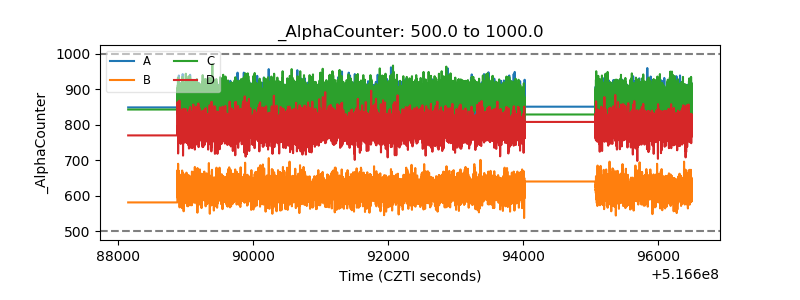 |
| _CPM_Rate | 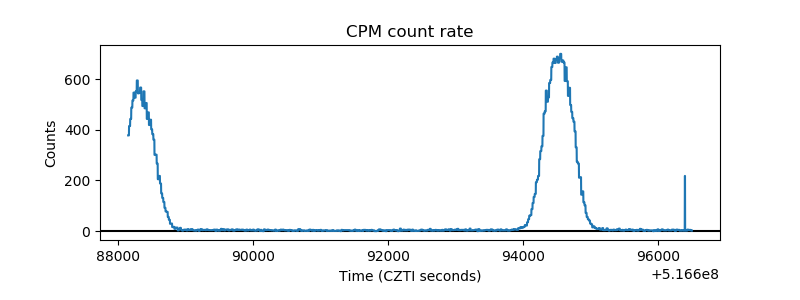 |
| CZT Counter | 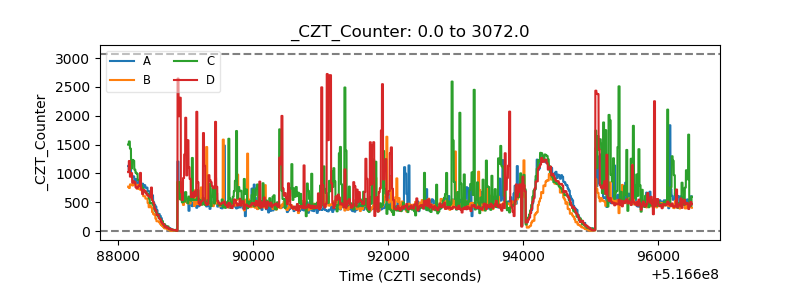 |
| +2.5 Volts monitor |  |
| +5 Volts monitor |  |
| _ROLL_ROT | 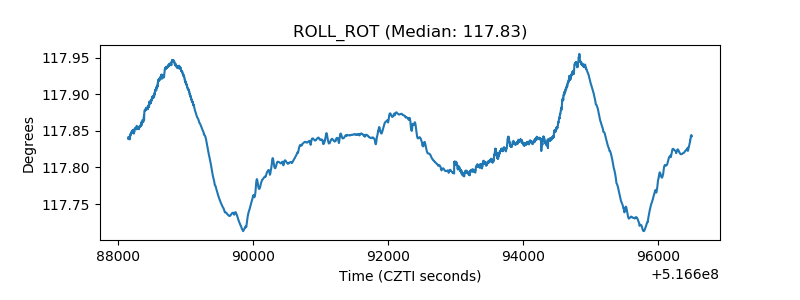 |
| _Roll_DEC | 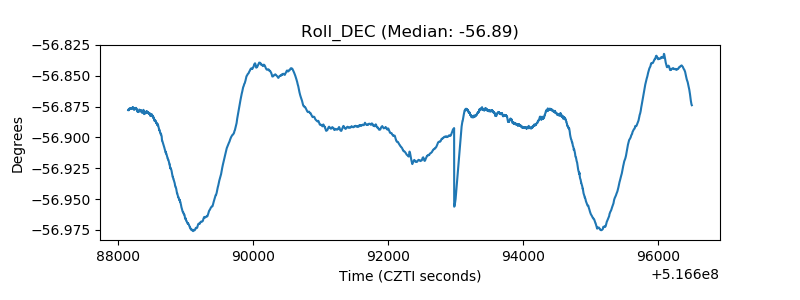 |
| _Roll_RA | 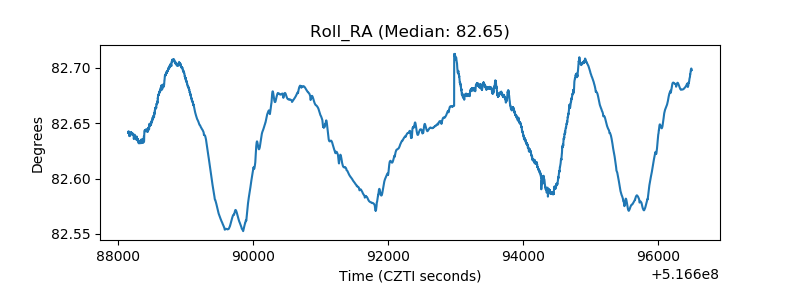 |
| Veto Counter | 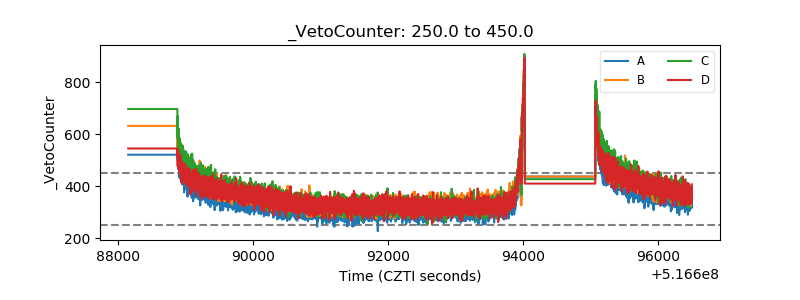 |