| Param | Original file | Final file |
|---|---|---|
| Filename | modeM0/AS1A14_113T09_9000006574_57538cztM0_level2.fits | modeM0/AS1A14_113T09_9000006574_57538cztM0_level2_quad_clean.evt |
| Size (bytes) | 382,875,840 | 88,228,800 |
| Size | 365.1 MB | 84.1 MB |
| Events in quadrant A | 3,065,406 | 577,895 |
| Events in quadrant B | 2,868,553 | 629,092 |
| Events in quadrant C | 3,874,425 | 551,210 |
| Events in quadrant D | 3,908,378 | 503,962 |
| Mode SS | |||
|---|---|---|---|
| Quadrant | BADHDUFLAG | Total packets | Discarded packets |
| A | 0 | 118 | 0 |
| B | 0 | 118 | 0 |
| C | 0 | 118 | 0 |
| D | 0 | 118 | 0 |
| Mode M9 | |||
|---|---|---|---|
| Quadrant | BADHDUFLAG | Total packets | Discarded packets |
| A | 0 | 11 | 0 |
| B | 0 | 11 | 0 |
| C | 0 | 11 | 0 |
| D | 0 | 11 | 0 |
| Mode M0 | |||
|---|---|---|---|
| Quadrant | BADHDUFLAG | Total packets | Discarded packets |
| A | 0 | 13315 | 1 |
| B | 0 | 12567 | 1 |
| C | 0 | 15611 | 1 |
| D | 0 | 15511 | 1 |
| Quadrant | Total seconds | Saturated seconds | Saturation percentage |
|---|---|---|---|
| A | 5856 | 149 | 2.544399% |
| B | 5857 | 73 | 1.246372% |
| C | 5857 | 251 | 4.285470% |
| D | 5857 | 351 | 5.992829% |
Noise dominated data is calculated using 1-second bins in cleaned event files. If a bin has >2000 counts, and if more than 50% of those come from <1% of pixels, then it is considered to be noise-dominated and hence unusable.
| Quadrant | # 1 sec bins | Bins with >0 counts | Bins with >2000 counts | High rate bins dominated by noise | Noise dominated (total time) | Noise dominated (detector-on time) | Marked lightcurve |
|---|---|---|---|---|---|---|---|
| A | 6991 | 5857 | 60 | 60 | 0.86% | 1.02% | 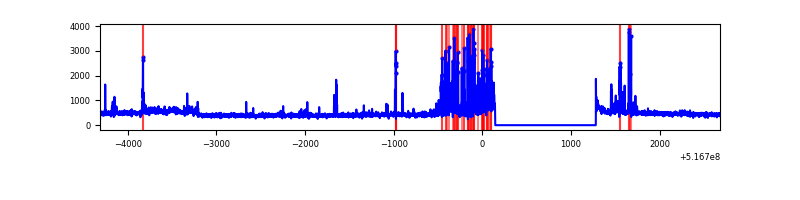 |
| B | 6992 | 5858 | 17 | 17 | 0.24% | 0.29% | 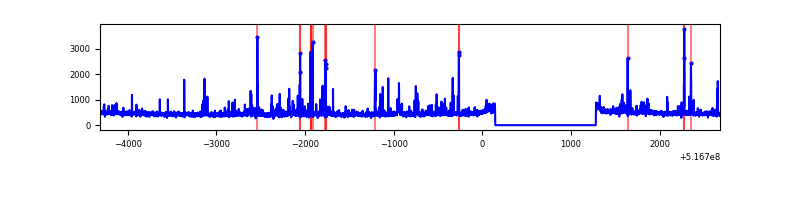 |
| C | 6992 | 5858 | 167 | 167 | 2.39% | 2.85% | 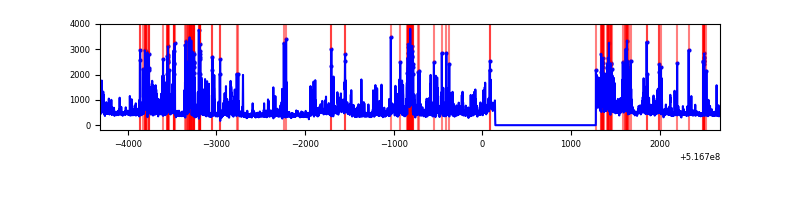 |
| D | 6992 | 5858 | 304 | 304 | 4.35% | 5.19% | 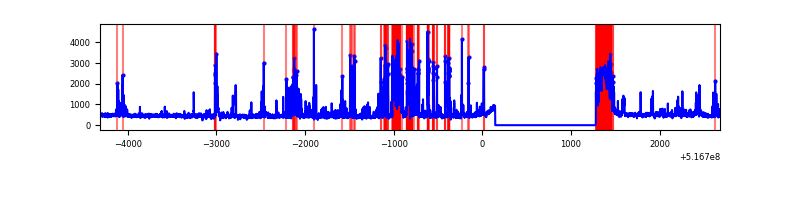 |
Top three noisy pixels from each quadrant. If the there are fewer than three noisy pixels in the level2.evt file, extra rows are filled as -1
| Pixel properties | Quadrant properties | ||||||
|---|---|---|---|---|---|---|---|
| Quadrant | DetID | PixID | Counts | Sigma | Mean | Median | Sigma |
| A | 10 | 251 | 385058 | 2436.51 | 646 | 629 | 157.8 |
| A | 3 | 14 | 111885 | 705.14 | 646 | 629 | 157.8 |
| A | 4 | 249 | 31491 | 195.6 | 646 | 629 | 157.8 |
| B | 10 | 247 | 106888 | 785.95 | 638 | 615 | 135.2 |
| B | 7 | 252 | 77585 | 569.24 | 638 | 615 | 135.2 |
| B | 4 | 206 | 49809 | 363.82 | 638 | 615 | 135.2 |
| C | 15 | 224 | 1011455 | 5974.33 | 622 | 617 | 169.2 |
| C | 14 | 96 | 167650 | 987.21 | 622 | 617 | 169.2 |
| C | 14 | 245 | 86999 | 510.54 | 622 | 617 | 169.2 |
| D | 15 | 94 | 728905 | 4150.63 | 613 | 584 | 175.5 |
| D | 15 | 142 | 423681 | 2411.19 | 613 | 584 | 175.5 |
| D | 2 | 31 | 113336 | 642.56 | 613 | 584 | 175.5 |
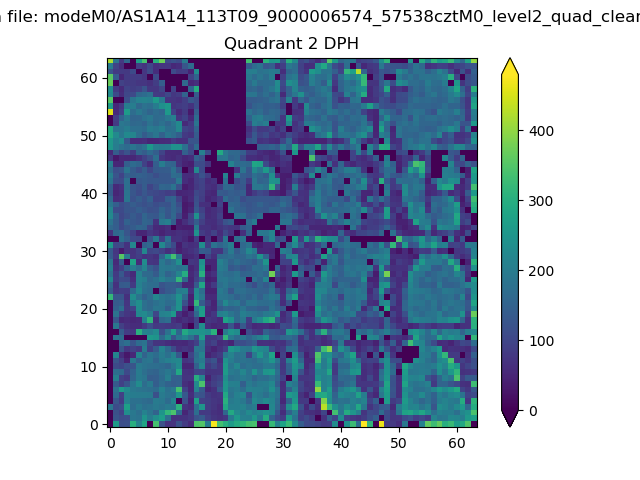
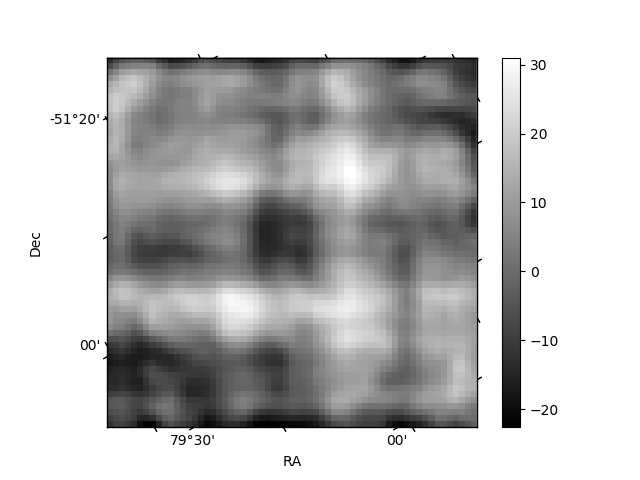
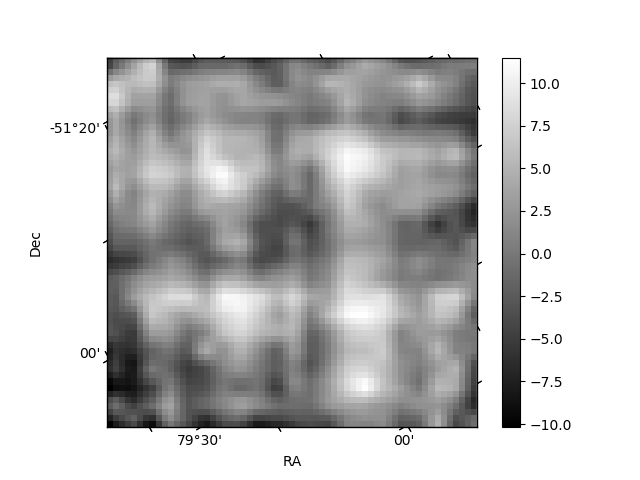
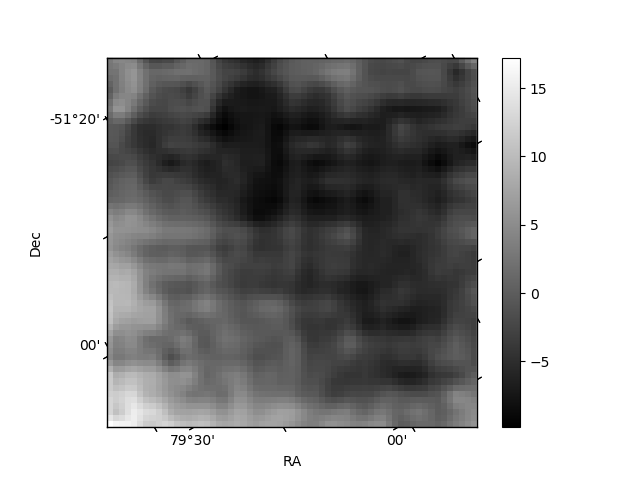
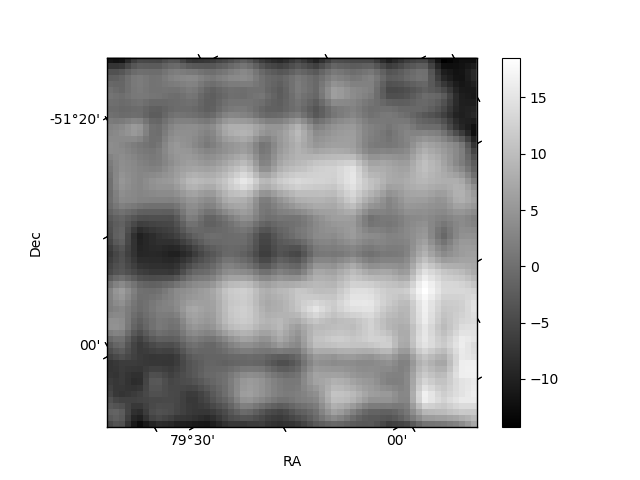
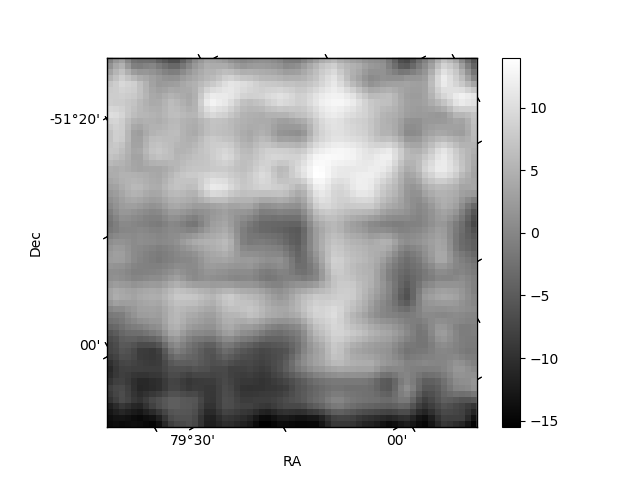
Histogram calculated using DETX and DETY for each event in the final _common_clean file
| Quadrant A | 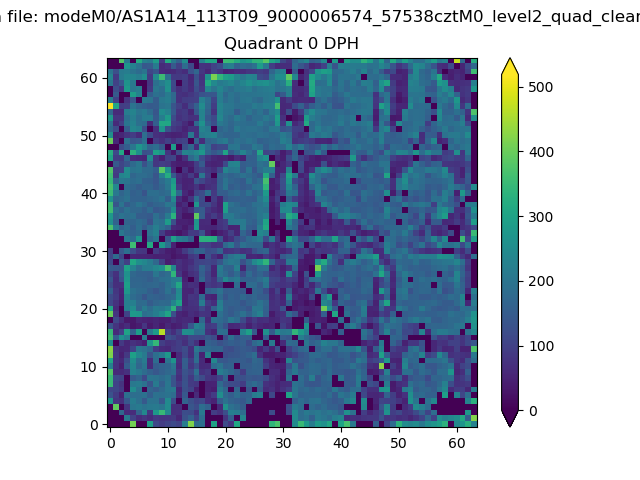 |
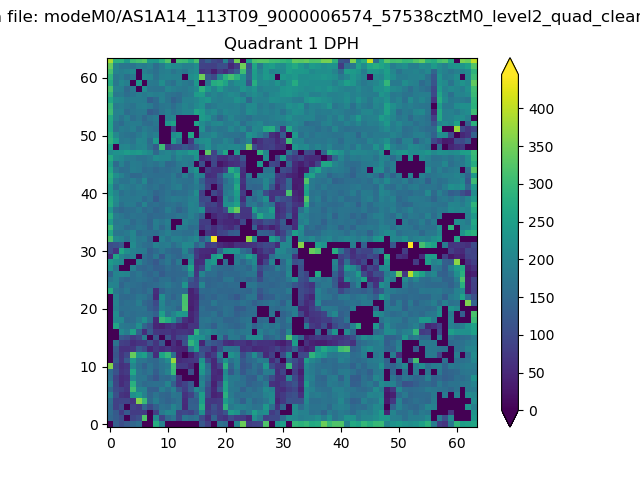 |
Quadrant B |
|---|---|---|---|
| Quadrant D | 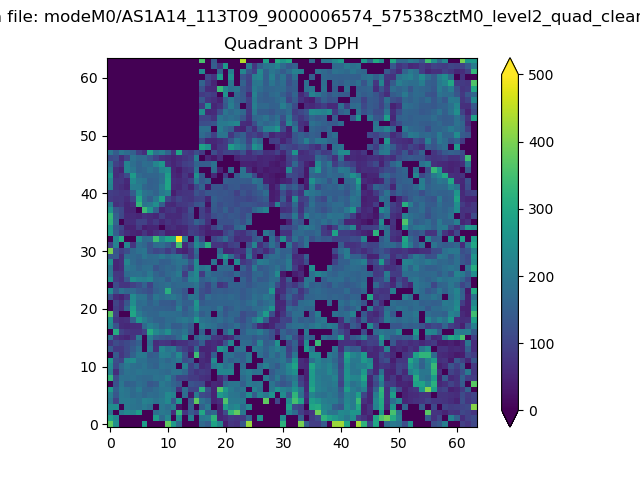 |
 |
Quadrant C |
| Plot type | Count rate plots | Images |
|---|---|---|
| Comparison with Poisson distribution Blue bars denote a histogram of data divided into 1 sec bins. Red curve is a Poisson curve with rate = median count rate of data. |
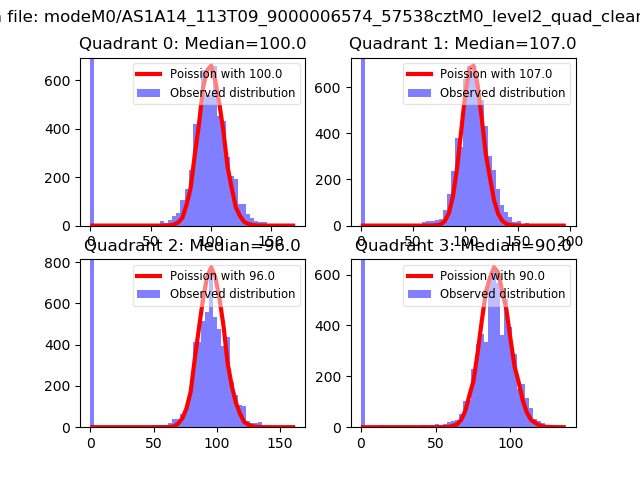 |
 |
| Quadrant-wise count rates Data is divided into 100 sec bins |
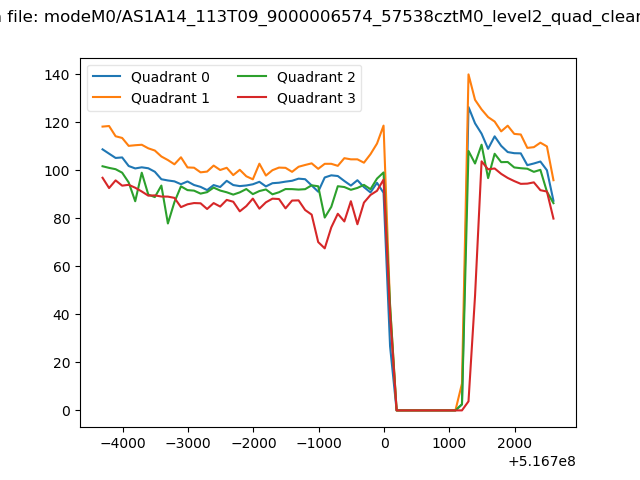 |
|
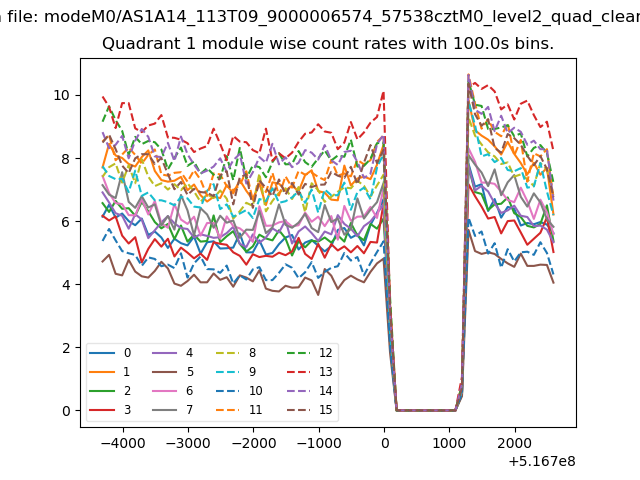
| Module-wise count rates for Quadrant A Data is divided into 100 sec bins |
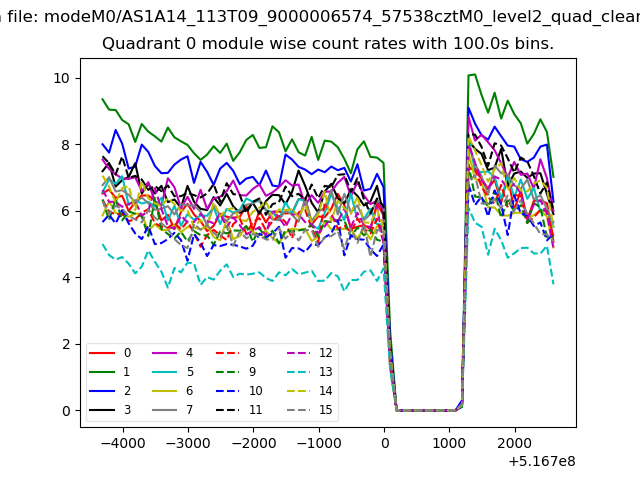 |
 |
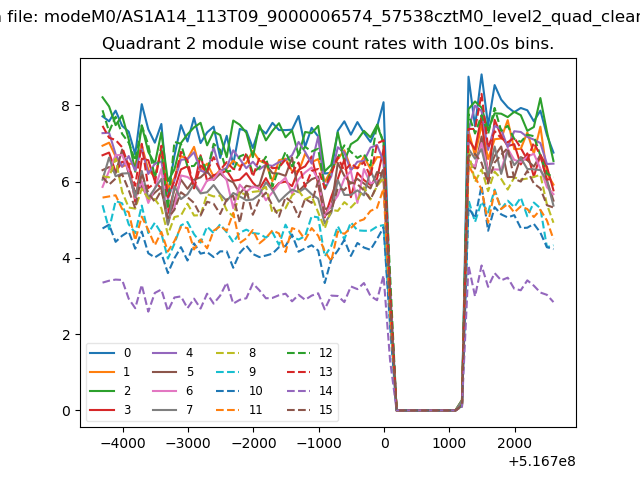
| Module-wise count rates for Quadrant B Data is divided into 100 sec bins |
 |
 |
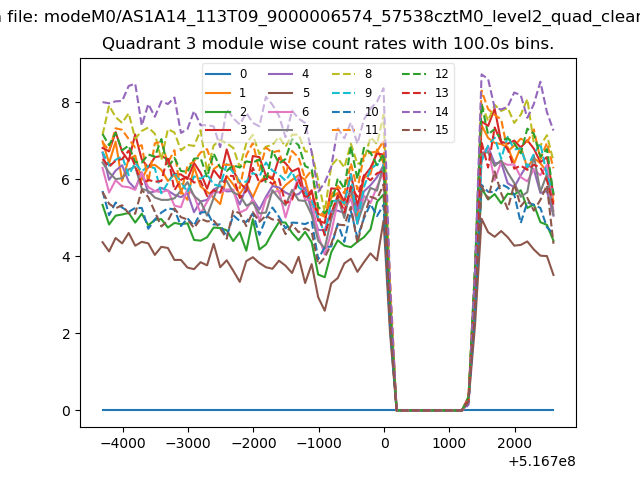
| Module-wise count rates for Quadrant C Data is divided into 100 sec bins |
 |
 |
| Module-wise count rates for Quadrant D Data is divided into 100 sec bins |
 |
 |
| Parameter | Plot |
|---|---|
| CZT HV Monitor | 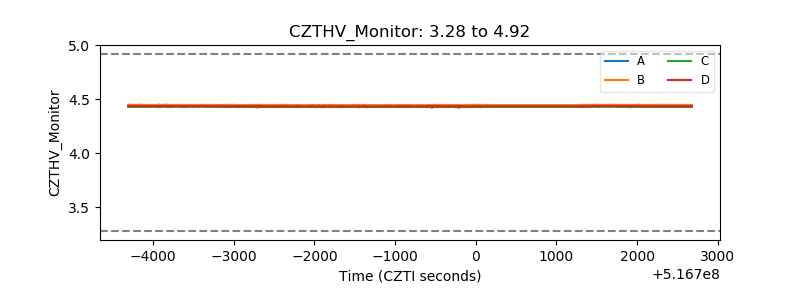 |
| D_VDD | 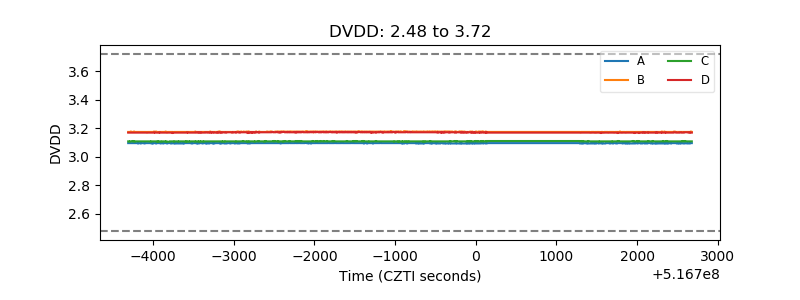 |
| Temperature 1 | 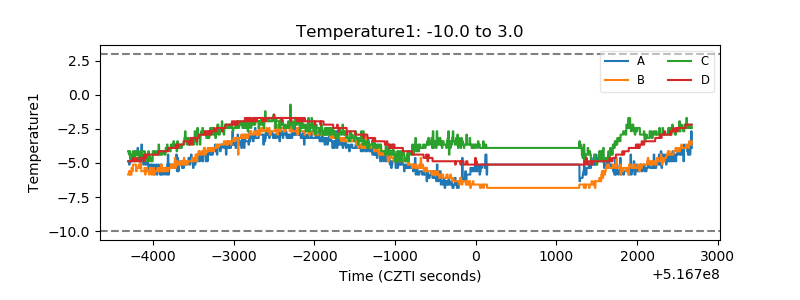 |
| Veto HV Monitor |  |
| Veto LLD | 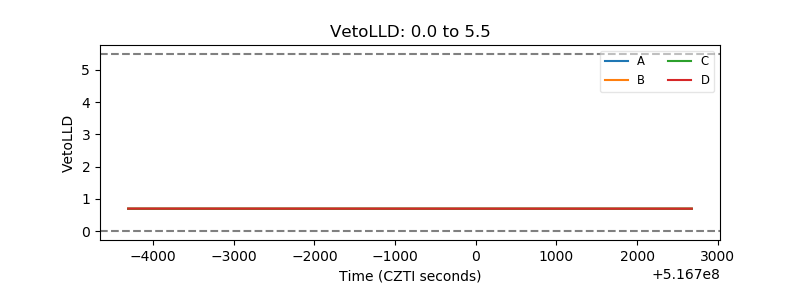 |
| Alpha Counter | 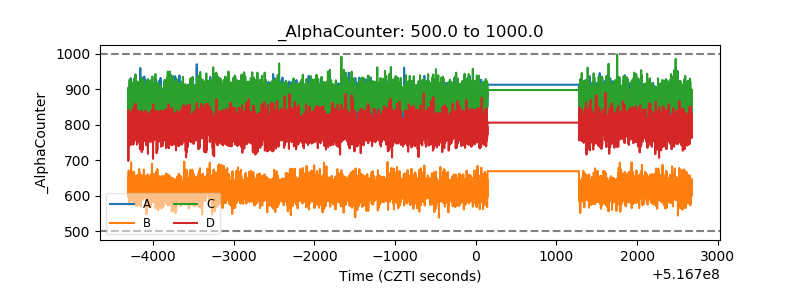 |
| _CPM_Rate | 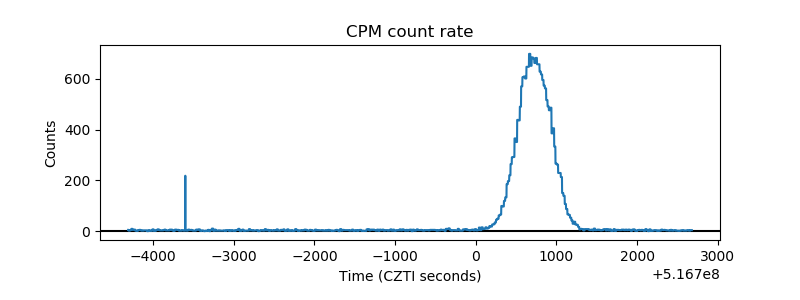 |
| CZT Counter | 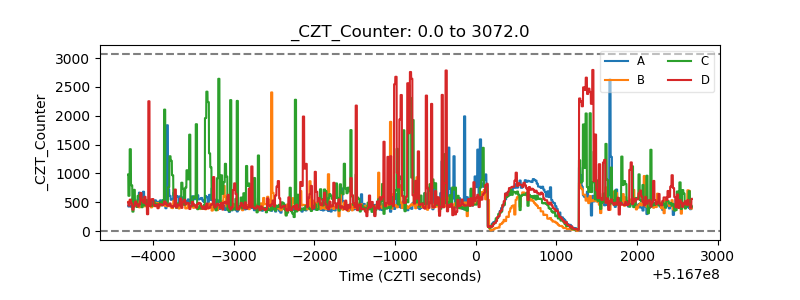 |
| +2.5 Volts monitor |  |
| +5 Volts monitor |  |
| _ROLL_ROT | 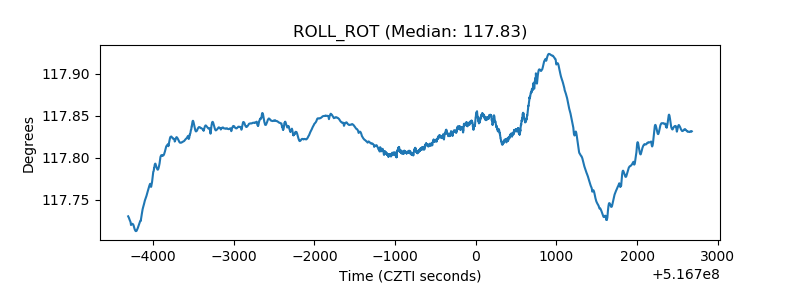 |
| _Roll_DEC | 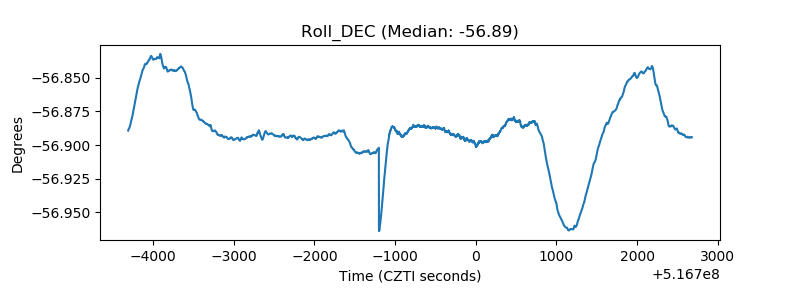 |
| _Roll_RA | 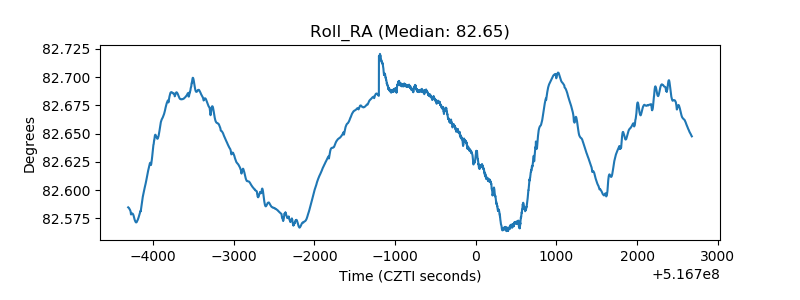 |
| Veto Counter | 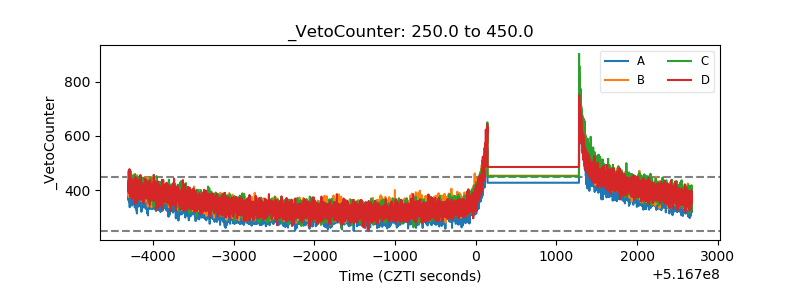 |