| Param | Original file | Final file |
|---|---|---|
| Filename | modeM0/AS1A14_113T09_9000006574_57543cztM0_level2.fits | modeM0/AS1A14_113T09_9000006574_57543cztM0_level2_quad_clean.evt |
| Size (bytes) | 514,909,440 | 100,172,160 |
| Size | 491.1 MB | 95.5 MB |
| Events in quadrant A | 3,408,411 | 671,179 |
| Events in quadrant B | 3,690,784 | 712,068 |
| Events in quadrant C | 5,661,335 | 586,935 |
| Events in quadrant D | 5,748,412 | 568,435 |
| Mode SS | |||
|---|---|---|---|
| Quadrant | BADHDUFLAG | Total packets | Discarded packets |
| A | 0 | 142 | 0 |
| B | 0 | 142 | 0 |
| C | 0 | 142 | 0 |
| D | 0 | 142 | 0 |
| Mode M0 | |||
|---|---|---|---|
| Quadrant | BADHDUFLAG | Total packets | Discarded packets |
| A | 0 | 15411 | 0 |
| B | 0 | 15935 | 0 |
| C | 0 | 21921 | 2 |
| D | 0 | 22042 | 0 |
| Quadrant | Total seconds | Saturated seconds | Saturation percentage |
|---|---|---|---|
| A | 7097 | 30 | 0.422714% |
| B | 7098 | 77 | 1.084813% |
| C | 7097 | 744 | 10.483303% |
| D | 7097 | 540 | 7.608849% |
Noise dominated data is calculated using 1-second bins in cleaned event files. If a bin has >2000 counts, and if more than 50% of those come from <1% of pixels, then it is considered to be noise-dominated and hence unusable.
| Quadrant | # 1 sec bins | Bins with >0 counts | Bins with >2000 counts | High rate bins dominated by noise | Noise dominated (total time) | Noise dominated (detector-on time) | Marked lightcurve |
|---|---|---|---|---|---|---|---|
| A | 7097 | 7097 | 12 | 12 | 0.17% | 0.17% | 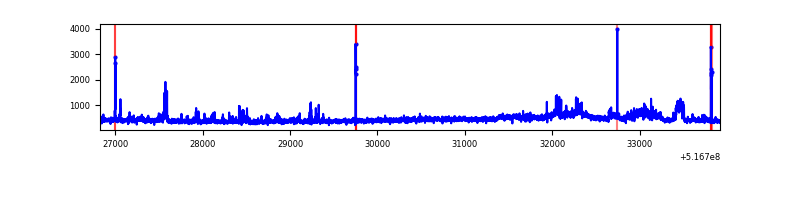 |
| B | 7098 | 7098 | 25 | 25 | 0.35% | 0.35% | 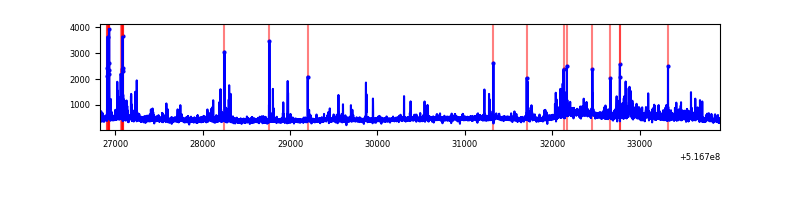 |
| C | 7097 | 7097 | 675 | 675 | 9.51% | 9.51% | 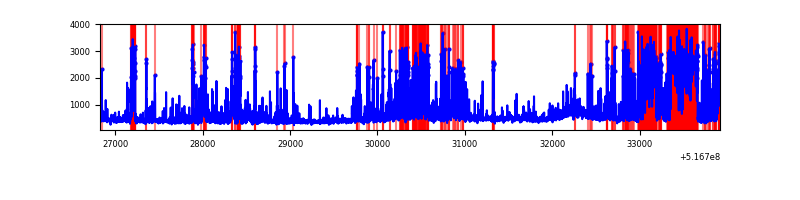 |
| D | 7097 | 7097 | 566 | 566 | 7.98% | 7.98% | 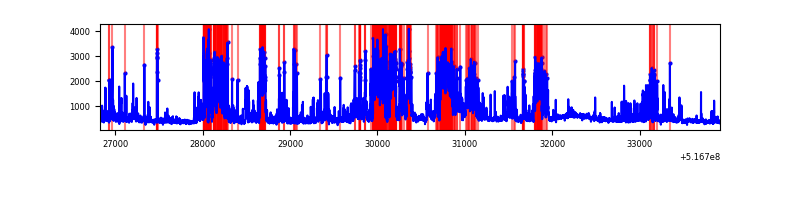 |
Top three noisy pixels from each quadrant. If the there are fewer than three noisy pixels in the level2.evt file, extra rows are filled as -1
| Pixel properties | Quadrant properties | ||||||
|---|---|---|---|---|---|---|---|
| Quadrant | DetID | PixID | Counts | Sigma | Mean | Median | Sigma |
| A | 3 | 14 | 311293 | 1673.53 | 762 | 742 | 185.6 |
| A | 3 | 245 | 48583 | 257.81 | 762 | 742 | 185.6 |
| A | 4 | 249 | 28577 | 150.0 | 762 | 742 | 185.6 |
| B | 4 | 206 | 355286 | 2200.25 | 749 | 719 | 161.1 |
| B | 5 | 185 | 82379 | 506.74 | 749 | 719 | 161.1 |
| B | 1 | 159 | 58337 | 357.54 | 749 | 719 | 161.1 |
| C | 15 | 224 | 1487466 | 7775.26 | 706 | 699 | 191.2 |
| C | 6 | 223 | 1185515 | 6196.16 | 706 | 699 | 191.2 |
| C | 12 | 254 | 70269 | 363.83 | 706 | 699 | 191.2 |
| D | 15 | 142 | 2127431 | 10428.72 | 719 | 684 | 203.9 |
| D | 3 | 12 | 189027 | 923.56 | 719 | 684 | 203.9 |
| D | 15 | 94 | 162973 | 795.8 | 719 | 684 | 203.9 |
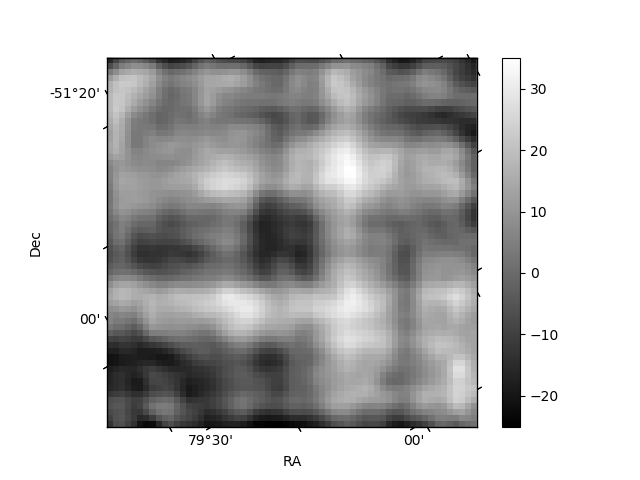
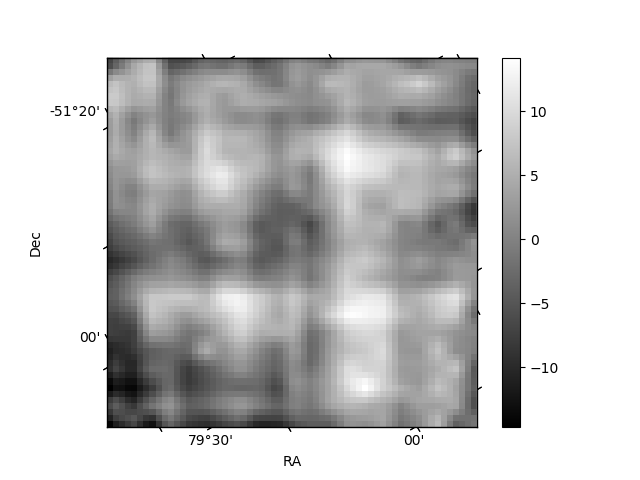
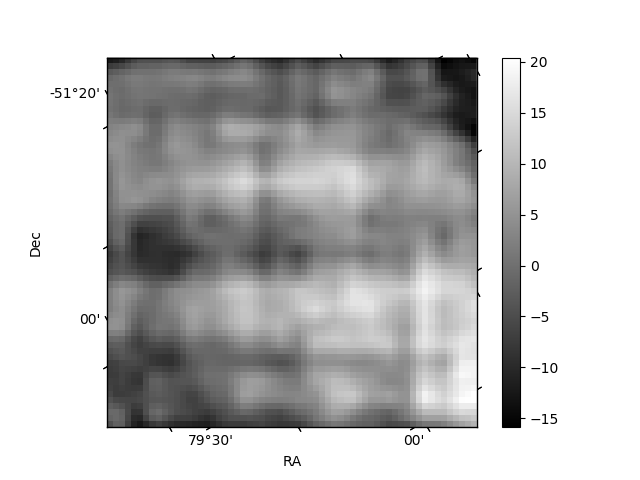
Histogram calculated using DETX and DETY for each event in the final _common_clean file
| Quadrant A | 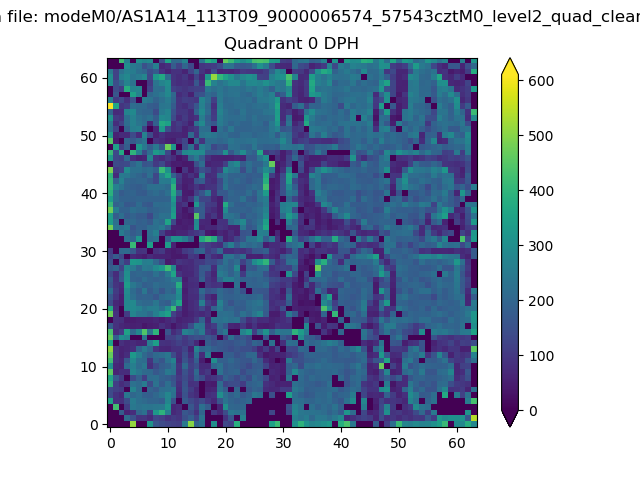 |
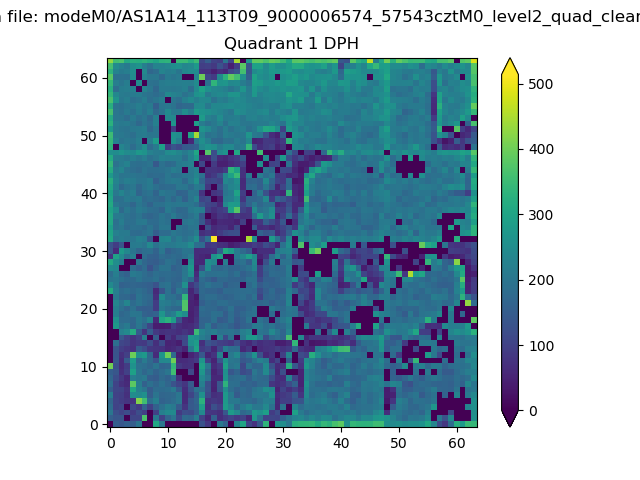 |
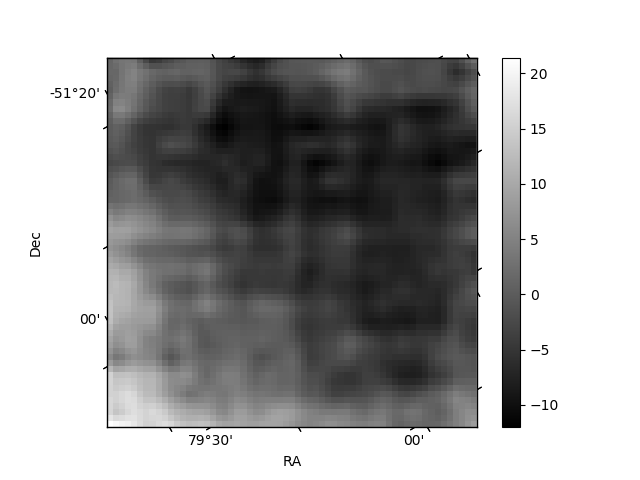
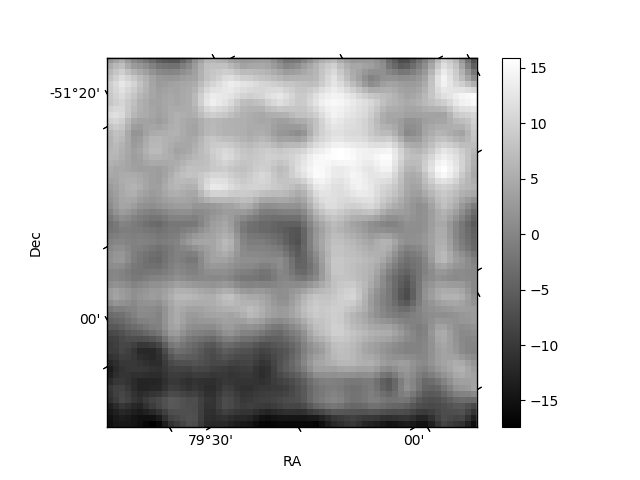
Quadrant B |
|---|---|---|---|
| Quadrant D | 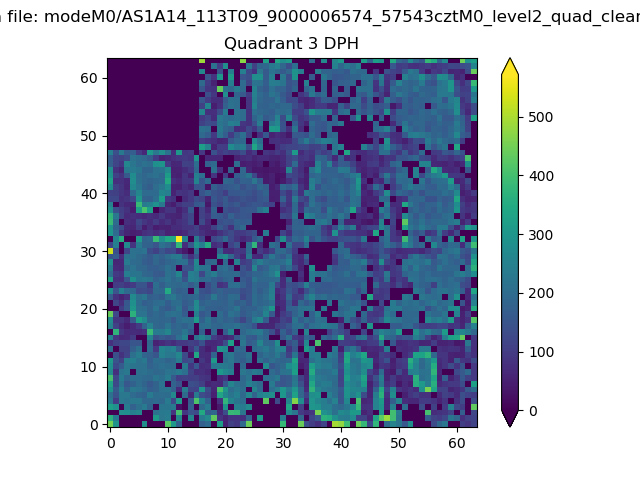 |
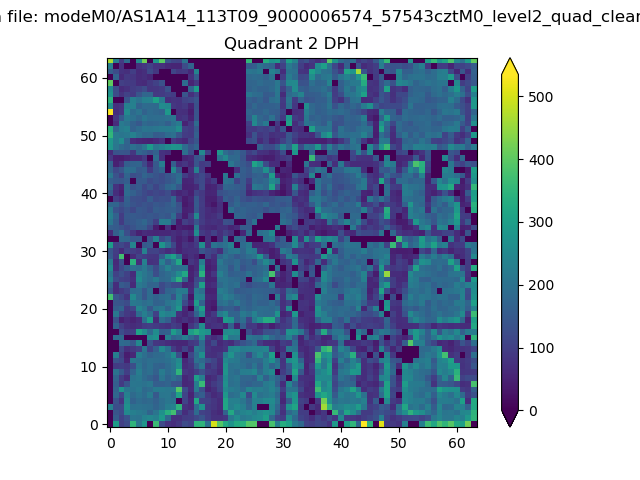 |
Quadrant C |
| Plot type | Count rate plots | Images |
|---|---|---|
| Comparison with Poisson distribution Blue bars denote a histogram of data divided into 1 sec bins. Red curve is a Poisson curve with rate = median count rate of data. |
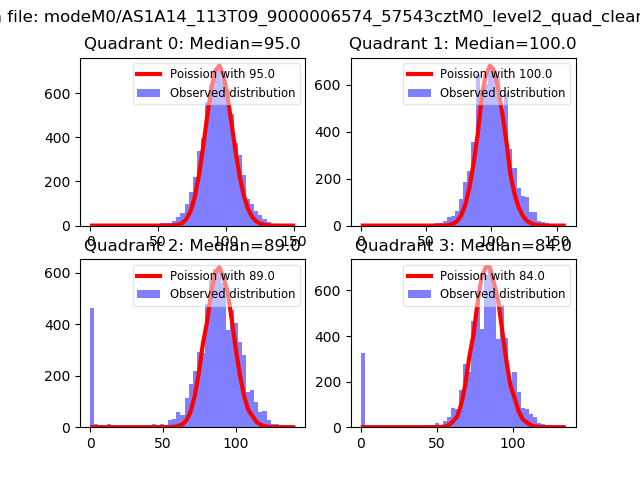 |
 |
| Quadrant-wise count rates Data is divided into 100 sec bins |
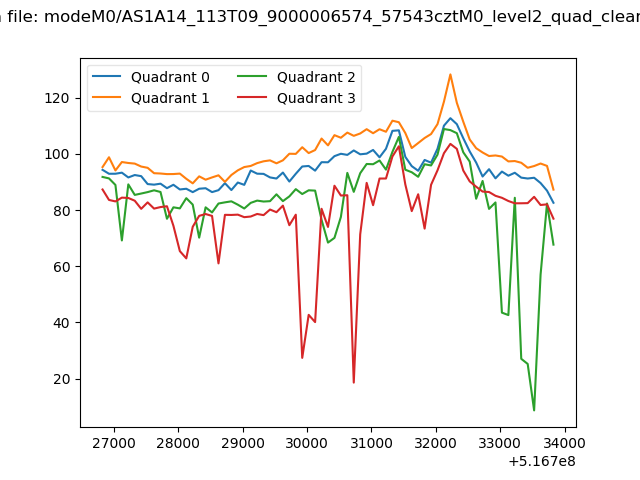 |
|
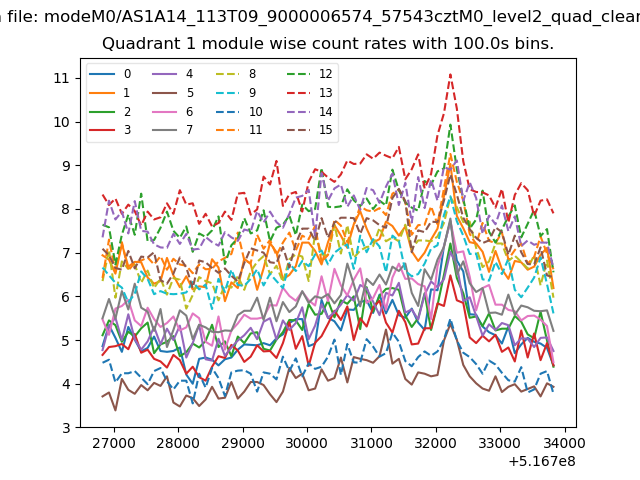
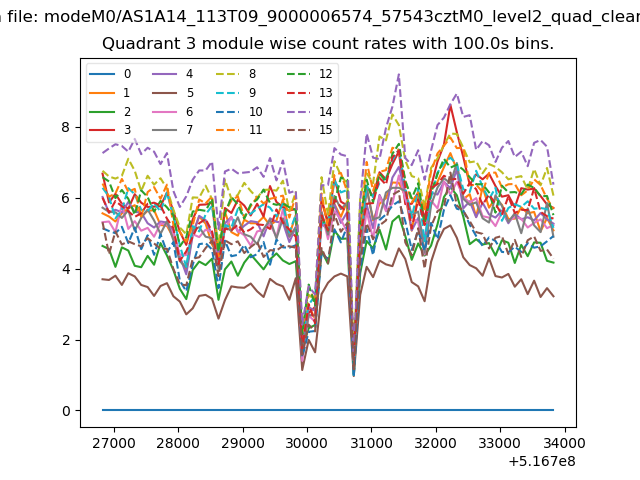
| Module-wise count rates for Quadrant A Data is divided into 100 sec bins |
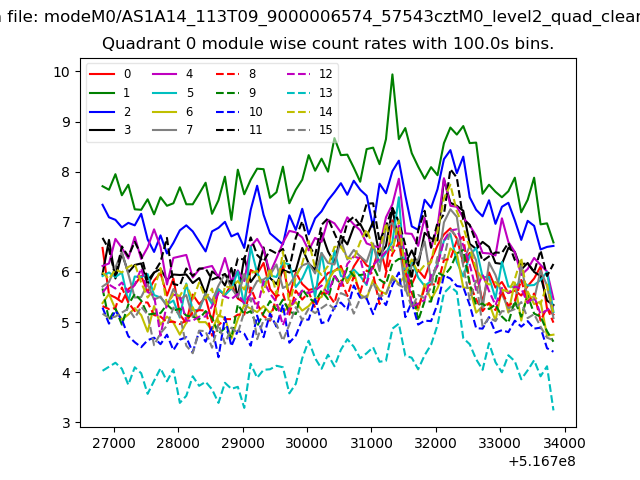 |
 |
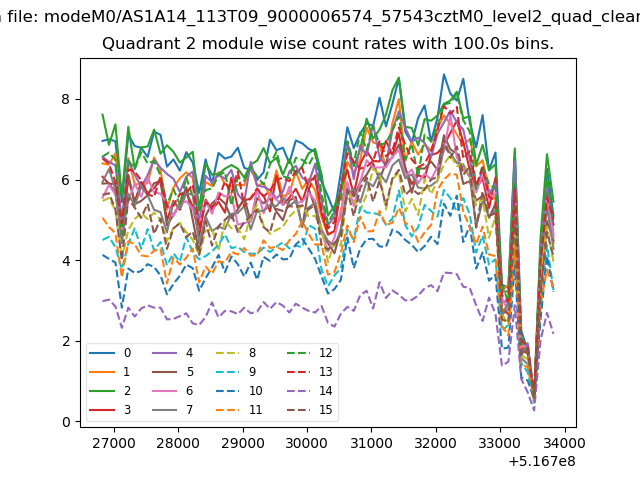
| Module-wise count rates for Quadrant B Data is divided into 100 sec bins |
 |
 |
| Module-wise count rates for Quadrant C Data is divided into 100 sec bins |
 |
 |
| Module-wise count rates for Quadrant D Data is divided into 100 sec bins |
 |
 |
| Parameter | Plot |
|---|---|
| CZT HV Monitor | 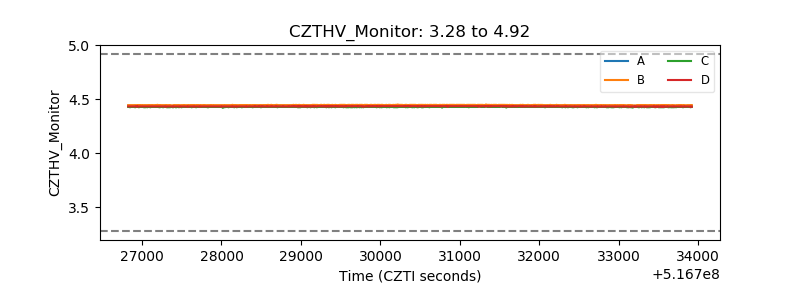 |
| D_VDD | 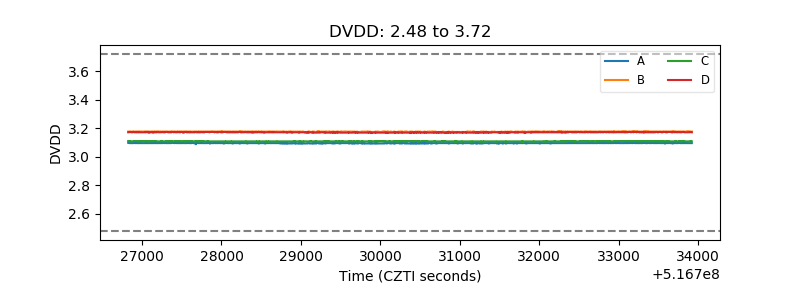 |
| Temperature 1 | 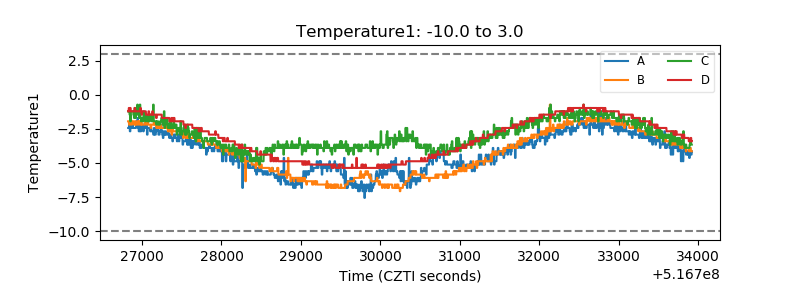 |
| Veto HV Monitor | 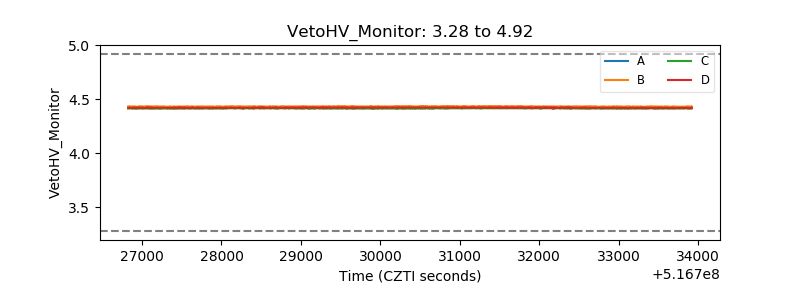 |
| Veto LLD | 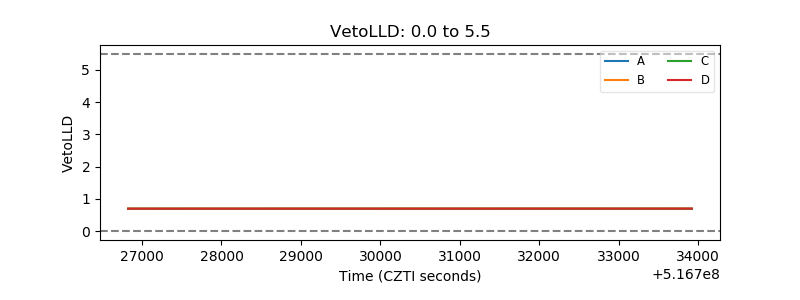 |
| Alpha Counter | 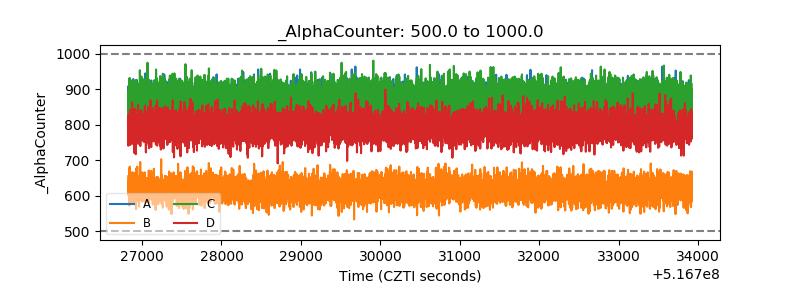 |
| _CPM_Rate | 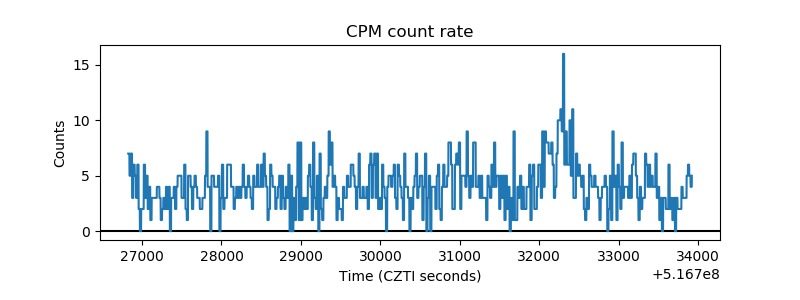 |
| CZT Counter | 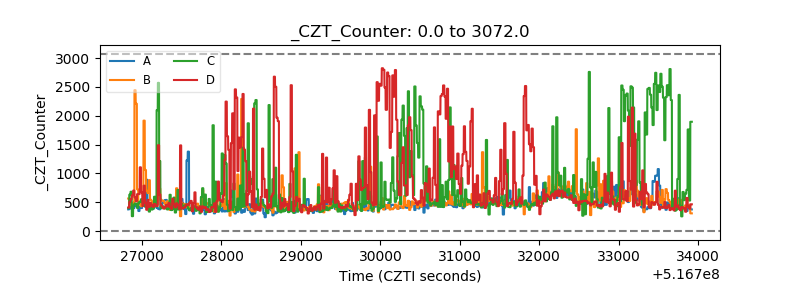 |
| +2.5 Volts monitor | 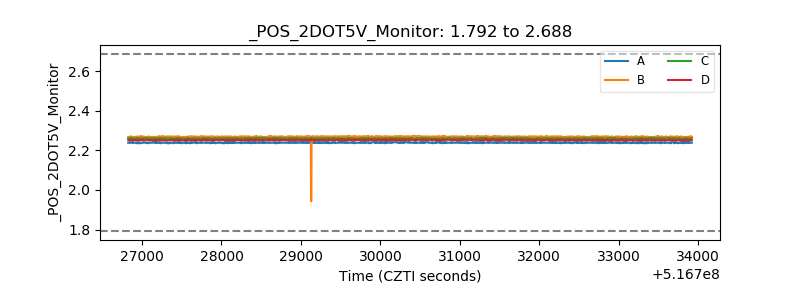 |
| +5 Volts monitor |  |
| _ROLL_ROT | 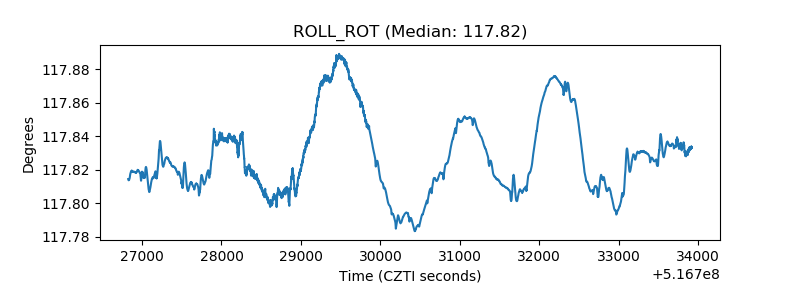 |
| _Roll_DEC | 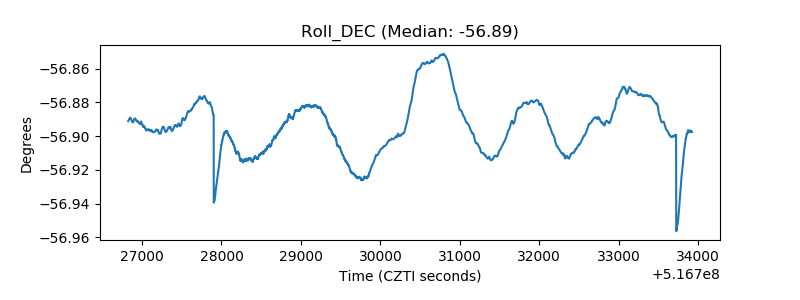 |
| _Roll_RA | 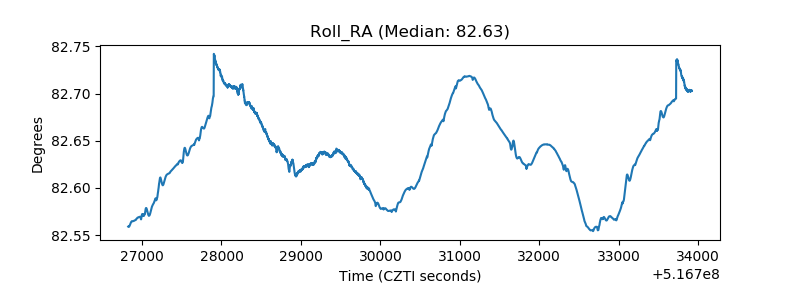 |
| Veto Counter | 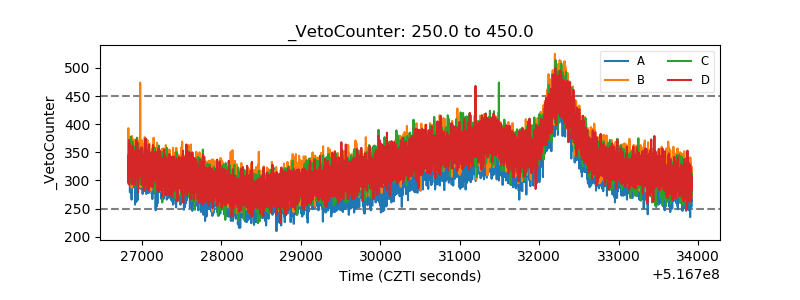 |