| Param | Original file | Final file |
|---|---|---|
| Filename | modeM0/AS1A14_113T09_9000006574_57544cztM0_level2.fits | modeM0/AS1A14_113T09_9000006574_57544cztM0_level2_quad_clean.evt |
| Size (bytes) | 528,382,080 | 105,272,640 |
| Size | 503.9 MB | 100.4 MB |
| Events in quadrant A | 3,518,477 | 701,807 |
| Events in quadrant B | 4,268,580 | 745,164 |
| Events in quadrant C | 5,676,938 | 620,287 |
| Events in quadrant D | 5,512,423 | 598,178 |
| Mode SS | |||
|---|---|---|---|
| Quadrant | BADHDUFLAG | Total packets | Discarded packets |
| A | 0 | 150 | 0 |
| B | 0 | 150 | 0 |
| C | 0 | 150 | 0 |
| D | 0 | 150 | 0 |
| Mode M0 | |||
|---|---|---|---|
| Quadrant | BADHDUFLAG | Total packets | Discarded packets |
| A | 0 | 16080 | 0 |
| B | 0 | 17782 | 0 |
| C | 0 | 22247 | 0 |
| D | 0 | 21628 | 0 |
| Quadrant | Total seconds | Saturated seconds | Saturation percentage |
|---|---|---|---|
| A | 7500 | 34 | 0.453333% |
| B | 7501 | 145 | 1.933076% |
| C | 7501 | 676 | 9.012132% |
| D | 7501 | 525 | 6.999067% |
Noise dominated data is calculated using 1-second bins in cleaned event files. If a bin has >2000 counts, and if more than 50% of those come from <1% of pixels, then it is considered to be noise-dominated and hence unusable.
| Quadrant | # 1 sec bins | Bins with >0 counts | Bins with >2000 counts | High rate bins dominated by noise | Noise dominated (total time) | Noise dominated (detector-on time) | Marked lightcurve |
|---|---|---|---|---|---|---|---|
| A | 7500 | 7500 | 24 | 24 | 0.32% | 0.32% | 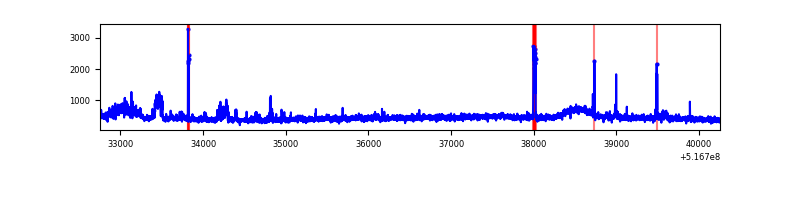 |
| B | 7501 | 7501 | 23 | 23 | 0.31% | 0.31% | 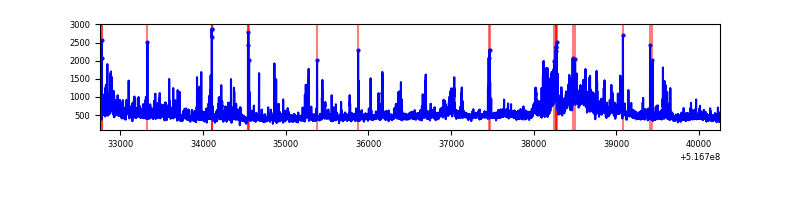 |
| C | 7501 | 7501 | 587 | 587 | 7.83% | 7.83% | 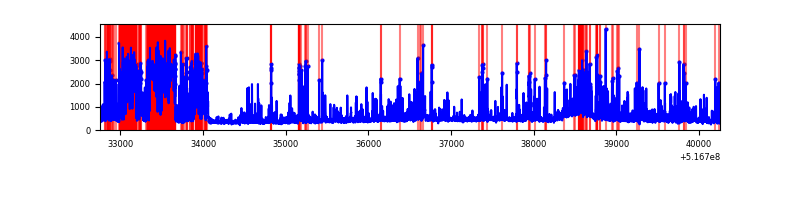 |
| D | 7501 | 7501 | 536 | 536 | 7.15% | 7.15% | 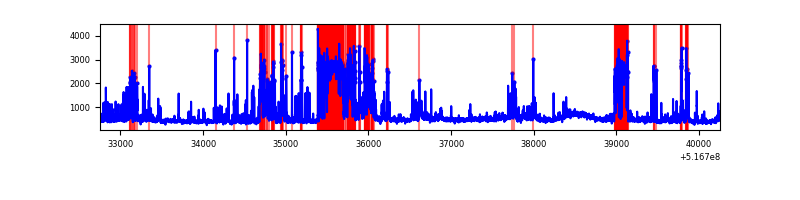 |
Top three noisy pixels from each quadrant. If the there are fewer than three noisy pixels in the level2.evt file, extra rows are filled as -1
| Pixel properties | Quadrant properties | ||||||
|---|---|---|---|---|---|---|---|
| Quadrant | DetID | PixID | Counts | Sigma | Mean | Median | Sigma |
| A | 3 | 14 | 239890 | 1206.8 | 804 | 783 | 198.1 |
| A | 4 | 249 | 72988 | 364.43 | 804 | 783 | 198.1 |
| A | 10 | 251 | 28078 | 137.76 | 804 | 783 | 198.1 |
| B | 4 | 206 | 520229 | 3015.91 | 793 | 763 | 172.2 |
| B | 5 | 185 | 189630 | 1096.52 | 793 | 763 | 172.2 |
| B | 4 | 201 | 97913 | 564.03 | 793 | 763 | 172.2 |
| C | 15 | 224 | 1299886 | 6345.45 | 749 | 740 | 204.7 |
| C | 6 | 223 | 1272685 | 6212.59 | 749 | 740 | 204.7 |
| C | 12 | 252 | 52146 | 251.08 | 749 | 740 | 204.7 |
| D | 15 | 142 | 1463216 | 6923.84 | 754 | 721 | 211.2 |
| D | 2 | 31 | 402911 | 1904.07 | 754 | 721 | 211.2 |
| D | 15 | 94 | 110947 | 521.84 | 754 | 721 | 211.2 |
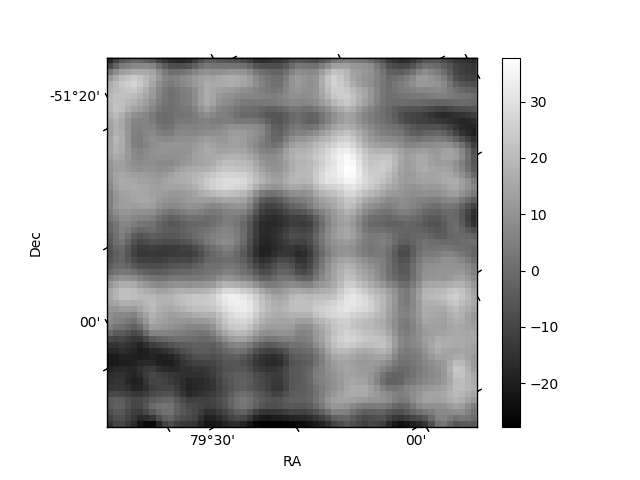
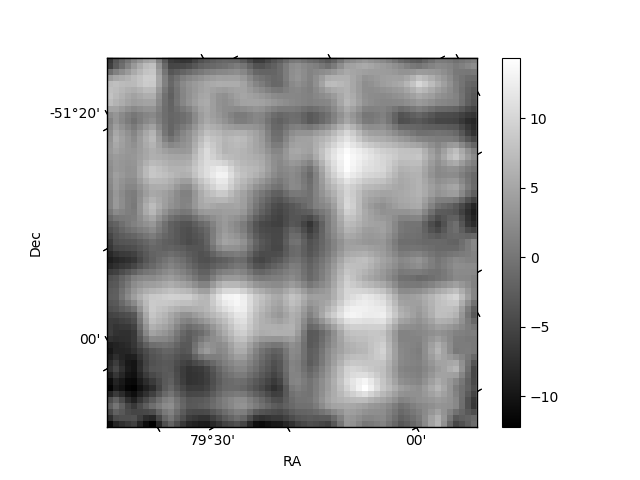
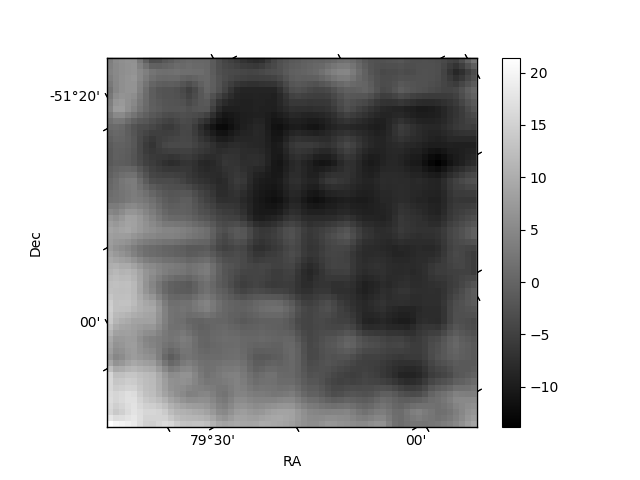
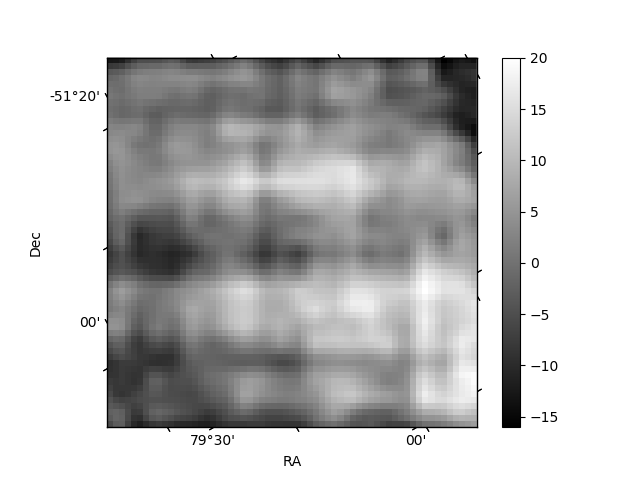
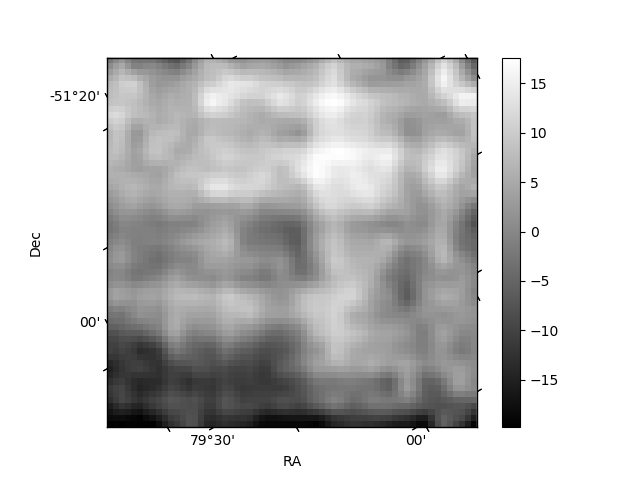
Histogram calculated using DETX and DETY for each event in the final _common_clean file
| Quadrant A | 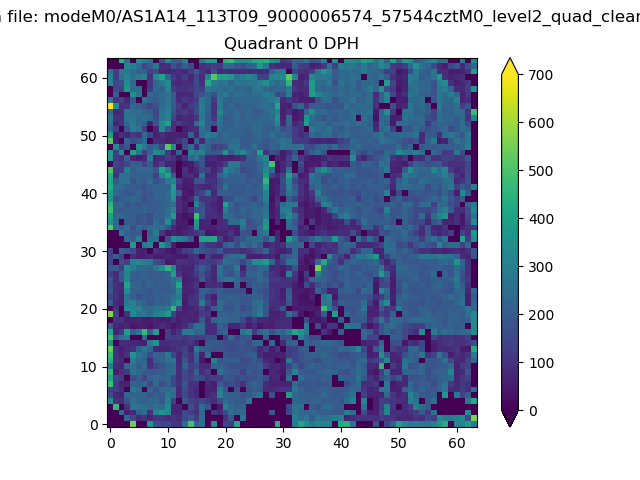 |
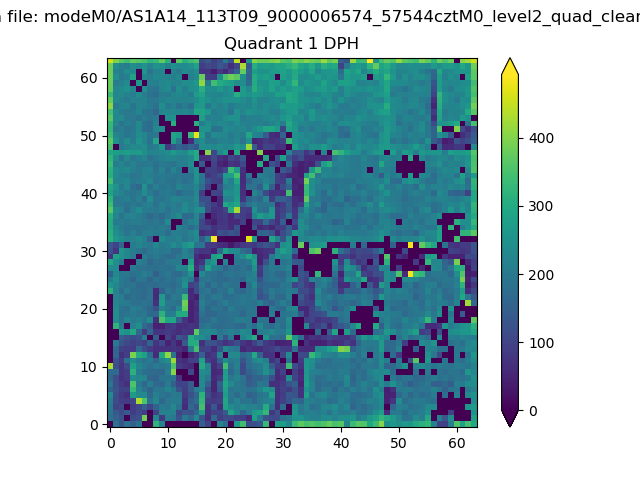 |
Quadrant B |
|---|---|---|---|
| Quadrant D | 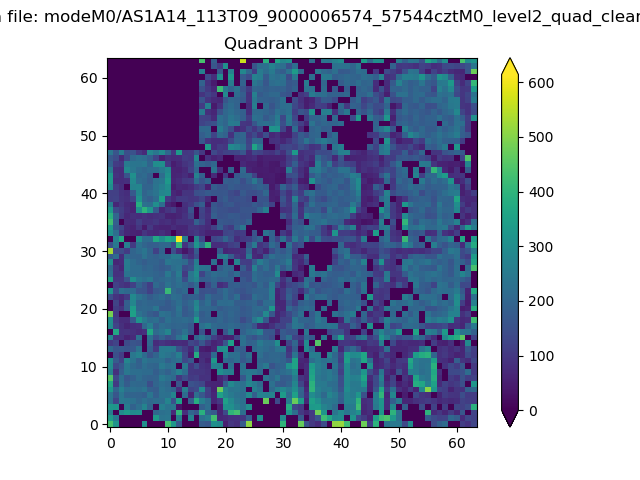 |
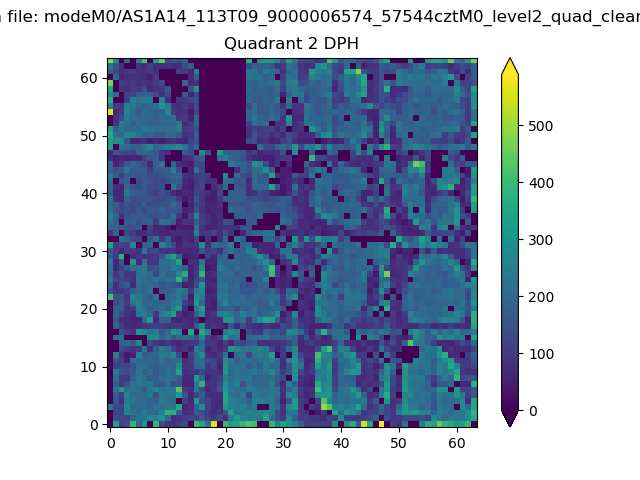 |
Quadrant C |
| Plot type | Count rate plots | Images |
|---|---|---|
| Comparison with Poisson distribution Blue bars denote a histogram of data divided into 1 sec bins. Red curve is a Poisson curve with rate = median count rate of data. |
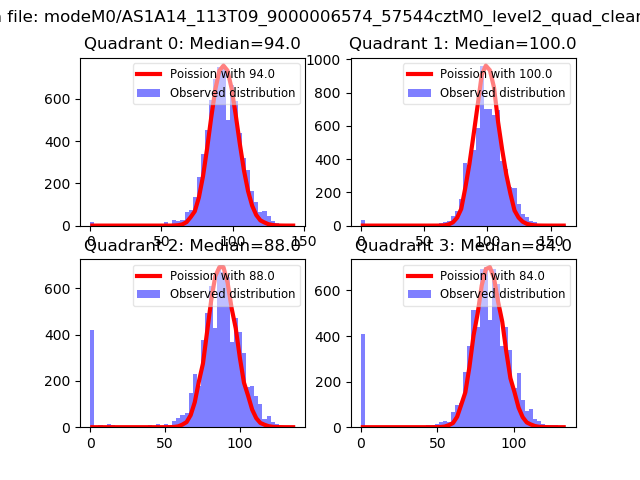 |
 |
| Quadrant-wise count rates Data is divided into 100 sec bins |
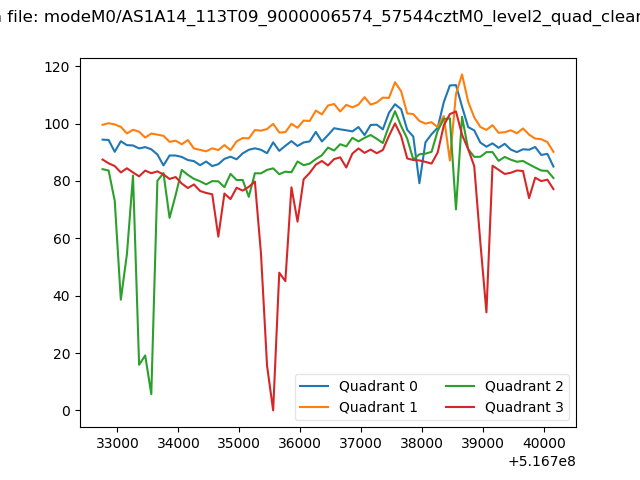 |
|
| Module-wise count rates for Quadrant A Data is divided into 100 sec bins |
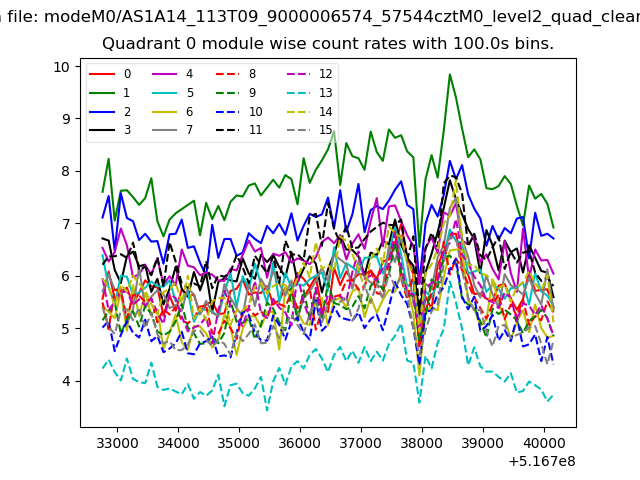 |
 |
| Module-wise count rates for Quadrant B Data is divided into 100 sec bins |
 |
 |
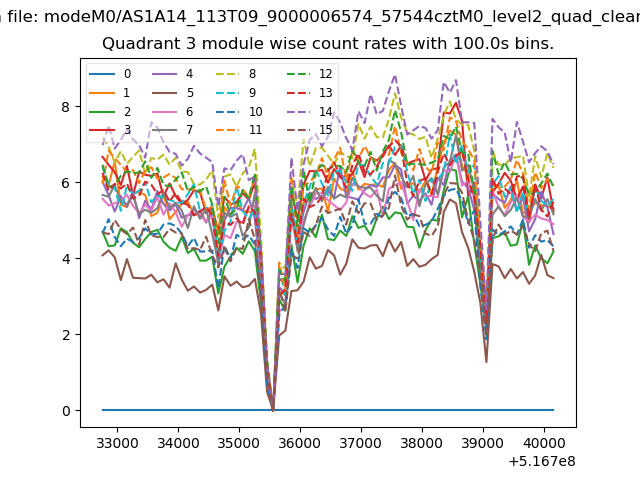
| Module-wise count rates for Quadrant C Data is divided into 100 sec bins |
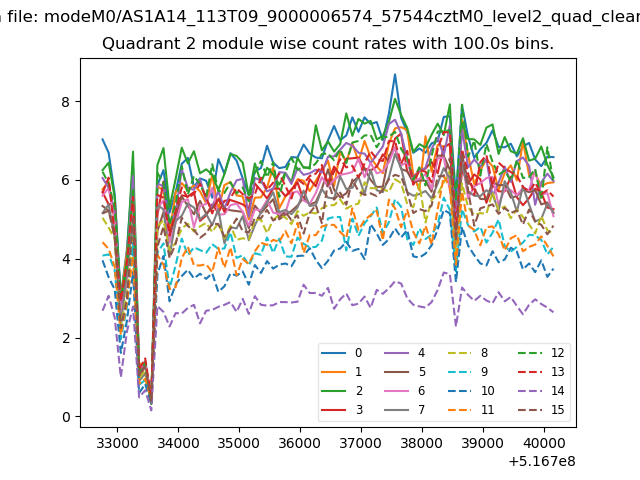 |
 |
| Module-wise count rates for Quadrant D Data is divided into 100 sec bins |
 |
 |
| Parameter | Plot |
|---|---|
| CZT HV Monitor |  |
| D_VDD | 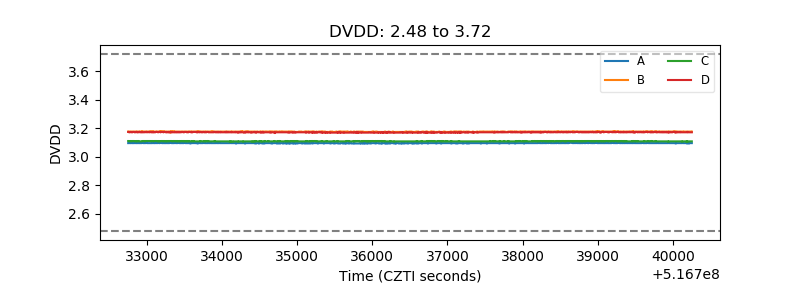 |
| Temperature 1 | 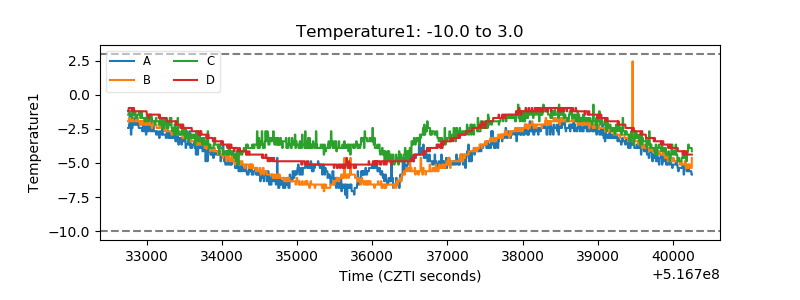 |
| Veto HV Monitor | 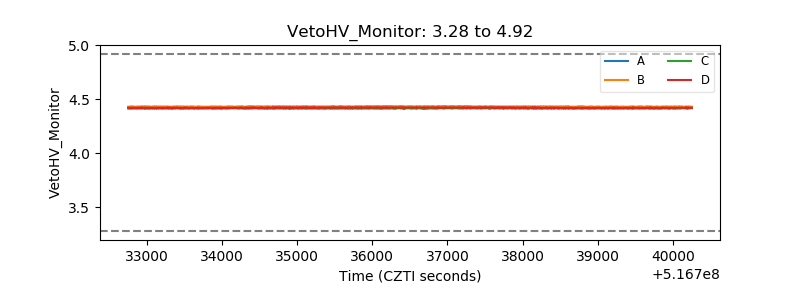 |
| Veto LLD | 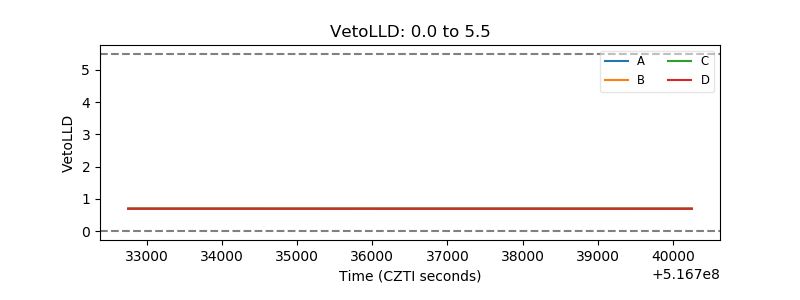 |
| Alpha Counter | 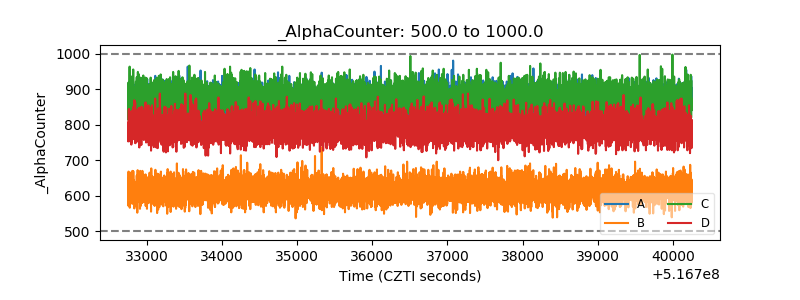 |
| _CPM_Rate | 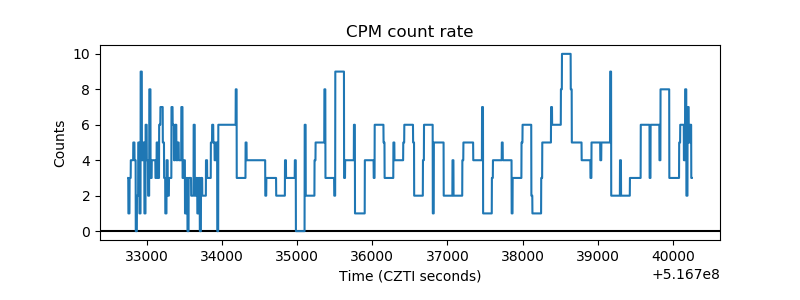 |
| CZT Counter | 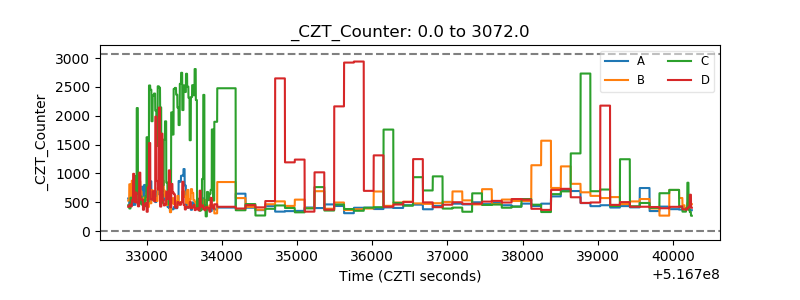 |
| +2.5 Volts monitor |  |
| +5 Volts monitor |  |
| _ROLL_ROT | 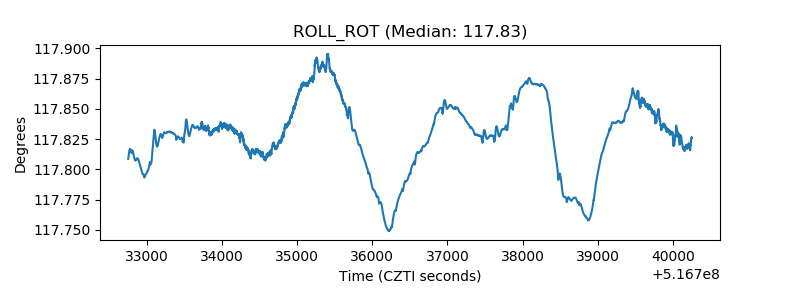 |
| _Roll_DEC | 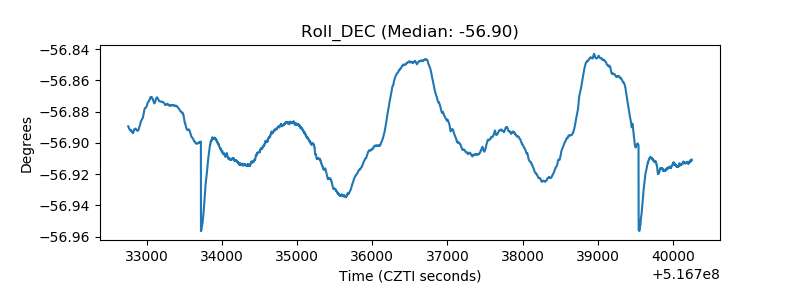 |
| _Roll_RA | 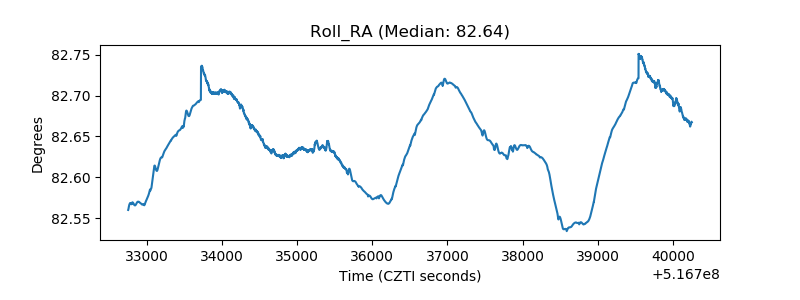 |
| Veto Counter | 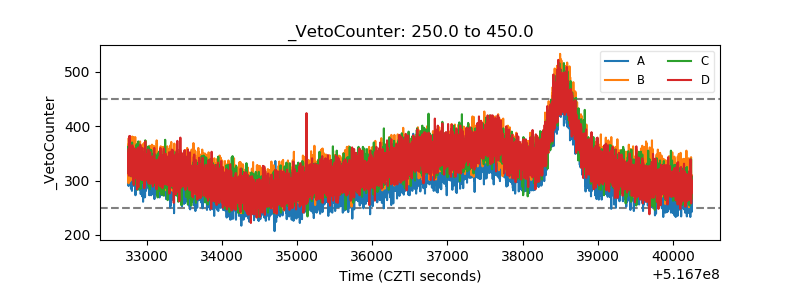 |