| Param | Original file | Final file |
|---|---|---|
| Filename | modeM0/AS1A14_113T09_9000006574_57547cztM0_level2.fits | modeM0/AS1A14_113T09_9000006574_57547cztM0_level2_quad_clean.evt |
| Size (bytes) | 1,308,093,120 | 221,080,320 |
| Size | 1.2 GB | 210.8 MB |
| Events in quadrant A | 8,878,421 | 1,431,806 |
| Events in quadrant B | 9,615,811 | 1,462,469 |
| Events in quadrant C | 15,571,826 | 1,264,065 |
| Events in quadrant D | 12,873,917 | 1,215,111 |
| Mode SS | |||
|---|---|---|---|
| Quadrant | BADHDUFLAG | Total packets | Discarded packets |
| A | 0 | 390 | 0 |
| B | 0 | 390 | 0 |
| C | 0 | 390 | 0 |
| D | 0 | 390 | 0 |
| Mode M9 | |||
|---|---|---|---|
| Quadrant | BADHDUFLAG | Total packets | Discarded packets |
| A | 0 | 13 | 0 |
| B | 0 | 13 | 0 |
| C | 0 | 13 | 0 |
| D | 0 | 13 | 0 |
| Mode M0 | |||
|---|---|---|---|
| Quadrant | BADHDUFLAG | Total packets | Discarded packets |
| A | 0 | 40609 | 3 |
| B | 0 | 42145 | 3 |
| C | 0 | 59769 | 3 |
| D | 0 | 51597 | 5 |
| Quadrant | Total seconds | Saturated seconds | Saturation percentage |
|---|---|---|---|
| A | 19135 | 227 | 1.186308% |
| B | 19135 | 352 | 1.839561% |
| C | 19135 | 1919 | 10.028743% |
| D | 19134 | 1123 | 5.869133% |
Noise dominated data is calculated using 1-second bins in cleaned event files. If a bin has >2000 counts, and if more than 50% of those come from <1% of pixels, then it is considered to be noise-dominated and hence unusable.
| Quadrant | # 1 sec bins | Bins with >0 counts | Bins with >2000 counts | High rate bins dominated by noise | Noise dominated (total time) | Noise dominated (detector-on time) | Marked lightcurve |
|---|---|---|---|---|---|---|---|
| A | 20748 | 19419 | 84 | 84 | 0.40% | 0.43% | 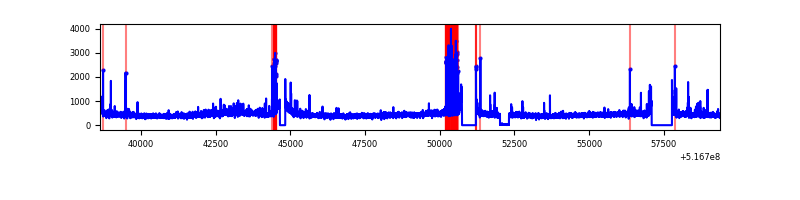 |
| B | 20748 | 19419 | 82 | 82 | 0.40% | 0.42% | 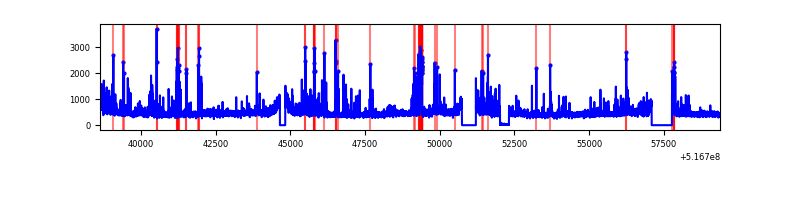 |
| C | 20748 | 19419 | 1526 | 1526 | 7.35% | 7.86% | 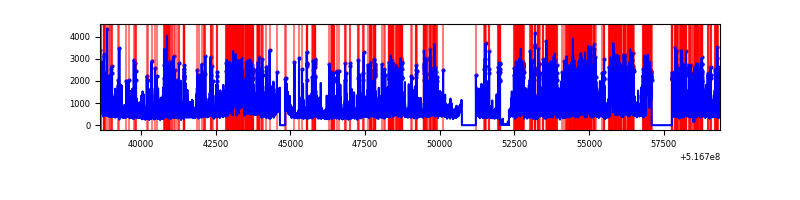 |
| D | 20746 | 19419 | 1089 | 1089 | 5.25% | 5.61% | 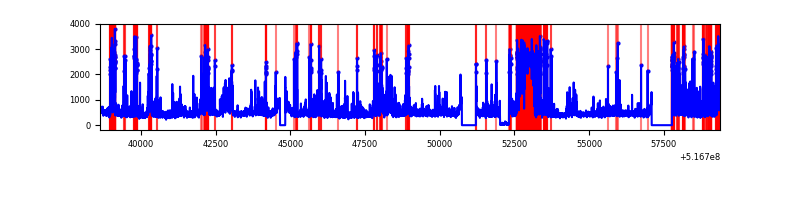 |
Top three noisy pixels from each quadrant. If the there are fewer than three noisy pixels in the level2.evt file, extra rows are filled as -1
| Pixel properties | Quadrant properties | ||||||
|---|---|---|---|---|---|---|---|
| Quadrant | DetID | PixID | Counts | Sigma | Mean | Median | Sigma |
| A | 10 | 251 | 525450 | 1026.22 | 2055 | 1999 | 510.1 |
| A | 3 | 14 | 234562 | 455.94 | 2055 | 1999 | 510.1 |
| A | 4 | 159 | 60021 | 113.75 | 2055 | 1999 | 510.1 |
| B | 4 | 206 | 692215 | 1575.08 | 2030 | 1946 | 438.2 |
| B | 4 | 201 | 167334 | 377.39 | 2030 | 1946 | 438.2 |
| B | 5 | 185 | 148126 | 333.56 | 2030 | 1946 | 438.2 |
| C | 12 | 254 | 3731932 | 7243.24 | 1905 | 1889 | 515.0 |
| C | 15 | 224 | 2460026 | 4773.37 | 1905 | 1889 | 515.0 |
| C | 10 | 22 | 727202 | 1408.46 | 1905 | 1889 | 515.0 |
| D | 15 | 142 | 3361823 | 6183.9 | 1939 | 1849 | 543.3 |
| D | 2 | 31 | 416743 | 763.6 | 1939 | 1849 | 543.3 |
| D | 15 | 94 | 373207 | 683.47 | 1939 | 1849 | 543.3 |
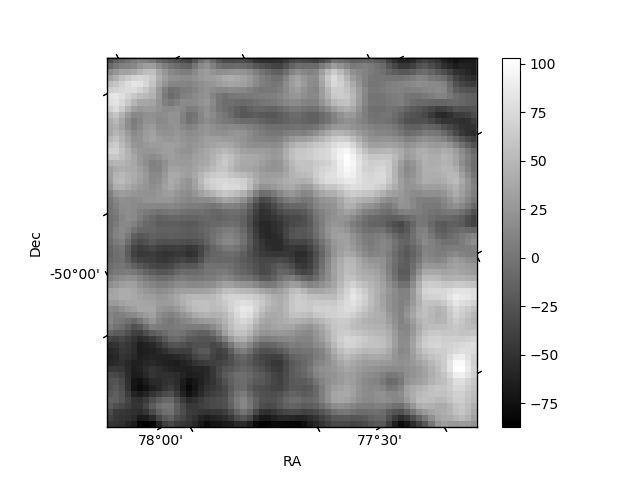
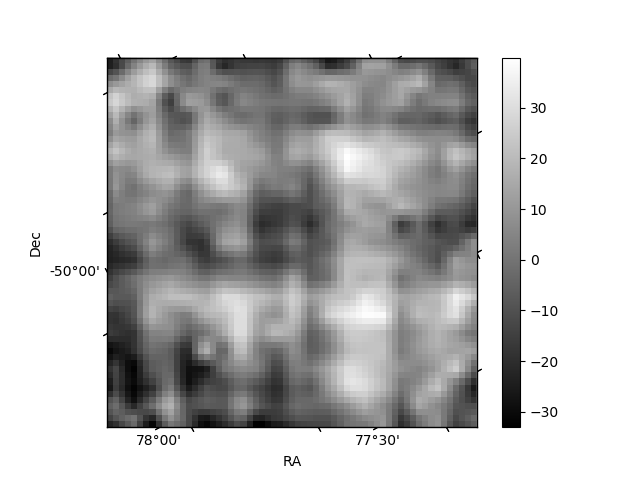
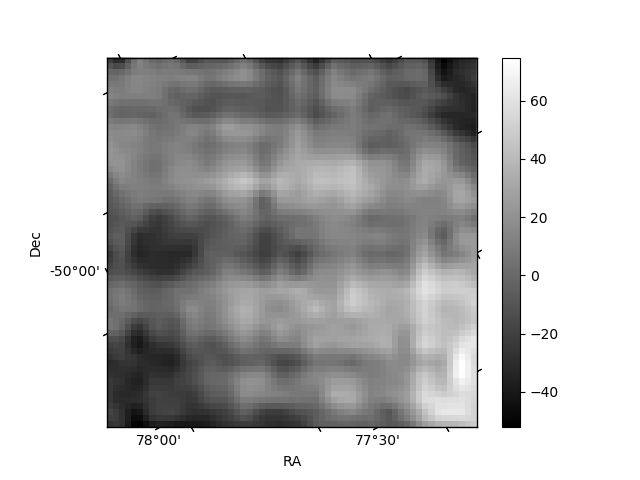
Histogram calculated using DETX and DETY for each event in the final _common_clean file
| Quadrant A | 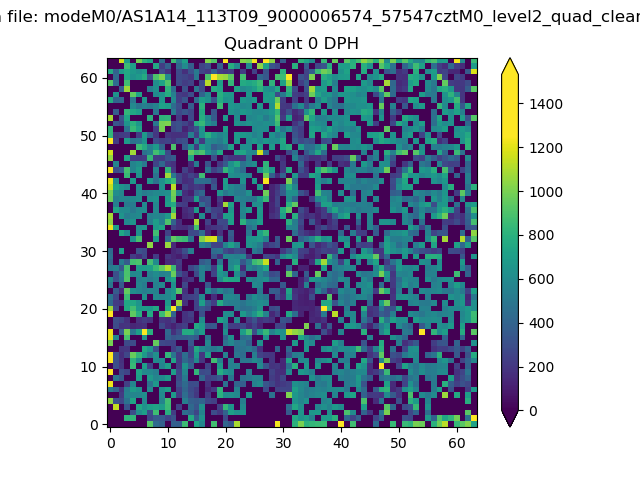 |
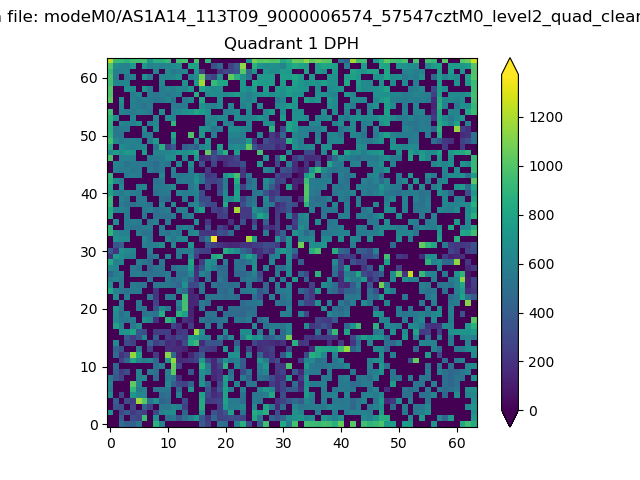 |
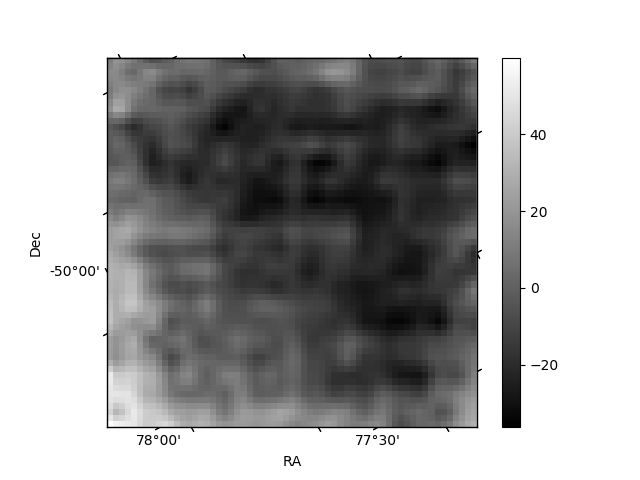
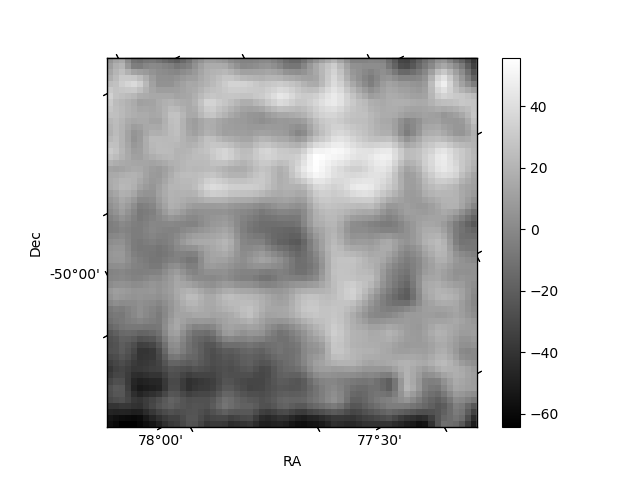
Quadrant B |
|---|---|---|---|
| Quadrant D | 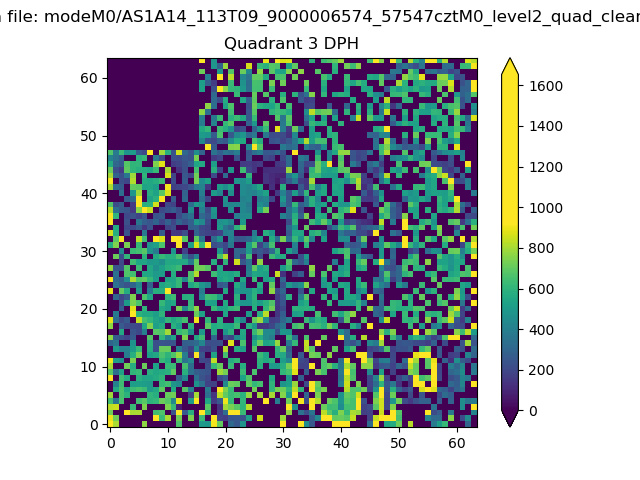 |
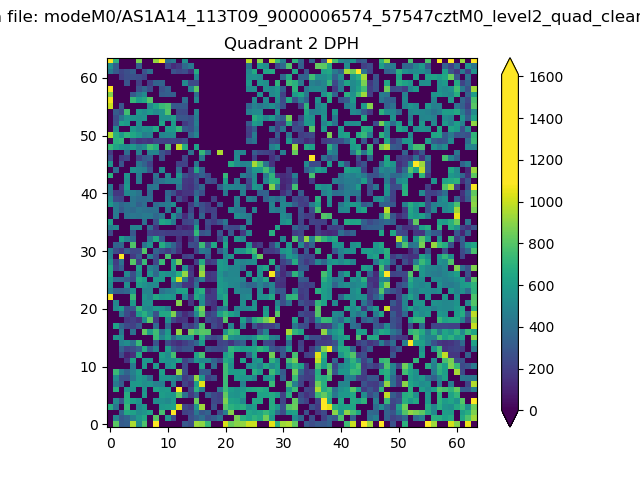 |
Quadrant C |
| Plot type | Count rate plots | Images |
|---|---|---|
| Comparison with Poisson distribution Blue bars denote a histogram of data divided into 1 sec bins. Red curve is a Poisson curve with rate = median count rate of data. |
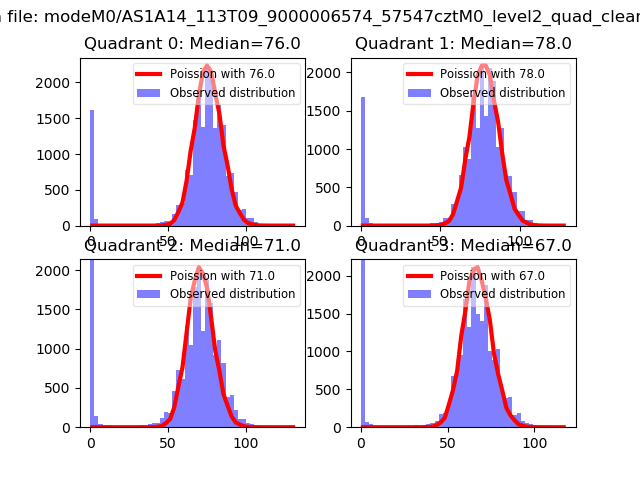 |
 |
| Quadrant-wise count rates Data is divided into 100 sec bins |
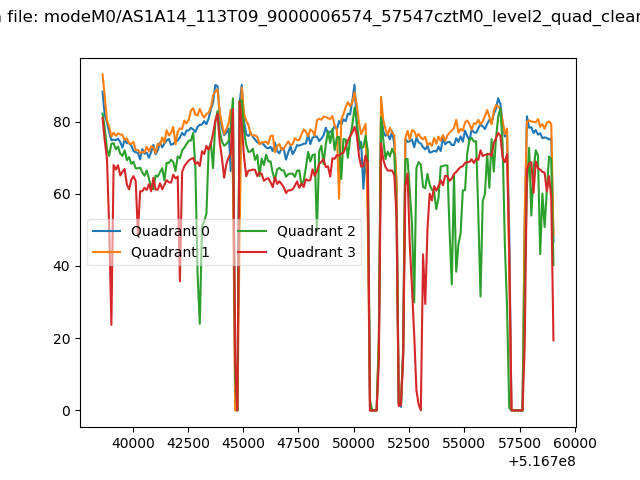 |
|
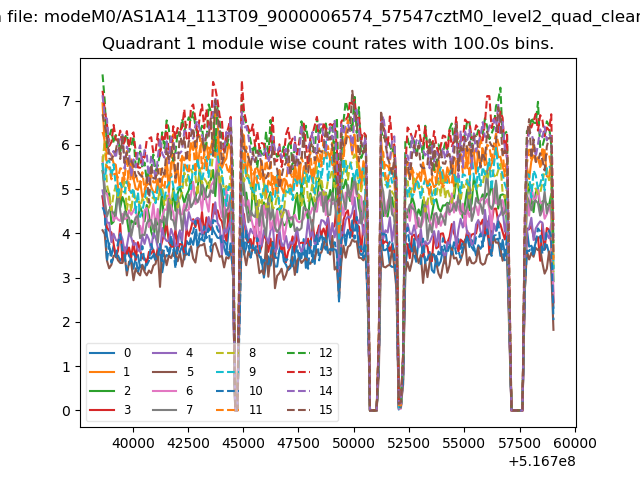
| Module-wise count rates for Quadrant A Data is divided into 100 sec bins |
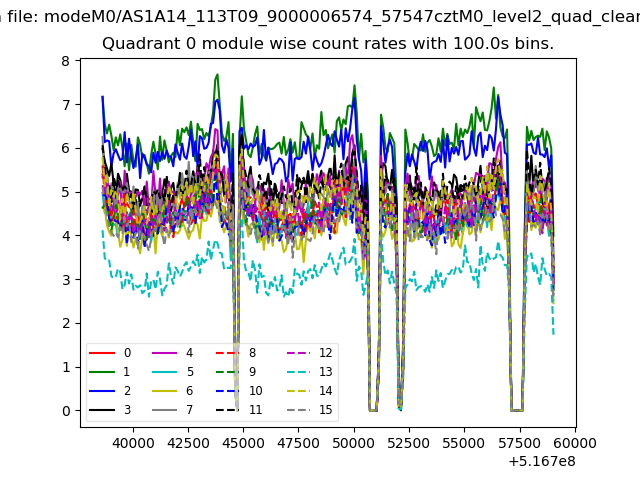 |
 |
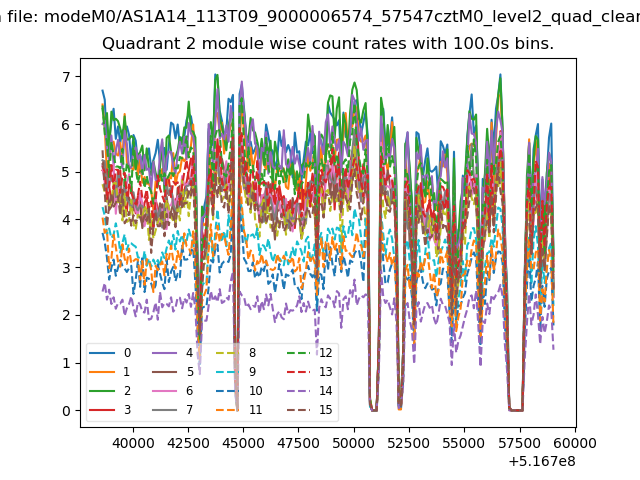
| Module-wise count rates for Quadrant B Data is divided into 100 sec bins |
 |
 |
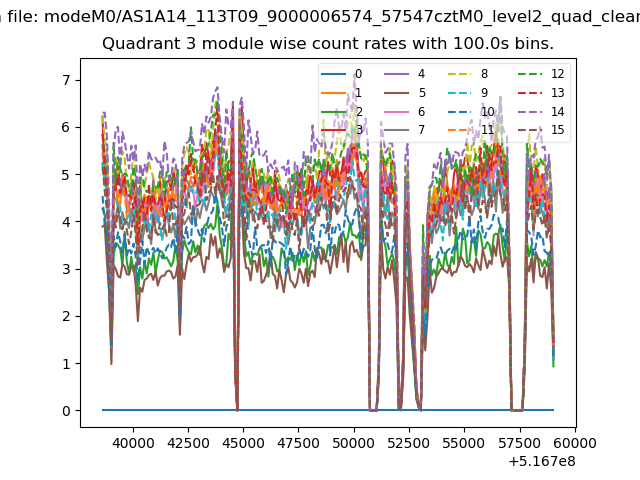
| Module-wise count rates for Quadrant C Data is divided into 100 sec bins |
 |
 |
| Module-wise count rates for Quadrant D Data is divided into 100 sec bins |
 |
 |
| Parameter | Plot |
|---|---|
| CZT HV Monitor | 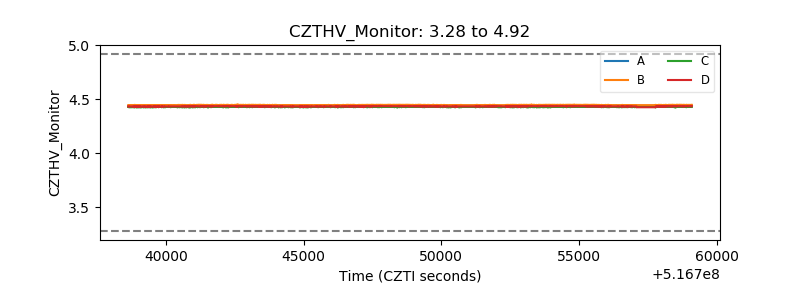 |
| D_VDD | 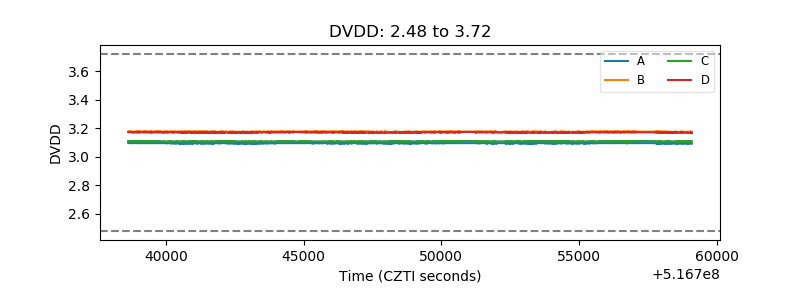 |
| Temperature 1 | 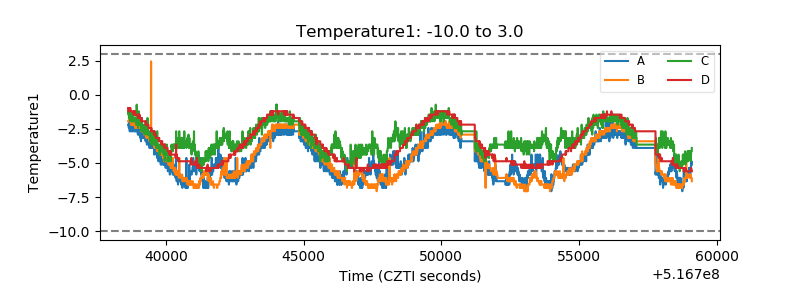 |
| Veto HV Monitor | 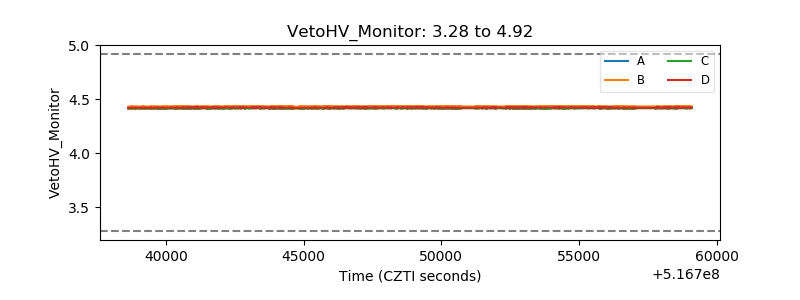 |
| Veto LLD | 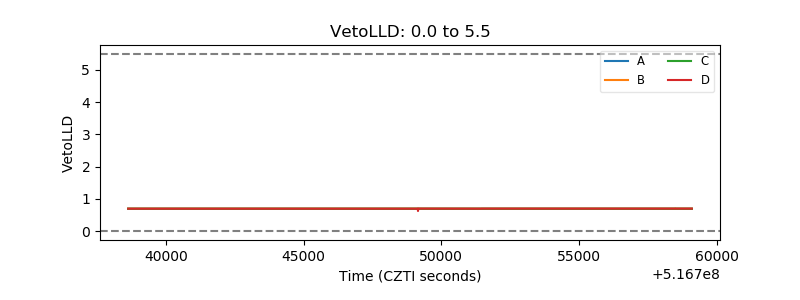 |
| Alpha Counter | 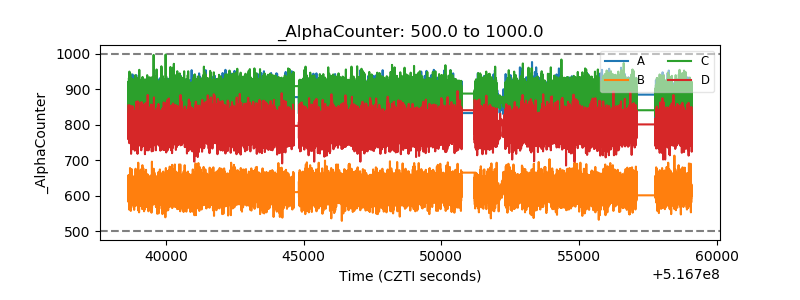 |
| _CPM_Rate | 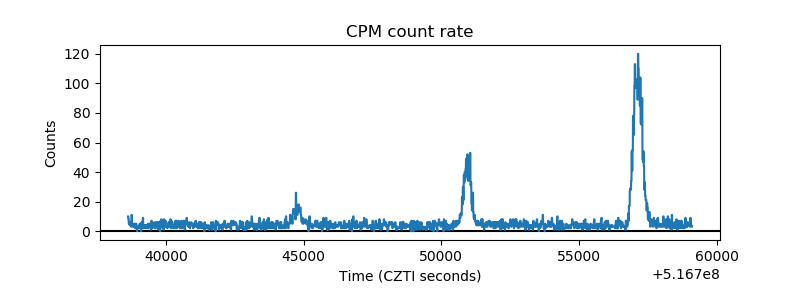 |
| CZT Counter | 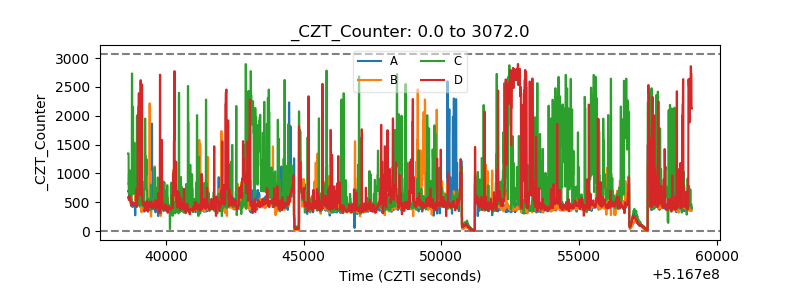 |
| +2.5 Volts monitor | 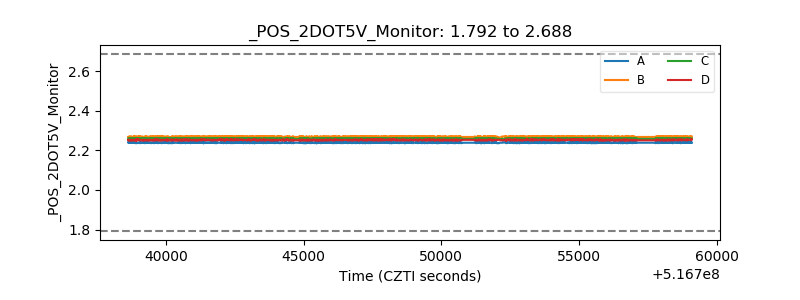 |
| +5 Volts monitor | 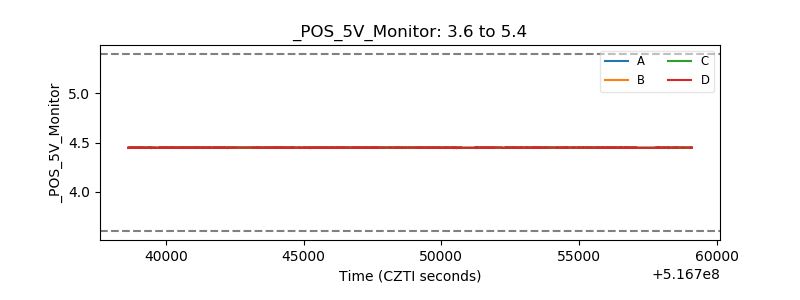 |
| _ROLL_ROT | 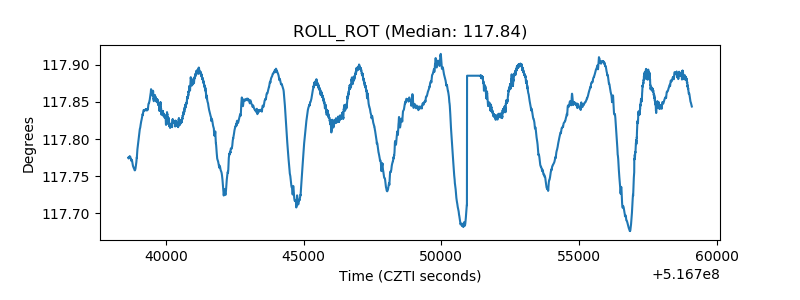 |
| _Roll_DEC | 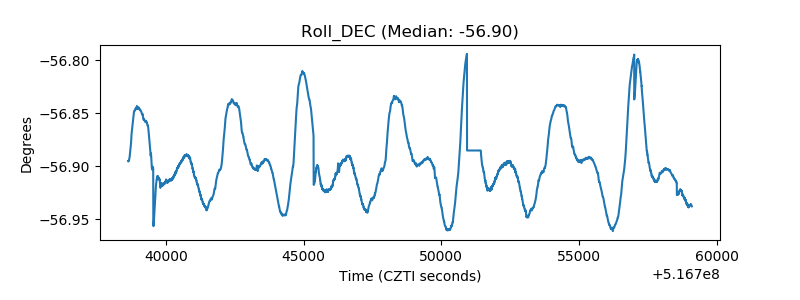 |
| _Roll_RA | 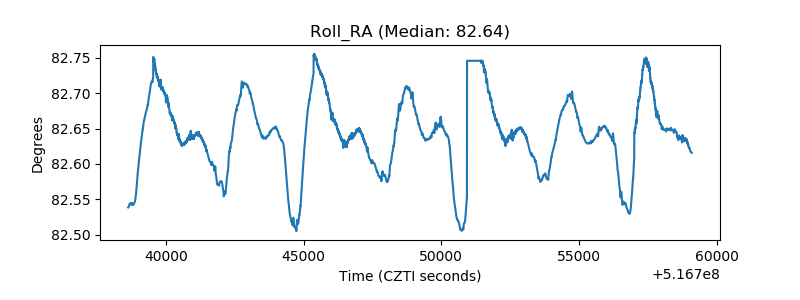 |
| Veto Counter | 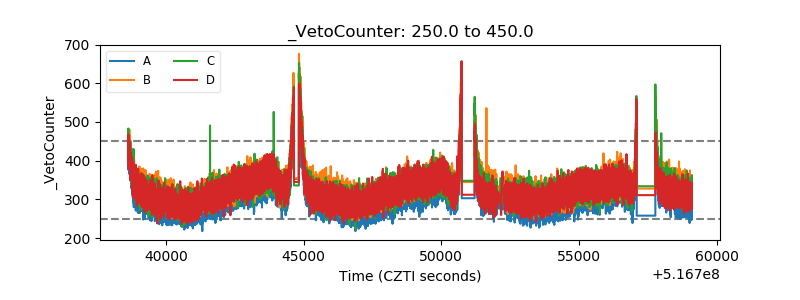 |