| Param | Original file | Final file |
|---|---|---|
| Filename | modeM0/AS1A14_113T09_9000006574_57548cztM0_level2.fits | modeM0/AS1A14_113T09_9000006574_57548cztM0_level2_quad_clean.evt |
| Size (bytes) | 496,584,000 | 88,269,120 |
| Size | 473.6 MB | 84.2 MB |
| Events in quadrant A | 3,312,235 | 580,493 |
| Events in quadrant B | 3,549,252 | 612,486 |
| Events in quadrant C | 5,392,276 | 501,413 |
| Events in quadrant D | 5,580,365 | 487,285 |
| Mode SS | |||
|---|---|---|---|
| Quadrant | BADHDUFLAG | Total packets | Discarded packets |
| A | 0 | 144 | 0 |
| B | 0 | 144 | 0 |
| C | 0 | 144 | 0 |
| D | 0 | 144 | 0 |
| Mode M9 | |||
|---|---|---|---|
| Quadrant | BADHDUFLAG | Total packets | Discarded packets |
| A | 0 | 16 | 0 |
| B | 0 | 16 | 0 |
| C | 0 | 16 | 0 |
| D | 0 | 16 | 0 |
| Mode M0 | |||
|---|---|---|---|
| Quadrant | BADHDUFLAG | Total packets | Discarded packets |
| A | 0 | 14913 | 2 |
| B | 0 | 15525 | 2 |
| C | 0 | 20871 | 2 |
| D | 0 | 21466 | 2 |
| Quadrant | Total seconds | Saturated seconds | Saturation percentage |
|---|---|---|---|
| A | 7048 | 66 | 0.936436% |
| B | 7048 | 112 | 1.589103% |
| C | 7048 | 611 | 8.669126% |
| D | 7048 | 646 | 9.165721% |
Noise dominated data is calculated using 1-second bins in cleaned event files. If a bin has >2000 counts, and if more than 50% of those come from <1% of pixels, then it is considered to be noise-dominated and hence unusable.
| Quadrant | # 1 sec bins | Bins with >0 counts | Bins with >2000 counts | High rate bins dominated by noise | Noise dominated (total time) | Noise dominated (detector-on time) | Marked lightcurve |
|---|---|---|---|---|---|---|---|
| A | 8841 | 7331 | 21 | 21 | 0.24% | 0.29% | 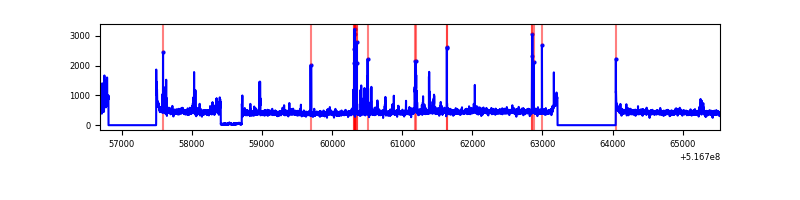 |
| B | 8841 | 7331 | 21 | 21 | 0.24% | 0.29% | 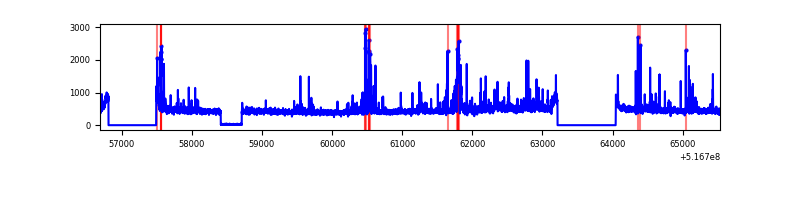 |
| C | 8841 | 7327 | 460 | 460 | 5.20% | 6.28% | 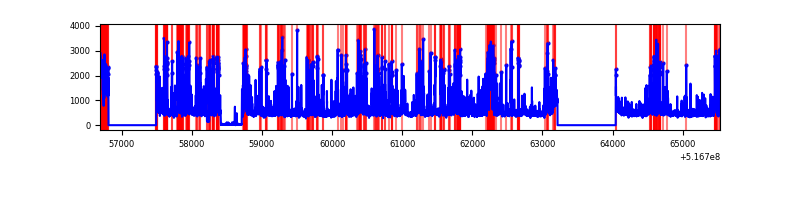 |
| D | 8841 | 7332 | 624 | 624 | 7.06% | 8.51% | 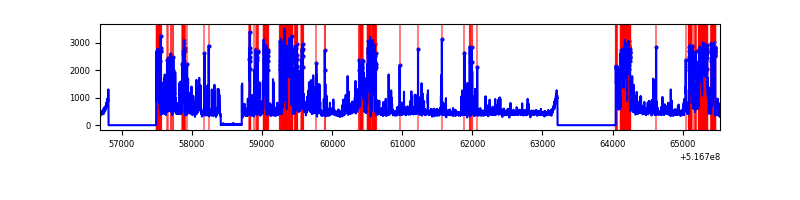 |
Top three noisy pixels from each quadrant. If the there are fewer than three noisy pixels in the level2.evt file, extra rows are filled as -1
| Pixel properties | Quadrant properties | ||||||
|---|---|---|---|---|---|---|---|
| Quadrant | DetID | PixID | Counts | Sigma | Mean | Median | Sigma |
| A | 10 | 251 | 171723 | 908.92 | 760 | 742 | 188.1 |
| A | 4 | 249 | 112934 | 596.4 | 760 | 742 | 188.1 |
| A | 3 | 14 | 43581 | 227.73 | 760 | 742 | 188.1 |
| B | 4 | 142 | 153352 | 936.66 | 753 | 725 | 162.9 |
| B | 4 | 206 | 111095 | 677.33 | 753 | 725 | 162.9 |
| B | 9 | 251 | 69364 | 421.23 | 753 | 725 | 162.9 |
| C | 15 | 224 | 1341816 | 6979.53 | 711 | 703 | 192.1 |
| C | 12 | 254 | 1101802 | 5730.43 | 711 | 703 | 192.1 |
| C | 12 | 252 | 68646 | 353.59 | 711 | 703 | 192.1 |
| D | 15 | 142 | 1674063 | 8435.02 | 708 | 677 | 198.4 |
| D | 2 | 31 | 406555 | 2045.91 | 708 | 677 | 198.4 |
| D | 15 | 94 | 264486 | 1329.78 | 708 | 677 | 198.4 |
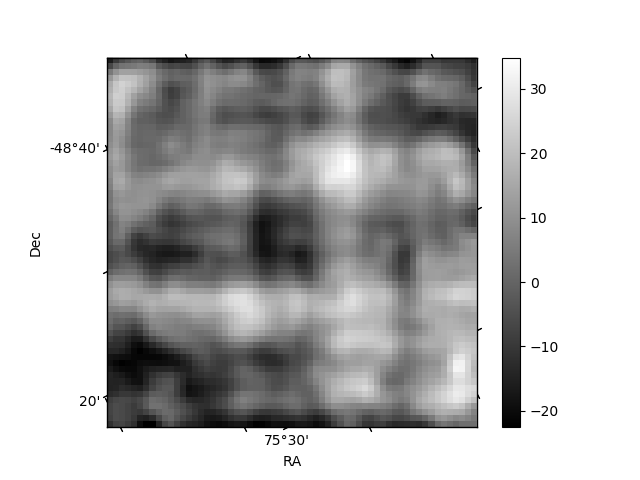
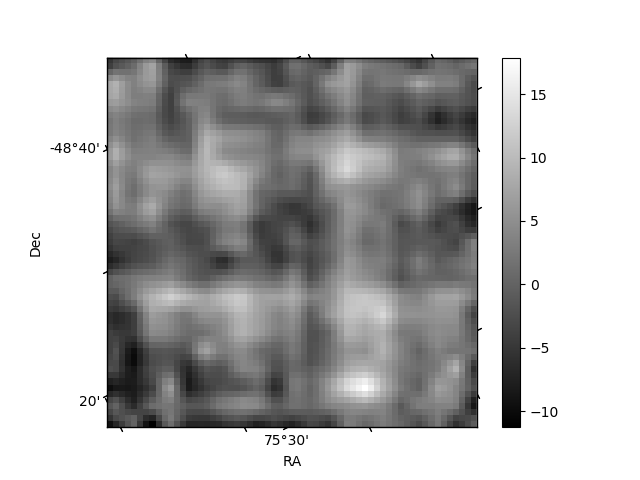
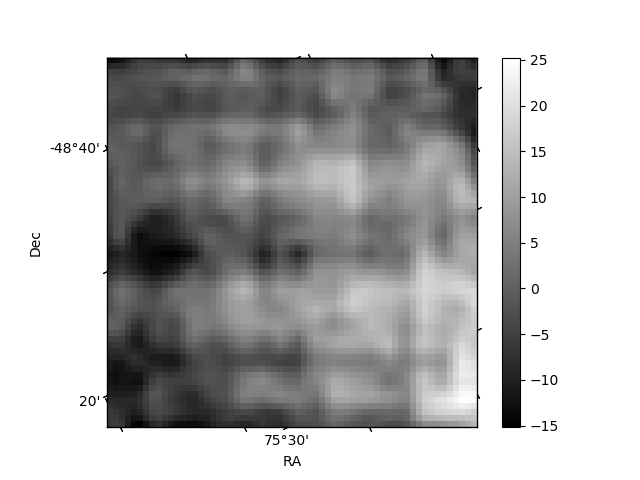
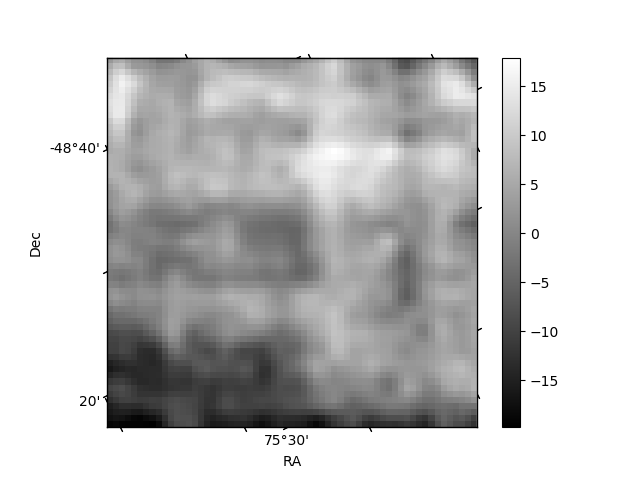
Histogram calculated using DETX and DETY for each event in the final _common_clean file
| Quadrant A | 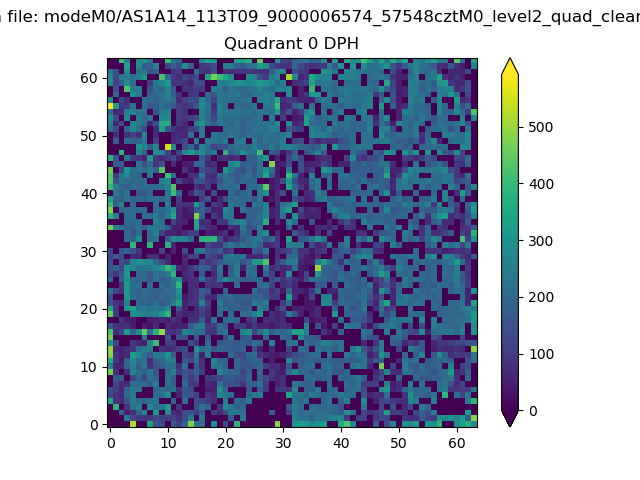 |
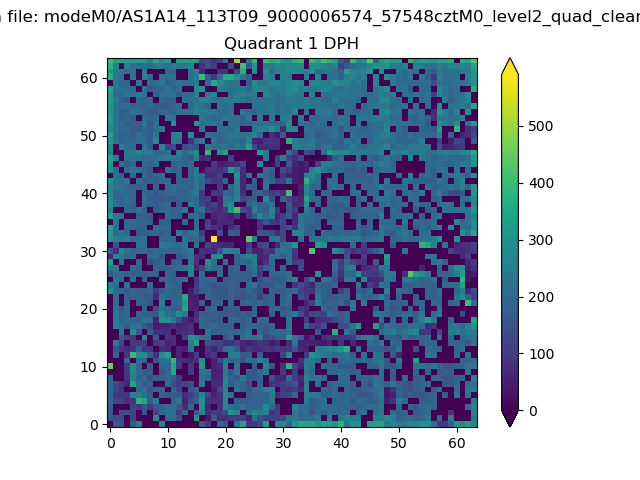 |
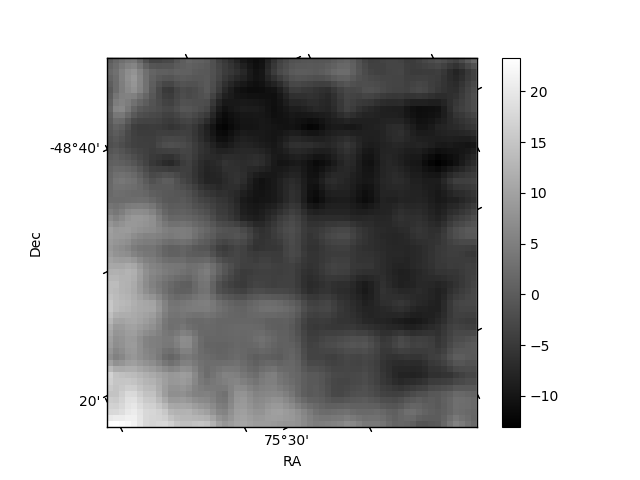
Quadrant B |
|---|---|---|---|
| Quadrant D | 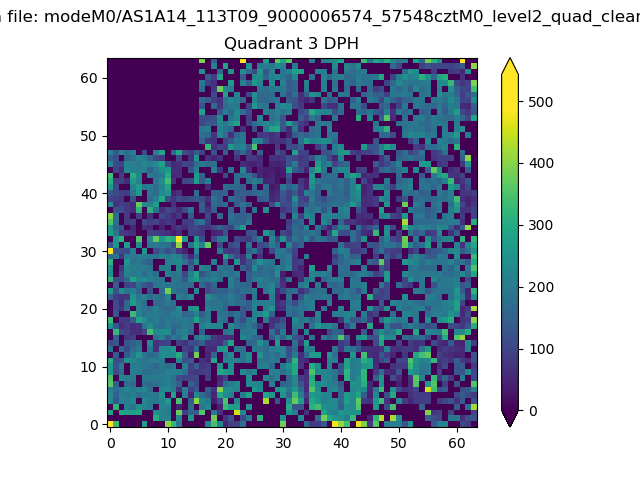 |
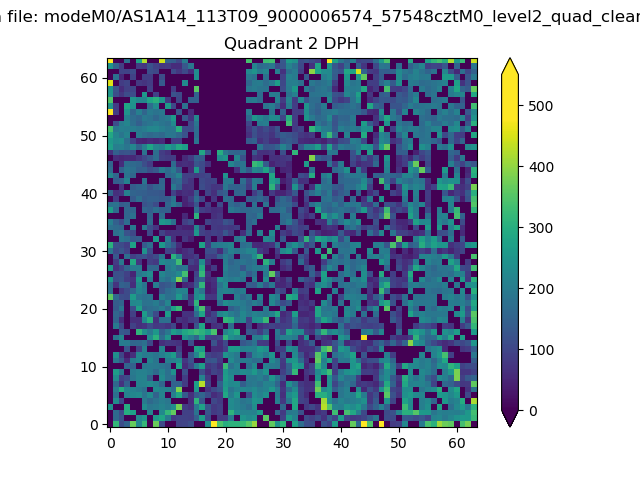 |
Quadrant C |
| Plot type | Count rate plots | Images |
|---|---|---|
| Comparison with Poisson distribution Blue bars denote a histogram of data divided into 1 sec bins. Red curve is a Poisson curve with rate = median count rate of data. |
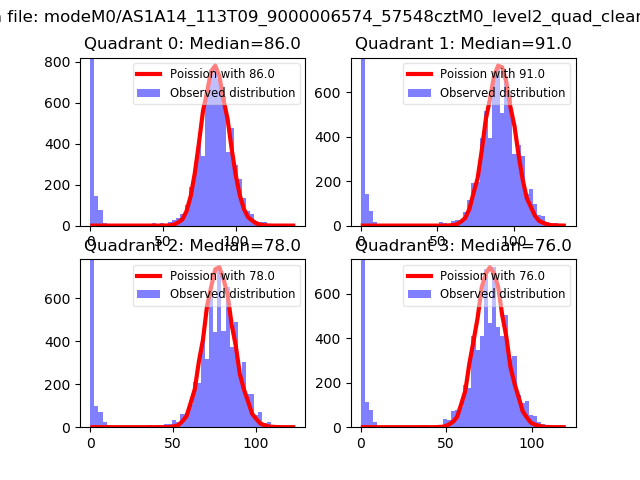 |
 |
| Quadrant-wise count rates Data is divided into 100 sec bins |
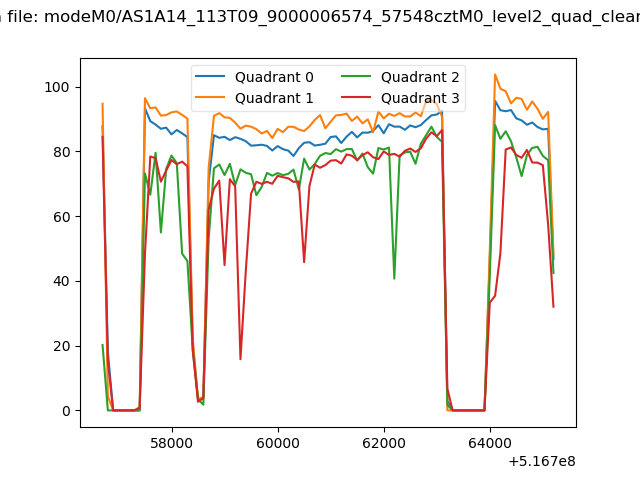 |
|
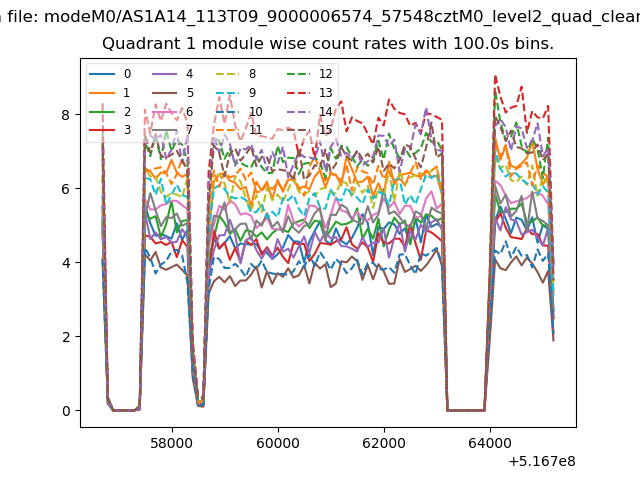
| Module-wise count rates for Quadrant A Data is divided into 100 sec bins |
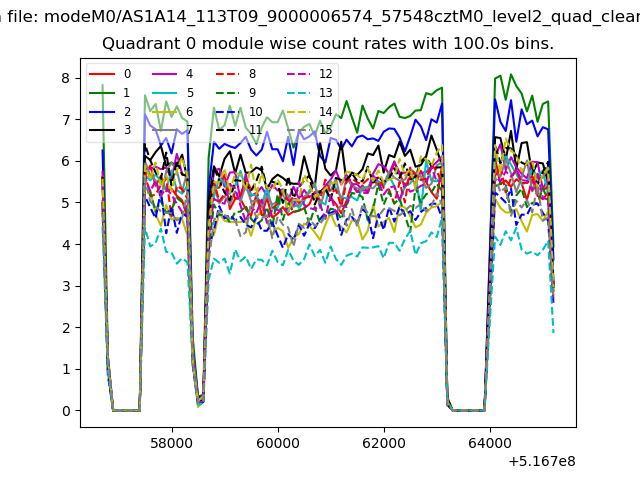 |
 |
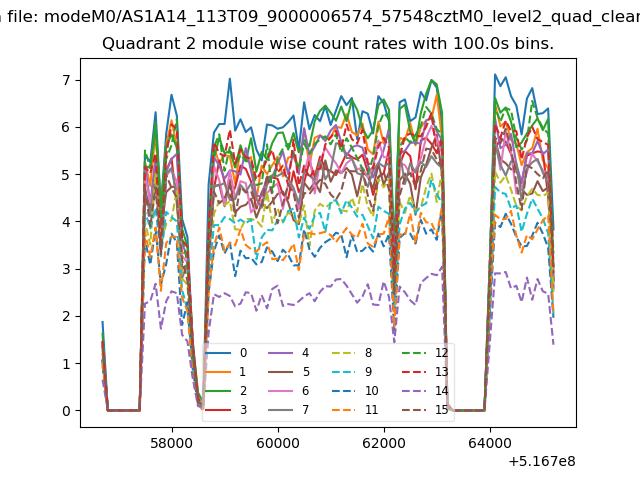
| Module-wise count rates for Quadrant B Data is divided into 100 sec bins |
 |
 |
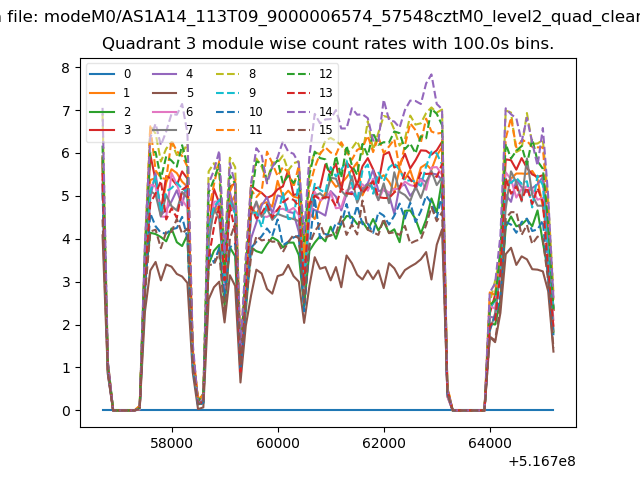
| Module-wise count rates for Quadrant C Data is divided into 100 sec bins |
 |
 |
| Module-wise count rates for Quadrant D Data is divided into 100 sec bins |
 |
 |
| Parameter | Plot |
|---|---|
| CZT HV Monitor | 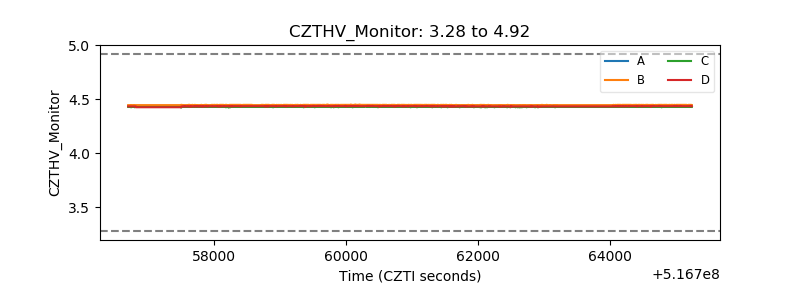 |
| D_VDD | 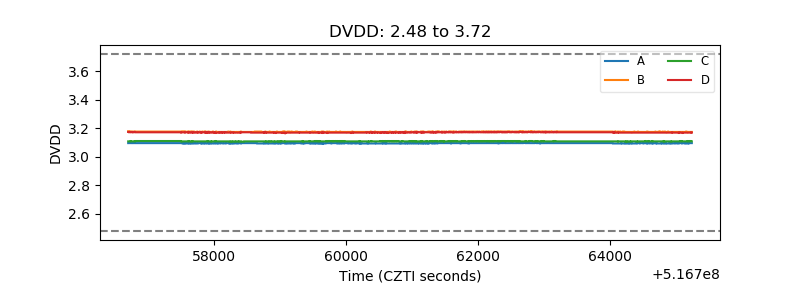 |
| Temperature 1 | 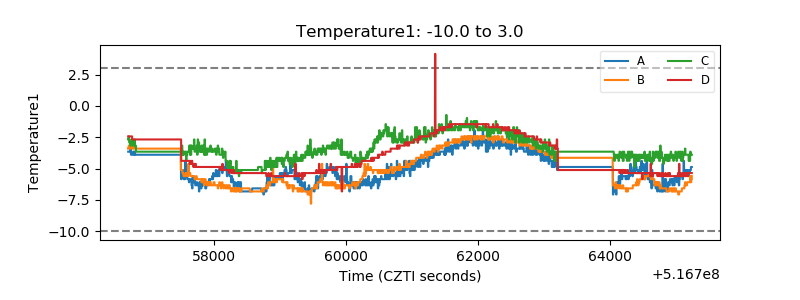 |
| Veto HV Monitor | 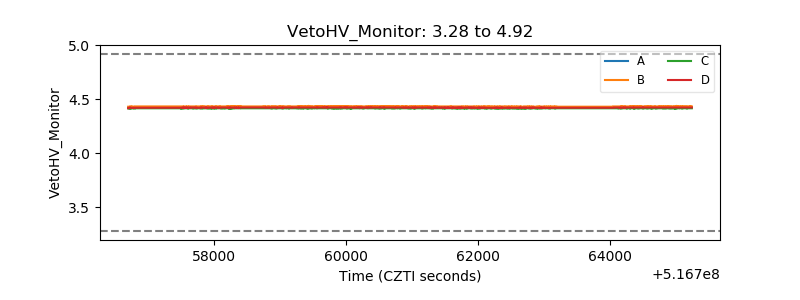 |
| Veto LLD | 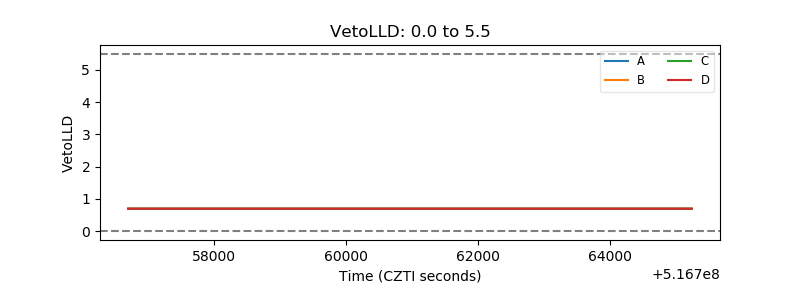 |
| Alpha Counter | 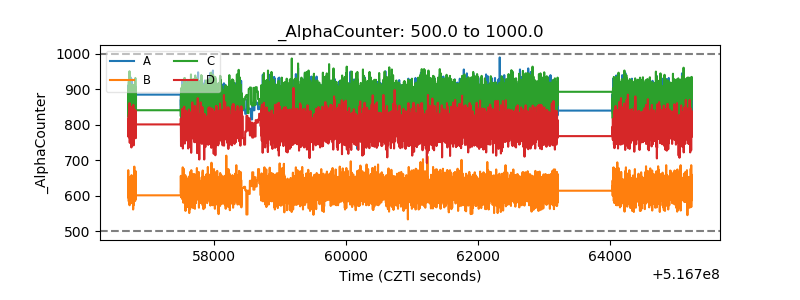 |
| _CPM_Rate | 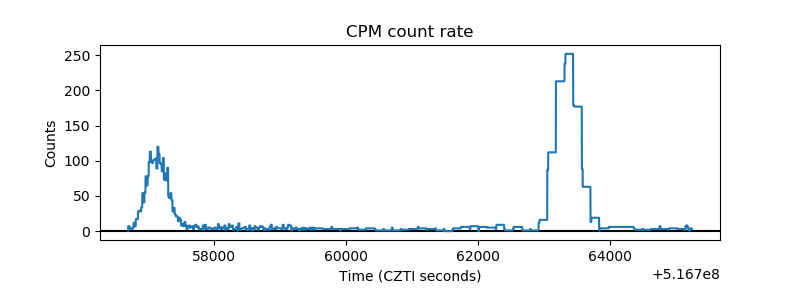 |
| CZT Counter | 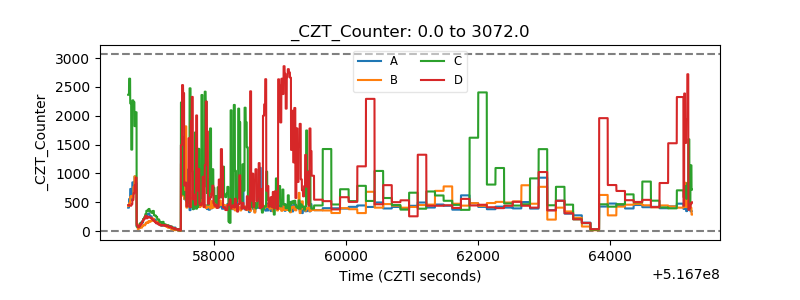 |
| +2.5 Volts monitor | 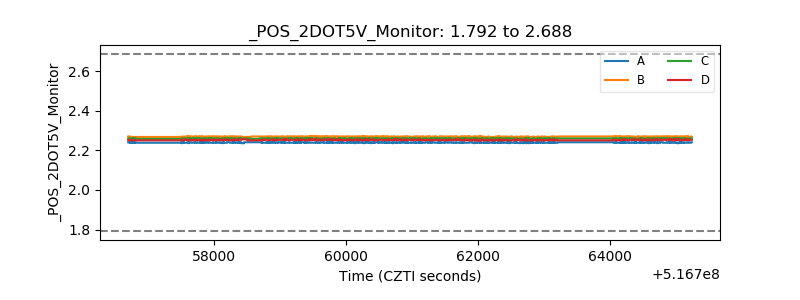 |
| +5 Volts monitor |  |
| _ROLL_ROT | 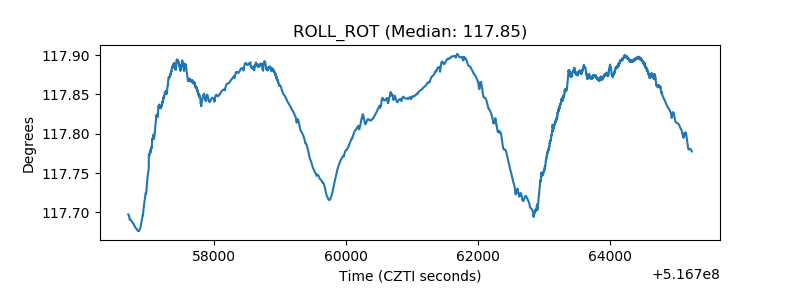 |
| _Roll_DEC | 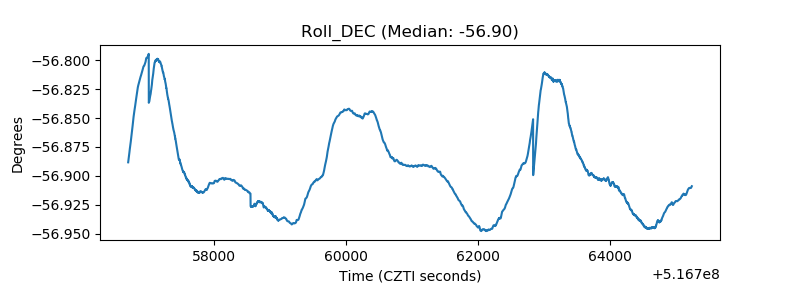 |
| _Roll_RA | 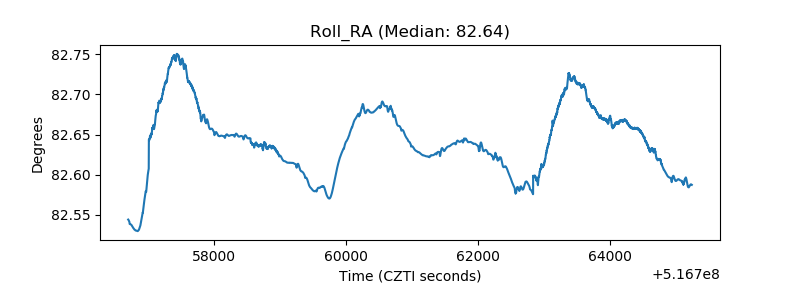 |
| Veto Counter | 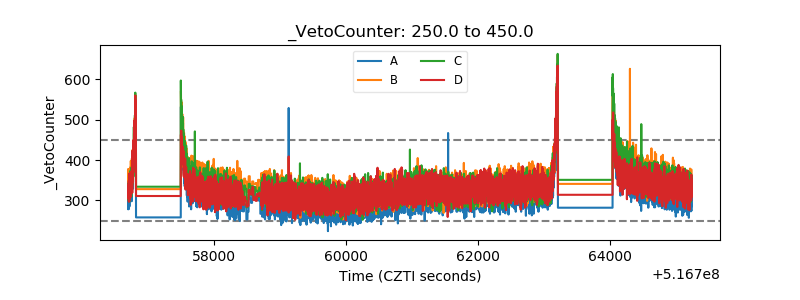 |