| Param | Original file | Final file |
|---|---|---|
| Filename | modeM0/AS1A14_113T09_9000006574_57549cztM0_level2.fits | modeM0/AS1A14_113T09_9000006574_57549cztM0_level2_quad_clean.evt |
| Size (bytes) | 532,572,480 | 94,501,440 |
| Size | 507.9 MB | 90.1 MB |
| Events in quadrant A | 3,553,314 | 644,407 |
| Events in quadrant B | 3,530,437 | 690,974 |
| Events in quadrant C | 4,126,212 | 609,971 |
| Events in quadrant D | 7,978,430 | 444,318 |
| Mode SS | |||
|---|---|---|---|
| Quadrant | BADHDUFLAG | Total packets | Discarded packets |
| A | 0 | 138 | 0 |
| B | 0 | 138 | 0 |
| C | 0 | 138 | 0 |
| D | 0 | 138 | 0 |
| Mode M9 | |||
|---|---|---|---|
| Quadrant | BADHDUFLAG | Total packets | Discarded packets |
| A | 0 | 14 | 0 |
| B | 0 | 15 | 0 |
| C | 0 | 15 | 0 |
| D | 0 | 15 | 0 |
| Mode M0 | |||
|---|---|---|---|
| Quadrant | BADHDUFLAG | Total packets | Discarded packets |
| A | 0 | 15521 | 2 |
| B | 0 | 15116 | 2 |
| C | 0 | 17027 | 2 |
| D | 0 | 28343 | 2 |
| Quadrant | Total seconds | Saturated seconds | Saturation percentage |
|---|---|---|---|
| A | 6764 | 138 | 2.040213% |
| B | 6764 | 150 | 2.217623% |
| C | 6764 | 200 | 2.956830% |
| D | 6764 | 1726 | 25.517445% |
Noise dominated data is calculated using 1-second bins in cleaned event files. If a bin has >2000 counts, and if more than 50% of those come from <1% of pixels, then it is considered to be noise-dominated and hence unusable.
| Quadrant | # 1 sec bins | Bins with >0 counts | Bins with >2000 counts | High rate bins dominated by noise | Noise dominated (total time) | Noise dominated (detector-on time) | Marked lightcurve |
|---|---|---|---|---|---|---|---|
| A | 7724 | 6764 | 83 | 83 | 1.07% | 1.23% | 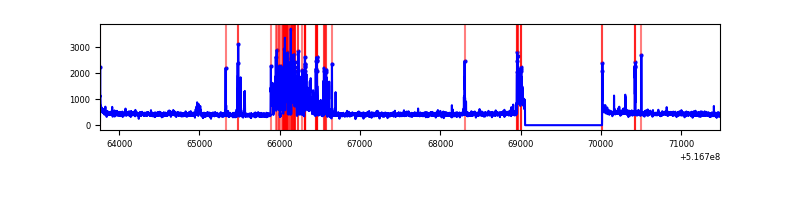 |
| B | 7724 | 6764 | 56 | 56 | 0.73% | 0.83% | 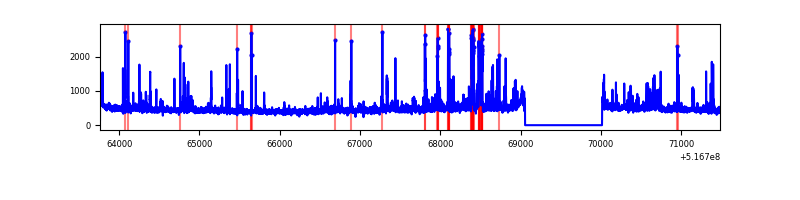 |
| C | 7723 | 6763 | 144 | 144 | 1.86% | 2.13% | 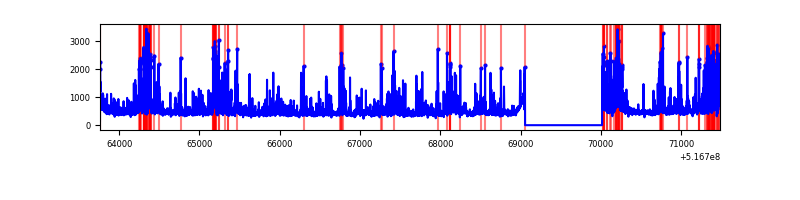 |
| D | 7724 | 6764 | 1701 | 1701 | 22.02% | 25.15% | 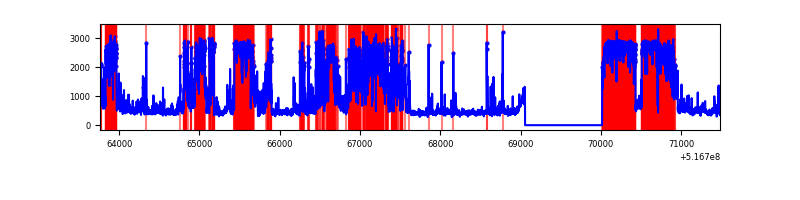 |
Top three noisy pixels from each quadrant. If the there are fewer than three noisy pixels in the level2.evt file, extra rows are filled as -1
| Pixel properties | Quadrant properties | ||||||
|---|---|---|---|---|---|---|---|
| Quadrant | DetID | PixID | Counts | Sigma | Mean | Median | Sigma |
| A | 10 | 251 | 643971 | 3553.39 | 732 | 713 | 181.0 |
| A | 4 | 249 | 26531 | 142.62 | 732 | 713 | 181.0 |
| A | 3 | 128 | 21196 | 113.15 | 732 | 713 | 181.0 |
| B | 4 | 206 | 180802 | 1154.53 | 726 | 698 | 156.0 |
| B | 10 | 246 | 86523 | 550.17 | 726 | 698 | 156.0 |
| B | 4 | 201 | 61094 | 387.16 | 726 | 698 | 156.0 |
| C | 15 | 224 | 1118701 | 5737.3 | 713 | 705 | 194.9 |
| C | 12 | 254 | 80883 | 411.46 | 713 | 705 | 194.9 |
| C | 6 | 223 | 52737 | 267.02 | 713 | 705 | 194.9 |
| D | 15 | 142 | 5120641 | 29547.46 | 617 | 590 | 173.3 |
| D | 15 | 94 | 105258 | 604.03 | 617 | 590 | 173.3 |
| D | 8 | 160 | 92680 | 531.44 | 617 | 590 | 173.3 |
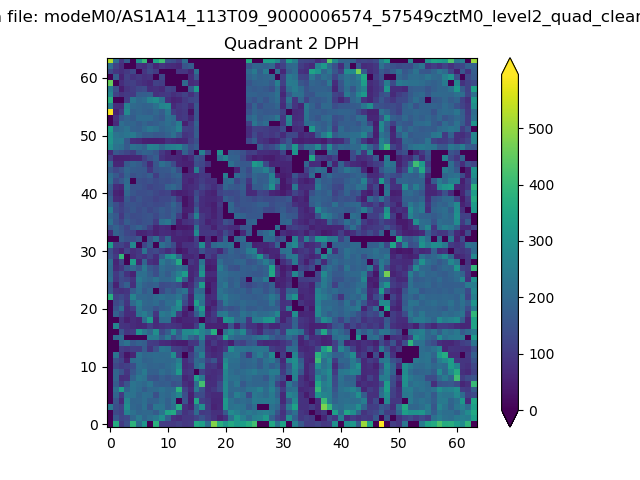
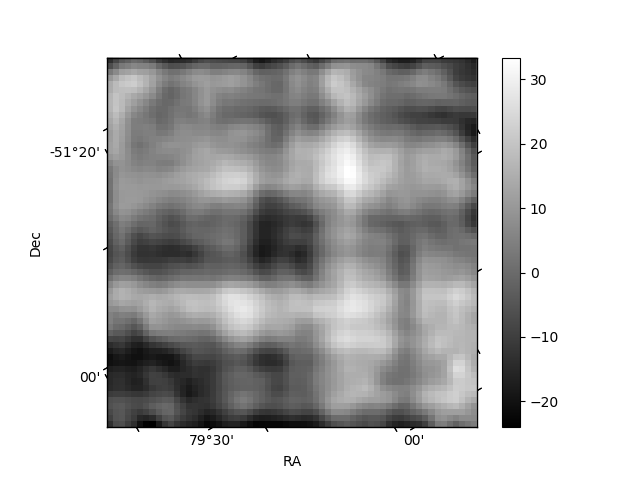
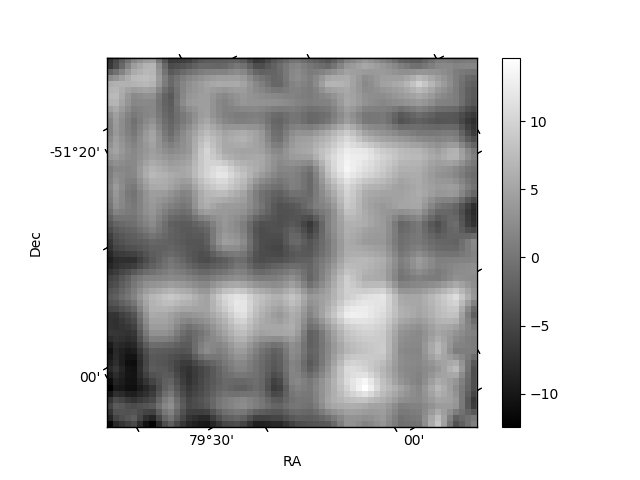
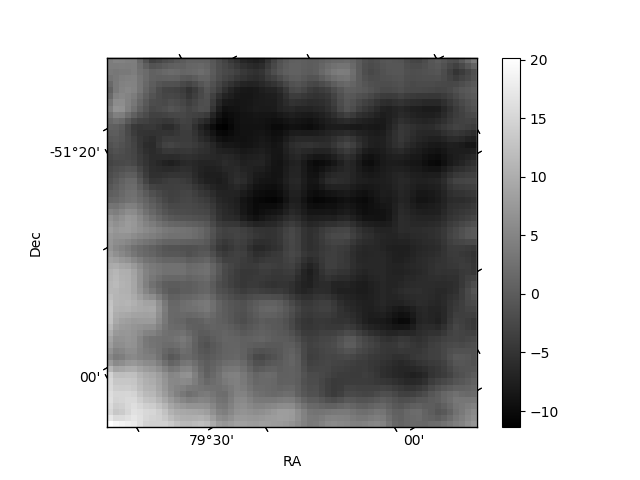
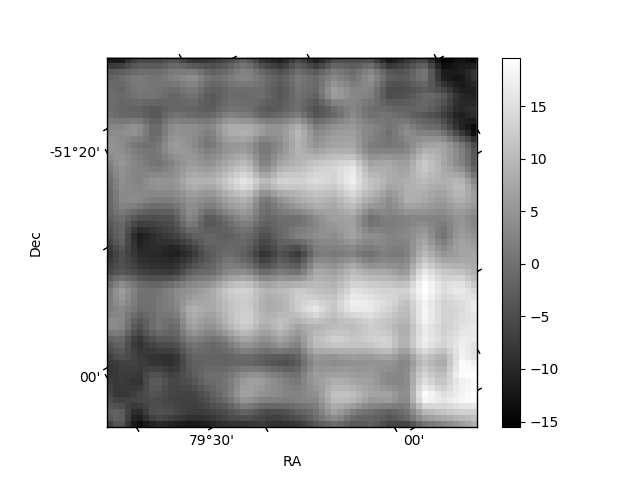
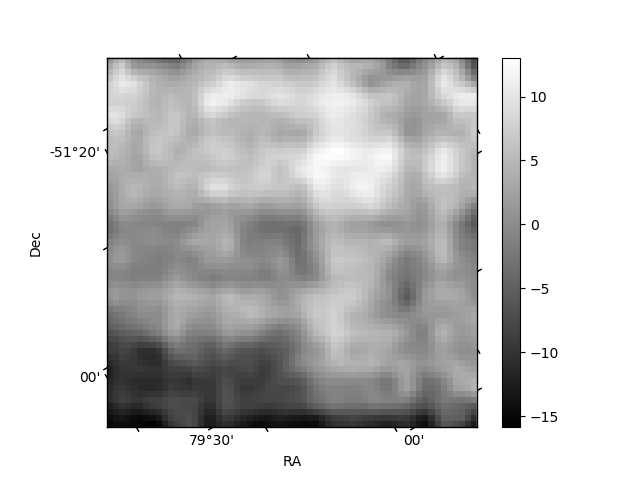
Histogram calculated using DETX and DETY for each event in the final _common_clean file
| Quadrant A | 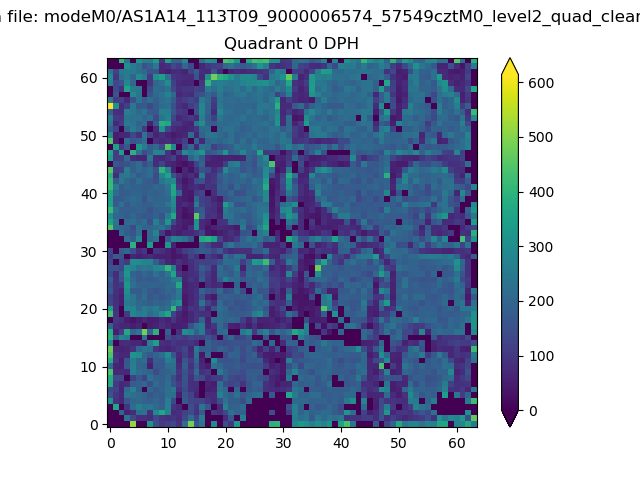 |
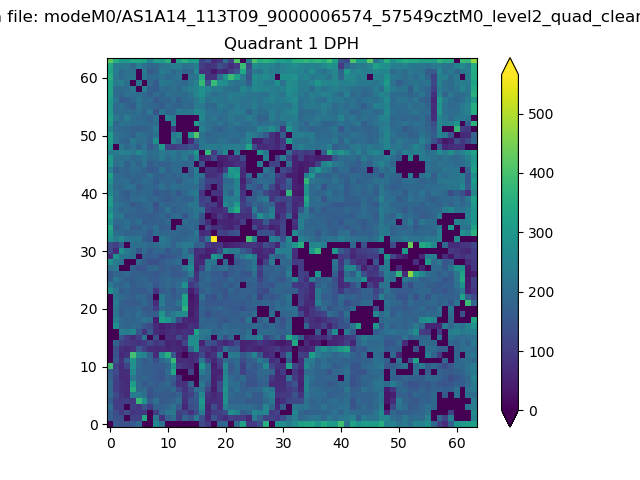 |
Quadrant B |
|---|---|---|---|
| Quadrant D | 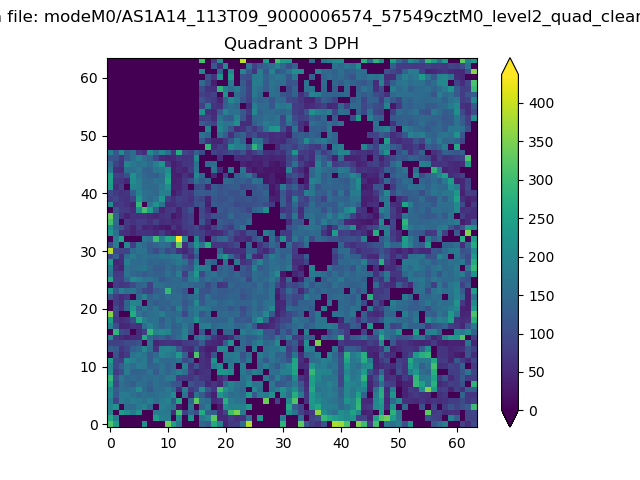 |
 |
Quadrant C |
| Plot type | Count rate plots | Images |
|---|---|---|
| Comparison with Poisson distribution Blue bars denote a histogram of data divided into 1 sec bins. Red curve is a Poisson curve with rate = median count rate of data. |
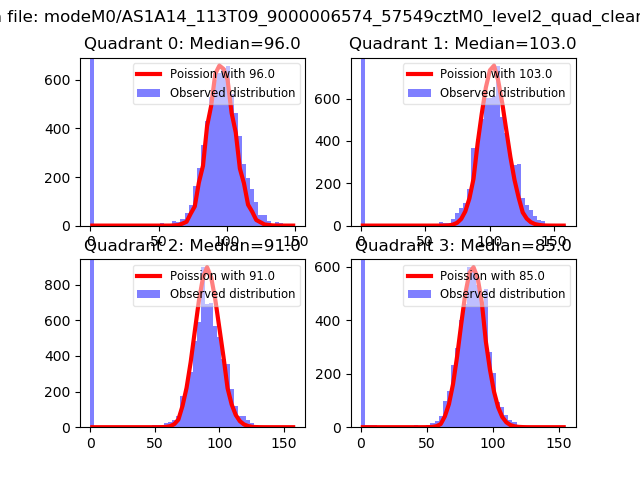 |
 |
| Quadrant-wise count rates Data is divided into 100 sec bins |
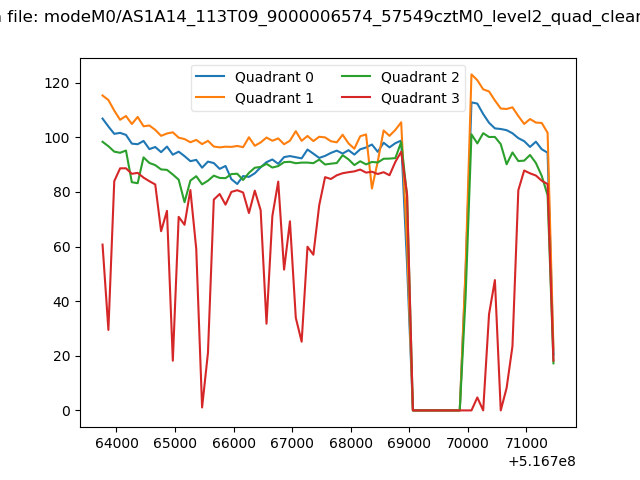 |
|
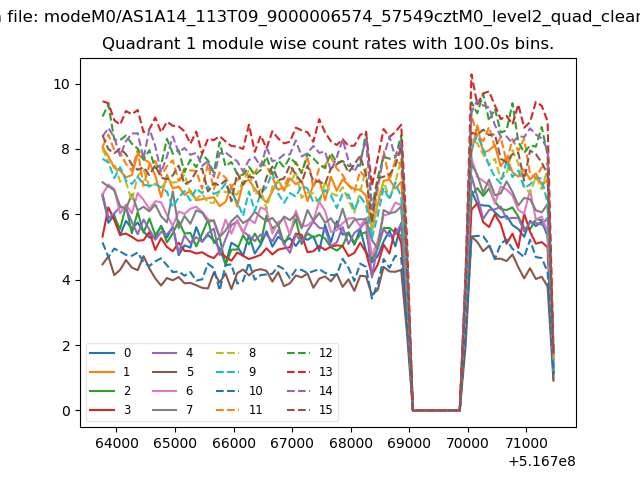
| Module-wise count rates for Quadrant A Data is divided into 100 sec bins |
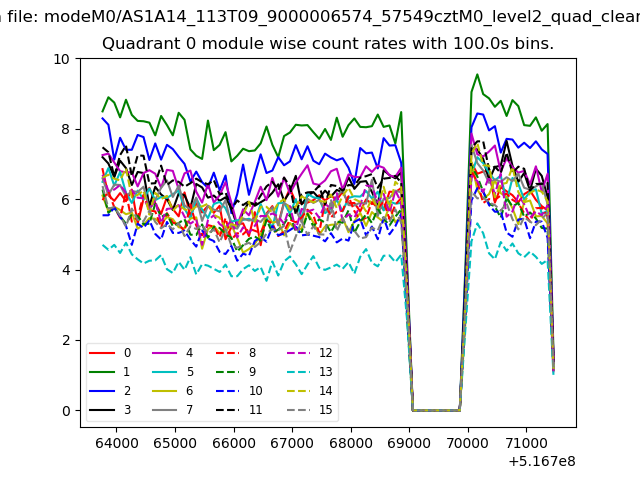 |
 |
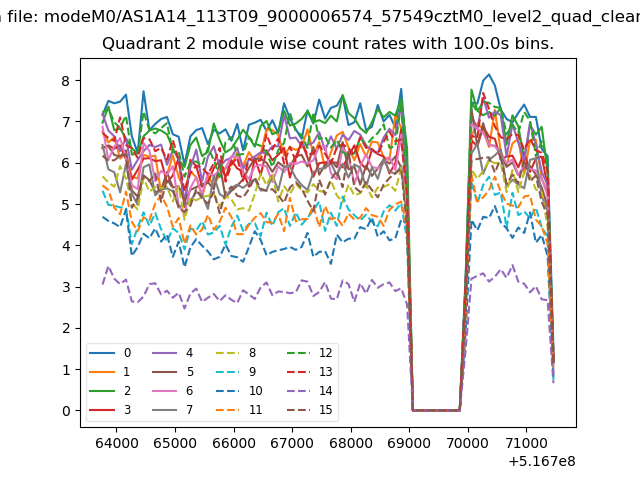
| Module-wise count rates for Quadrant B Data is divided into 100 sec bins |
 |
 |
| Module-wise count rates for Quadrant C Data is divided into 100 sec bins |
 |
 |
| Module-wise count rates for Quadrant D Data is divided into 100 sec bins |
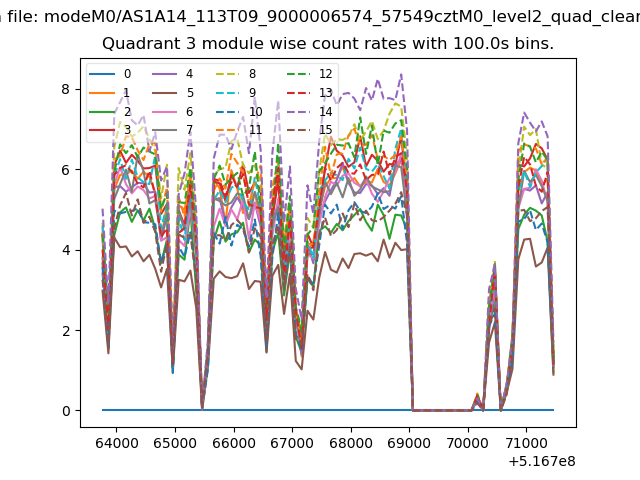 |
 |
| Parameter | Plot |
|---|---|
| CZT HV Monitor | 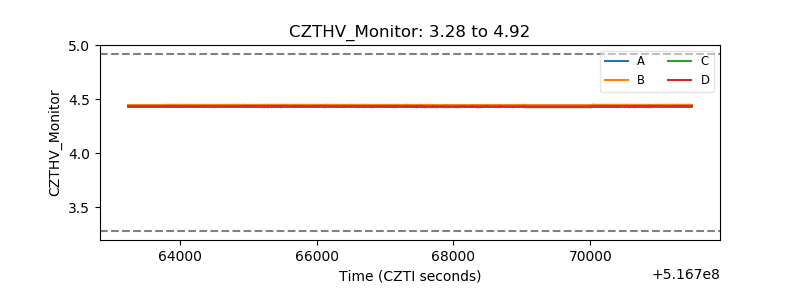 |
| D_VDD | 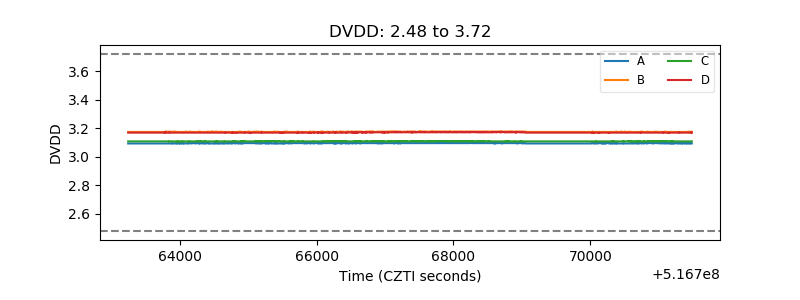 |
| Temperature 1 | 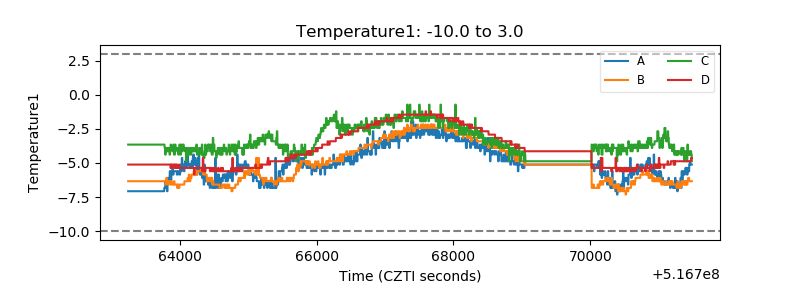 |
| Veto HV Monitor | 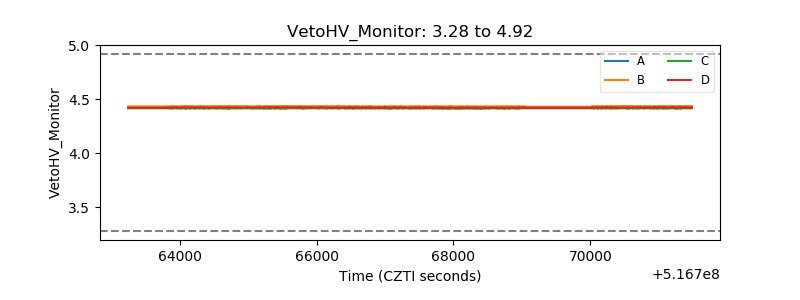 |
| Veto LLD | 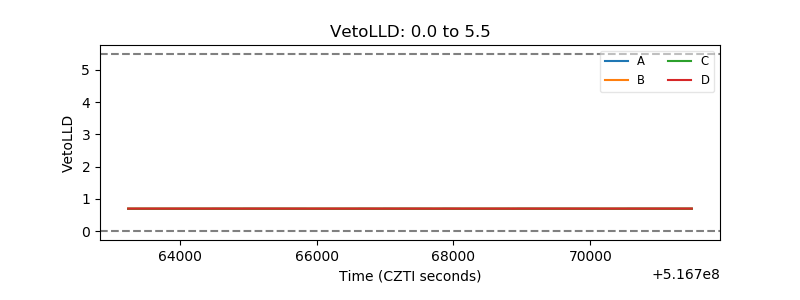 |
| Alpha Counter | 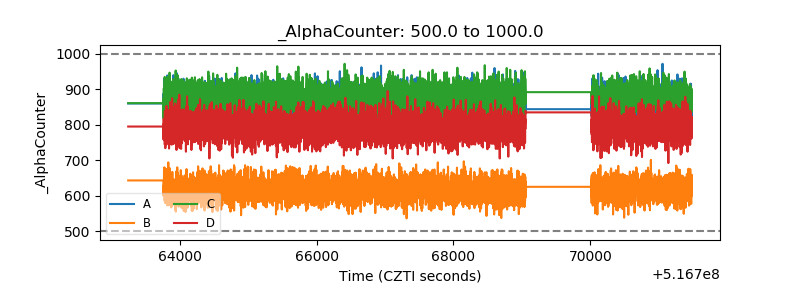 |
| _CPM_Rate | 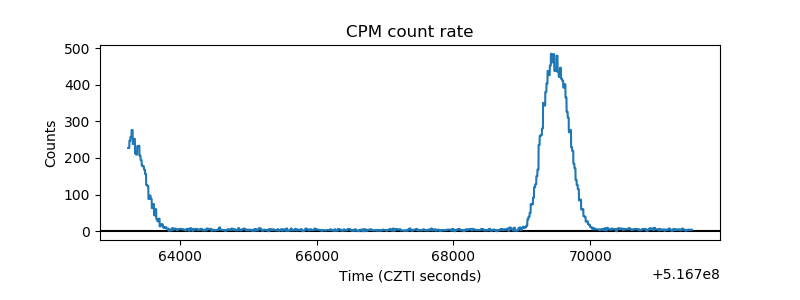 |
| CZT Counter | 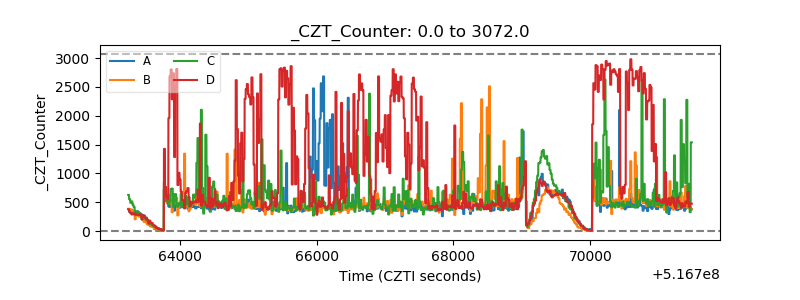 |
| +2.5 Volts monitor |  |
| +5 Volts monitor | 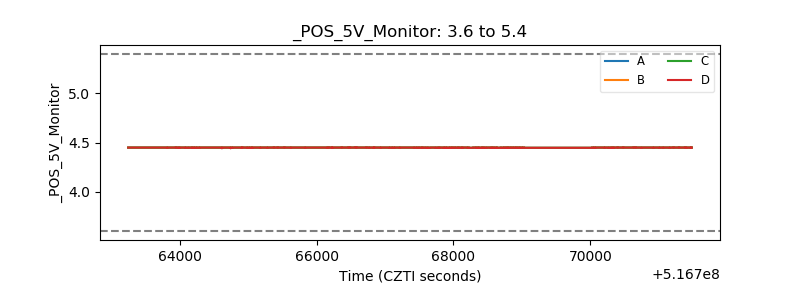 |
| _ROLL_ROT | 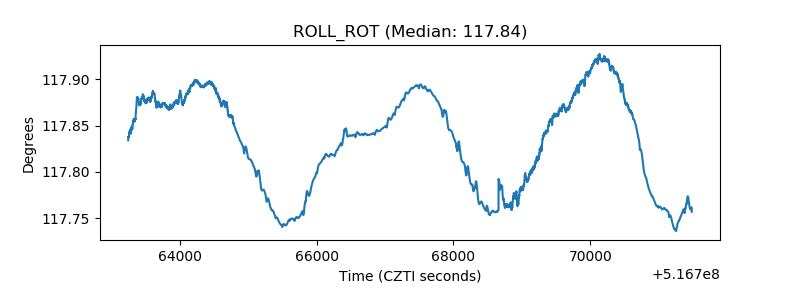 |
| _Roll_DEC | 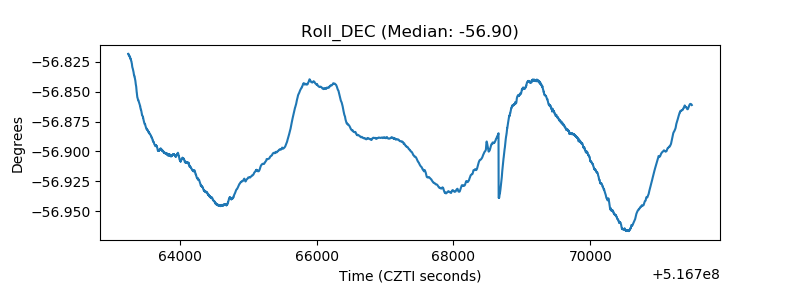 |
| _Roll_RA | 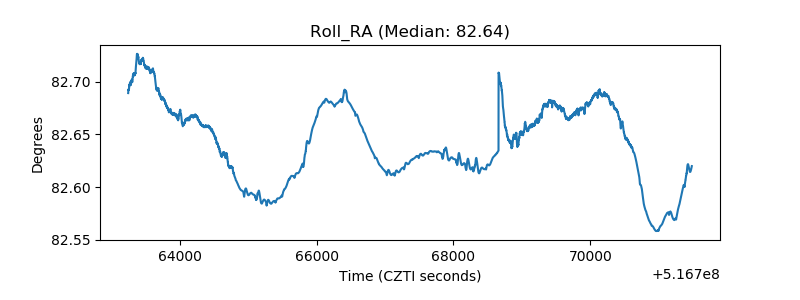 |
| Veto Counter | 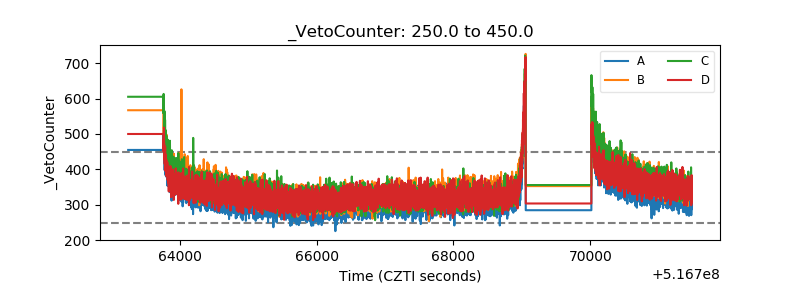 |