| Param | Original file | Final file |
|---|---|---|
| Filename | modeM0/AS1A14_113T09_9000006574_57554cztM0_level2.fits | modeM0/AS1A14_113T09_9000006574_57554cztM0_level2_quad_clean.evt |
| Size (bytes) | 472,728,960 | 99,066,240 |
| Size | 450.8 MB | 94.5 MB |
| Events in quadrant A | 4,367,974 | 653,061 |
| Events in quadrant B | 3,344,488 | 698,602 |
| Events in quadrant C | 3,974,434 | 624,391 |
| Events in quadrant D | 5,297,913 | 562,390 |
| Mode SS | |||
|---|---|---|---|
| Quadrant | BADHDUFLAG | Total packets | Discarded packets |
| A | 0 | 134 | 0 |
| B | 0 | 134 | 0 |
| C | 0 | 134 | 0 |
| D | 0 | 134 | 0 |
| Mode M9 | |||
|---|---|---|---|
| Quadrant | BADHDUFLAG | Total packets | Discarded packets |
| A | 0 | 11 | 0 |
| B | 0 | 11 | 0 |
| C | 0 | 11 | 0 |
| D | 0 | 11 | 0 |
| Mode M0 | |||
|---|---|---|---|
| Quadrant | BADHDUFLAG | Total packets | Discarded packets |
| A | 0 | 17687 | 2 |
| B | 0 | 14564 | 1 |
| C | 0 | 16500 | 1 |
| D | 0 | 20282 | 1 |
| Quadrant | Total seconds | Saturated seconds | Saturation percentage |
|---|---|---|---|
| A | 6617 | 138 | 2.085537% |
| B | 6618 | 153 | 2.311877% |
| C | 6618 | 211 | 3.188274% |
| D | 6618 | 519 | 7.842248% |
Noise dominated data is calculated using 1-second bins in cleaned event files. If a bin has >2000 counts, and if more than 50% of those come from <1% of pixels, then it is considered to be noise-dominated and hence unusable.
| Quadrant | # 1 sec bins | Bins with >0 counts | Bins with >2000 counts | High rate bins dominated by noise | Noise dominated (total time) | Noise dominated (detector-on time) | Marked lightcurve |
|---|---|---|---|---|---|---|---|
| A | 7712 | 6617 | 8 | 8 | 0.10% | 0.12% | 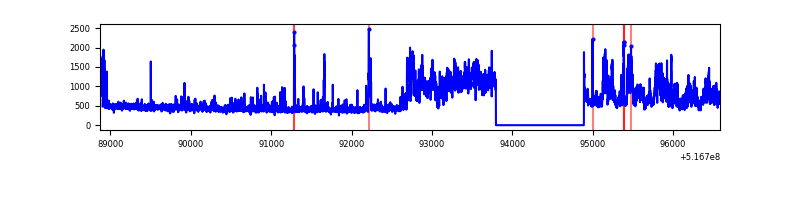 |
| B | 7712 | 6617 | 51 | 51 | 0.66% | 0.77% | 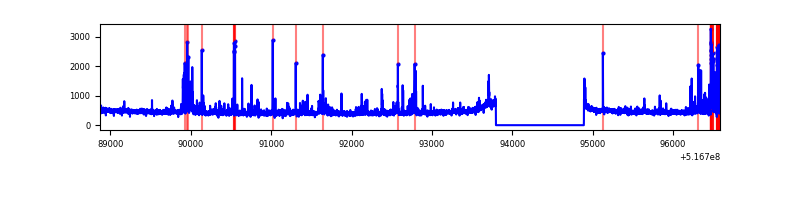 |
| C | 7713 | 6619 | 129 | 129 | 1.67% | 1.95% | 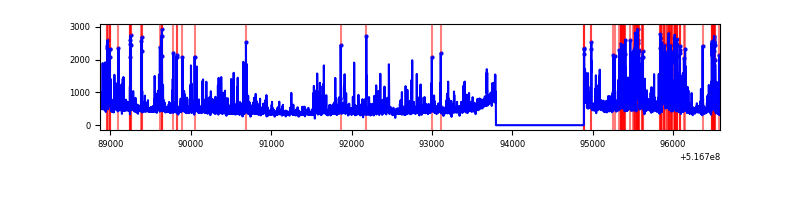 |
| D | 7713 | 6618 | 481 | 481 | 6.24% | 7.27% | 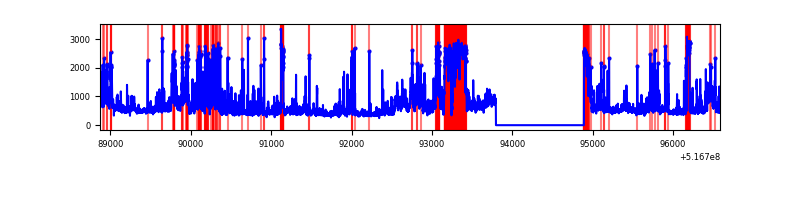 |
Top three noisy pixels from each quadrant. If the there are fewer than three noisy pixels in the level2.evt file, extra rows are filled as -1
| Pixel properties | Quadrant properties | ||||||
|---|---|---|---|---|---|---|---|
| Quadrant | DetID | PixID | Counts | Sigma | Mean | Median | Sigma |
| A | 3 | 14 | 1421805 | 7893.83 | 734 | 716 | 180.0 |
| A | 13 | 248 | 31090 | 168.72 | 734 | 716 | 180.0 |
| A | 8 | 249 | 29222 | 158.34 | 734 | 716 | 180.0 |
| B | 4 | 142 | 157877 | 1027.13 | 717 | 690 | 153.0 |
| B | 5 | 185 | 102999 | 668.53 | 717 | 690 | 153.0 |
| B | 7 | 252 | 64316 | 415.76 | 717 | 690 | 153.0 |
| C | 15 | 224 | 1115241 | 5761.47 | 709 | 699 | 193.4 |
| C | 12 | 254 | 32282 | 163.26 | 709 | 699 | 193.4 |
| C | 14 | 254 | 19205 | 95.66 | 709 | 699 | 193.4 |
| D | 8 | 160 | 1256743 | 6355.45 | 700 | 667 | 197.6 |
| D | 15 | 142 | 719694 | 3638.11 | 700 | 667 | 197.6 |
| D | 3 | 12 | 115215 | 579.59 | 700 | 667 | 197.6 |
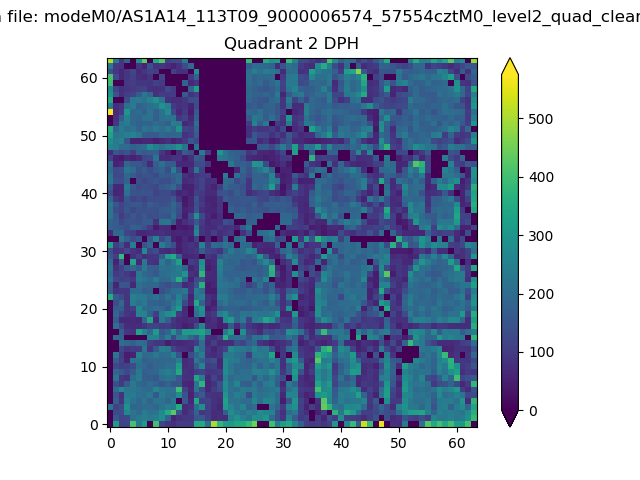
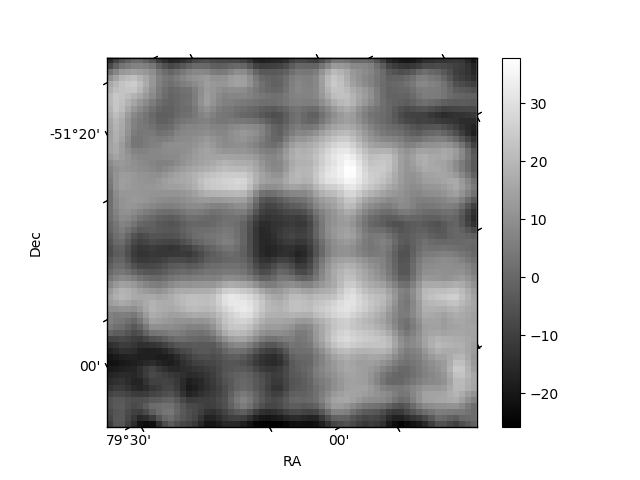
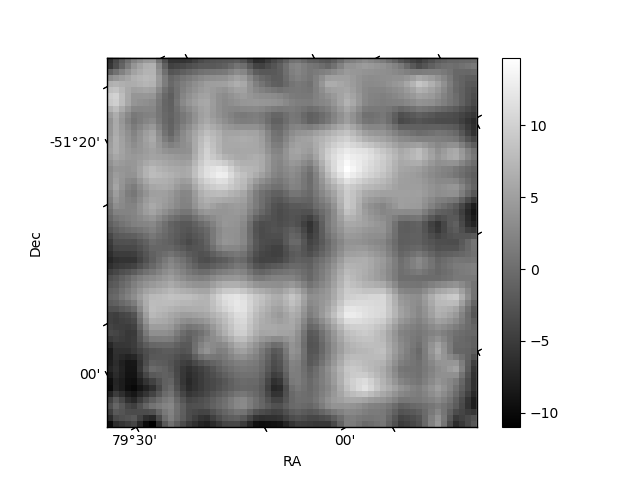
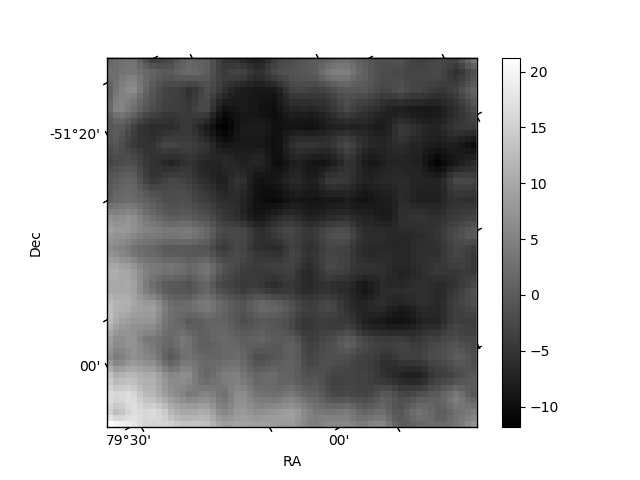
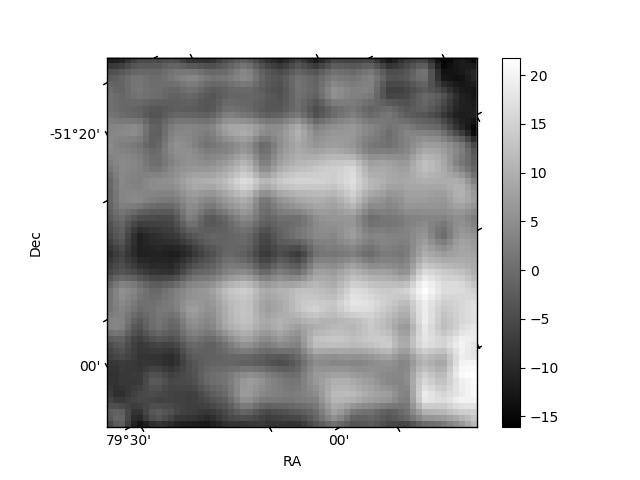
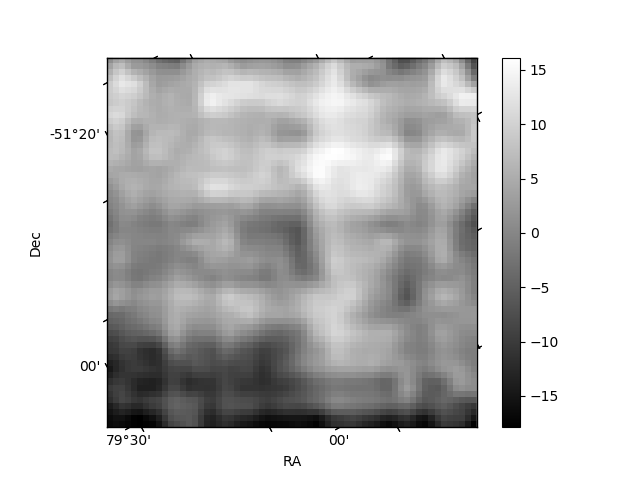
Histogram calculated using DETX and DETY for each event in the final _common_clean file
| Quadrant A | 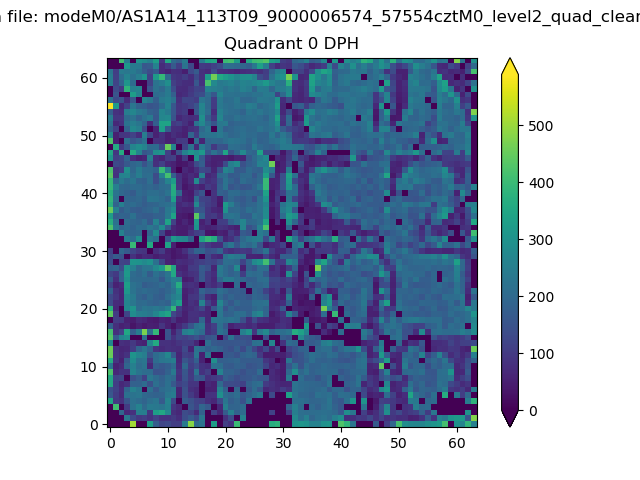 |
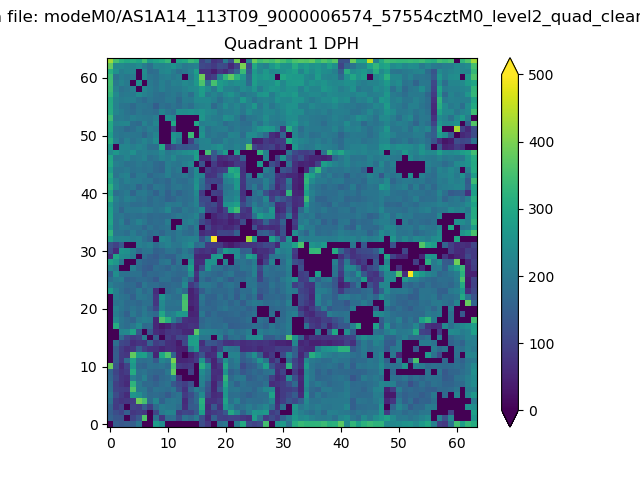 |
Quadrant B |
|---|---|---|---|
| Quadrant D | 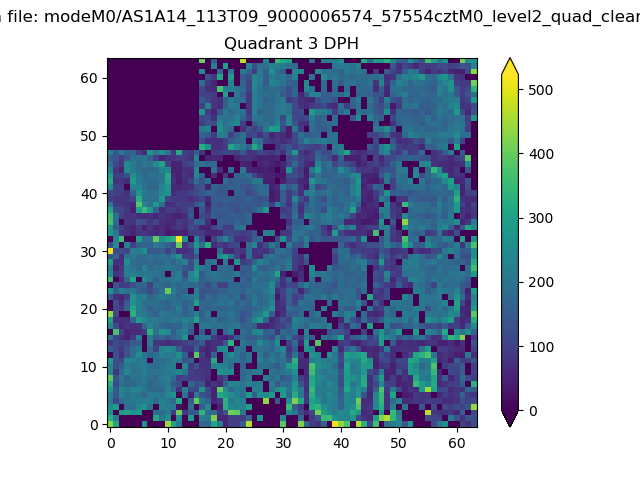 |
 |
Quadrant C |
| Plot type | Count rate plots | Images |
|---|---|---|
| Comparison with Poisson distribution Blue bars denote a histogram of data divided into 1 sec bins. Red curve is a Poisson curve with rate = median count rate of data. |
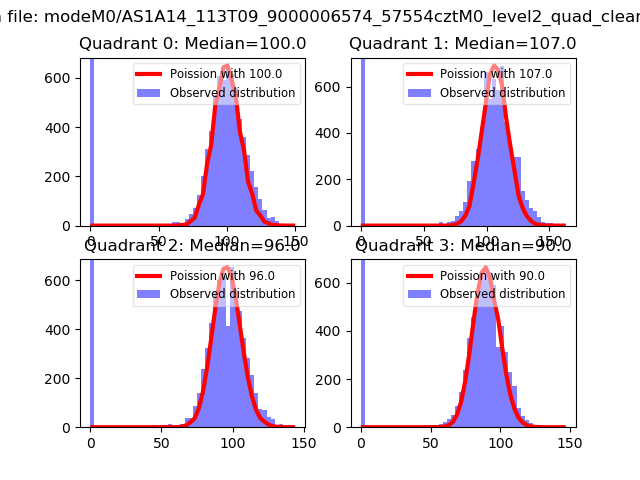 |
 |
| Quadrant-wise count rates Data is divided into 100 sec bins |
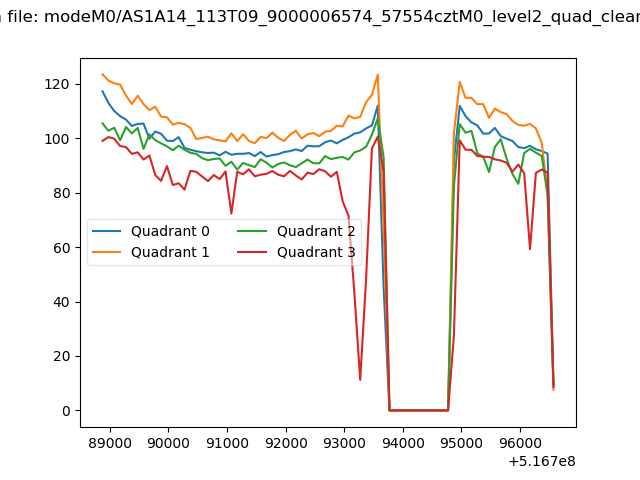 |
|
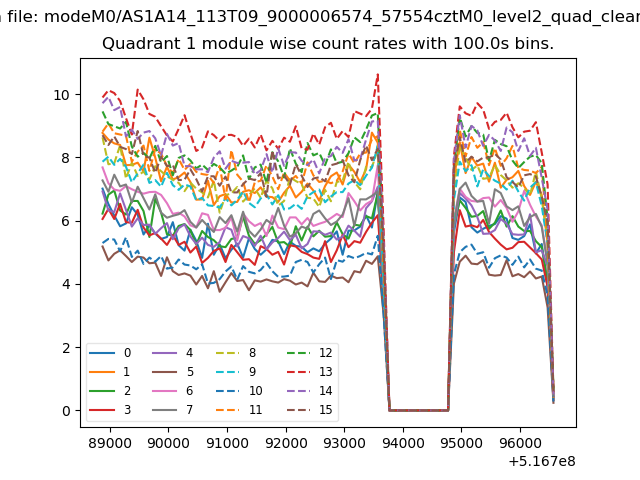
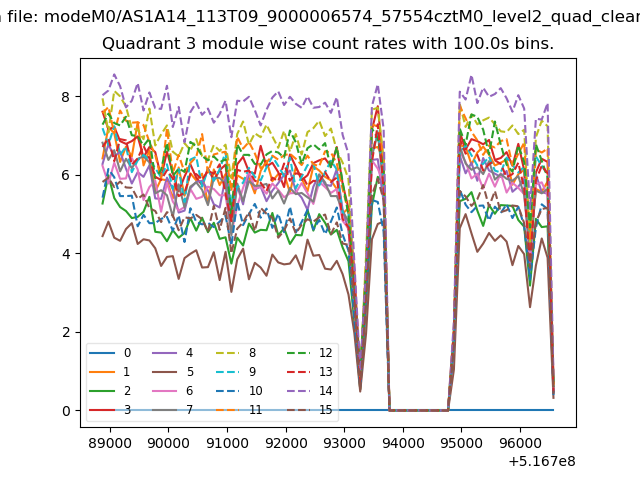
| Module-wise count rates for Quadrant A Data is divided into 100 sec bins |
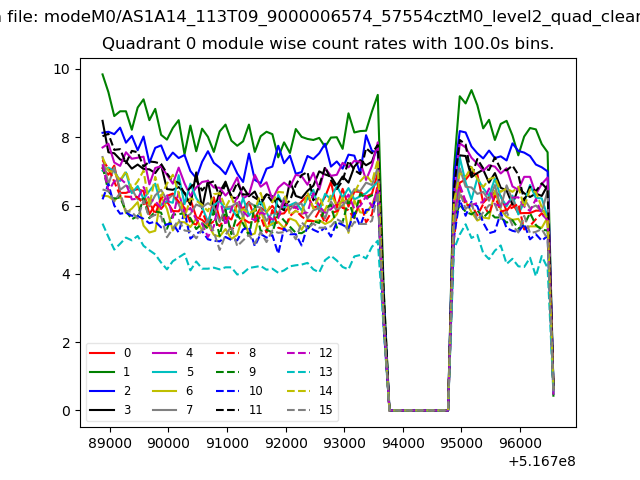 |
 |
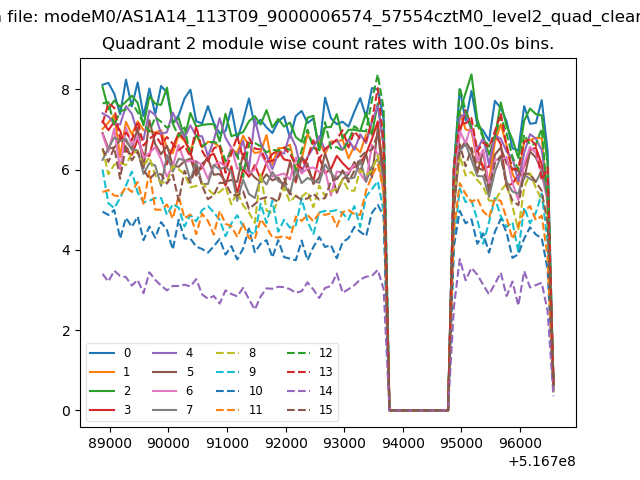
| Module-wise count rates for Quadrant B Data is divided into 100 sec bins |
 |
 |
| Module-wise count rates for Quadrant C Data is divided into 100 sec bins |
 |
 |
| Module-wise count rates for Quadrant D Data is divided into 100 sec bins |
 |
 |
| Parameter | Plot |
|---|---|
| CZT HV Monitor | 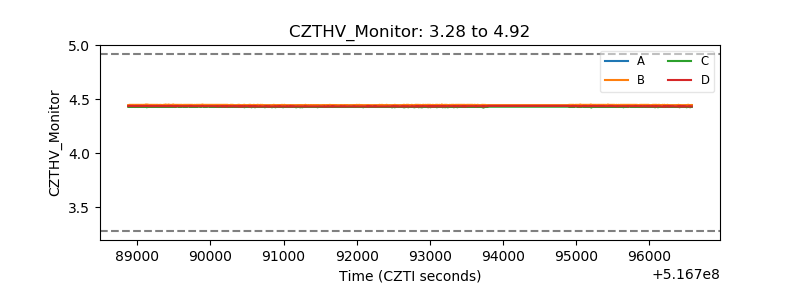 |
| D_VDD | 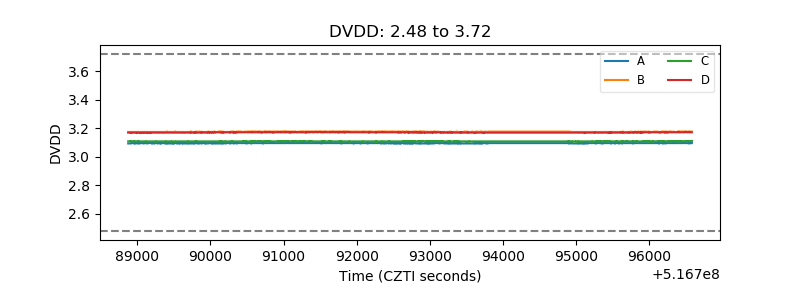 |
| Temperature 1 | 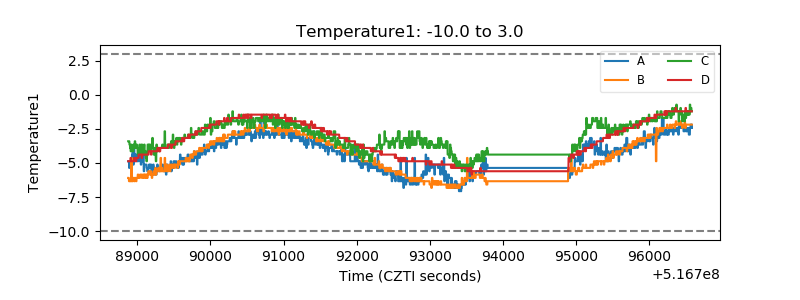 |
| Veto HV Monitor | 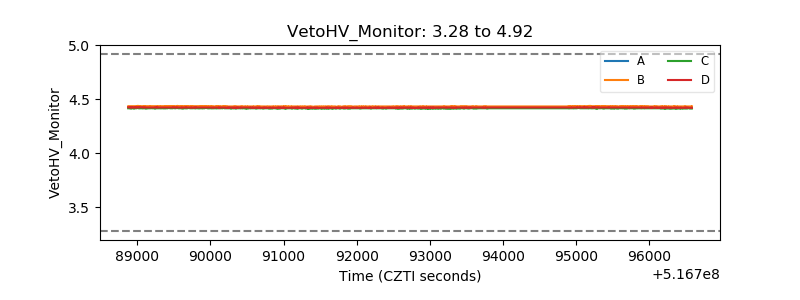 |
| Veto LLD | 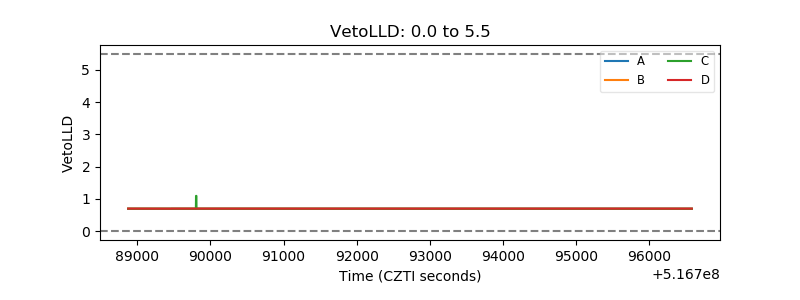 |
| Alpha Counter | 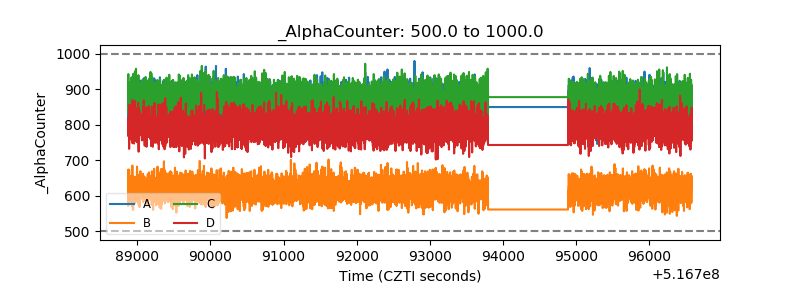 |
| _CPM_Rate | 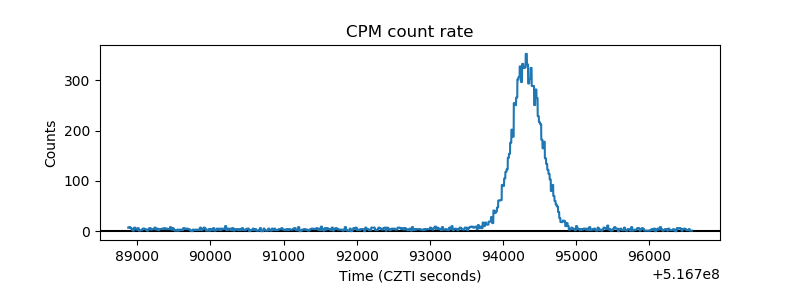 |
| CZT Counter | 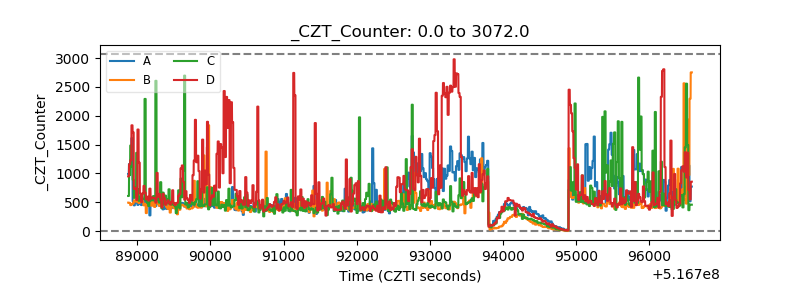 |
| +2.5 Volts monitor | 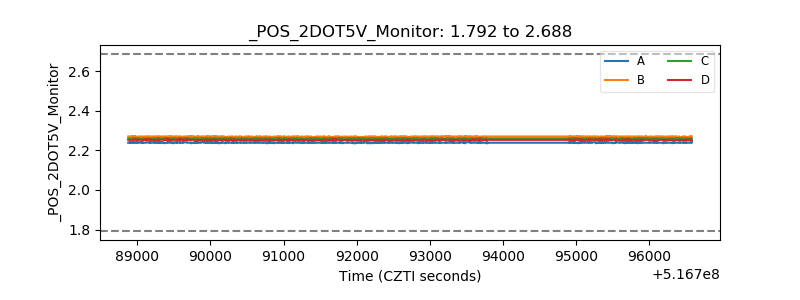 |
| +5 Volts monitor |  |
| _ROLL_ROT | 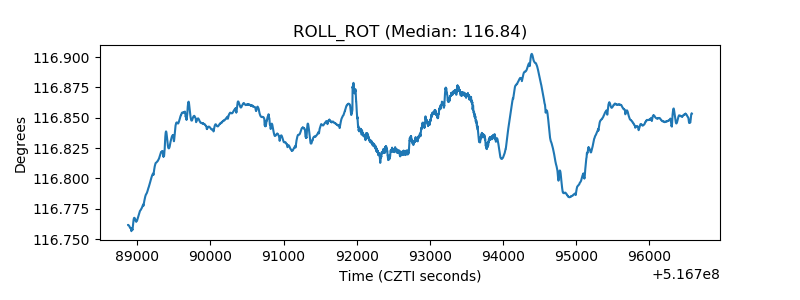 |
| _Roll_DEC | 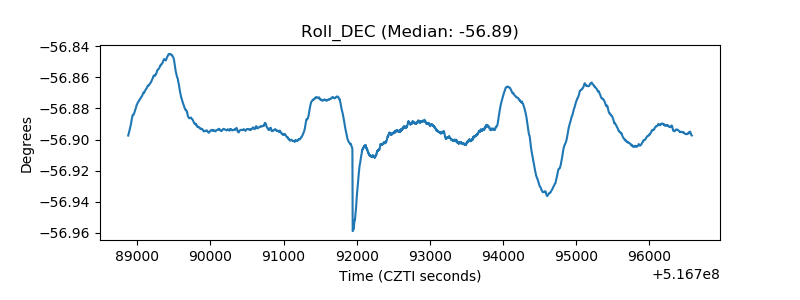 |
| _Roll_RA | 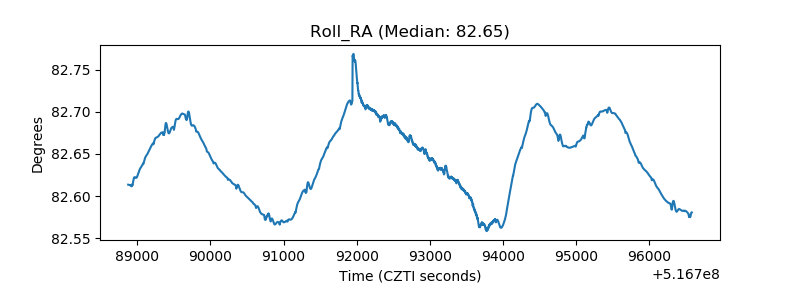 |
| Veto Counter | 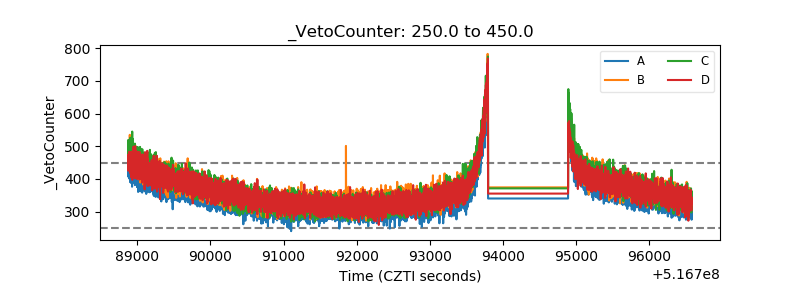 |