| Param | Original file | Final file |
|---|---|---|
| Filename | modeM0/AS1A14_113T09_9000006574_57555cztM0_level2.fits | modeM0/AS1A14_113T09_9000006574_57555cztM0_level2_quad_clean.evt |
| Size (bytes) | 501,727,680 | 98,369,280 |
| Size | 478.5 MB | 93.8 MB |
| Events in quadrant A | 5,673,097 | 635,013 |
| Events in quadrant B | 3,743,186 | 681,932 |
| Events in quadrant C | 4,343,030 | 612,821 |
| Events in quadrant D | 4,289,836 | 579,299 |
| Mode SS | |||
|---|---|---|---|
| Quadrant | BADHDUFLAG | Total packets | Discarded packets |
| A | 0 | 138 | 2 |
| B | 0 | 138 | 2 |
| C | 0 | 138 | 2 |
| D | 0 | 138 | 2 |
| Mode M9 | |||
|---|---|---|---|
| Quadrant | BADHDUFLAG | Total packets | Discarded packets |
| A | 0 | 9 | 0 |
| B | 0 | 9 | 0 |
| C | 0 | 9 | 0 |
| D | 0 | 9 | 0 |
| Mode M0 | |||
|---|---|---|---|
| Quadrant | BADHDUFLAG | Total packets | Discarded packets |
| A | 0 | 21710 | 206 |
| B | 0 | 15930 | 78 |
| C | 0 | 17825 | 77 |
| D | 0 | 17655 | 130 |
| Quadrant | Total seconds | Saturated seconds | Saturation percentage |
|---|---|---|---|
| A | 6736 | 333 | 4.943587% |
| B | 6743 | 269 | 3.989322% |
| C | 6744 | 291 | 4.314947% |
| D | 6736 | 239 | 3.548100% |
Noise dominated data is calculated using 1-second bins in cleaned event files. If a bin has >2000 counts, and if more than 50% of those come from <1% of pixels, then it is considered to be noise-dominated and hence unusable.
| Quadrant | # 1 sec bins | Bins with >0 counts | Bins with >2000 counts | High rate bins dominated by noise | Noise dominated (total time) | Noise dominated (detector-on time) | Marked lightcurve |
|---|---|---|---|---|---|---|---|
| A | 7669 | 6743 | 338 | 338 | 4.41% | 5.01% | 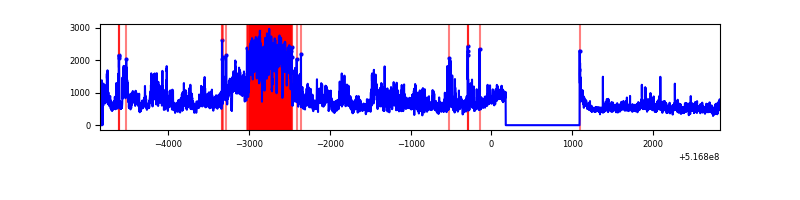 |
| B | 7667 | 6752 | 161 | 161 | 2.10% | 2.38% | 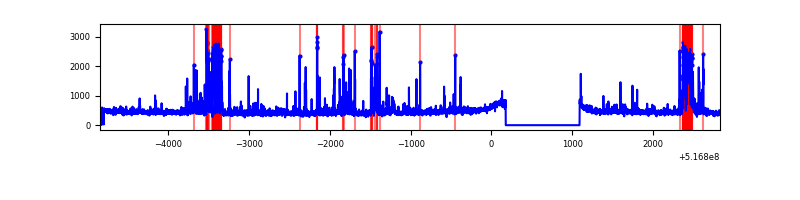 |
| C | 7678 | 6753 | 199 | 199 | 2.59% | 2.95% | 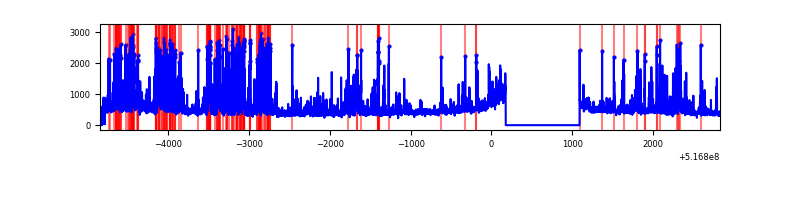 |
| D | 7667 | 6745 | 170 | 170 | 2.22% | 2.52% | 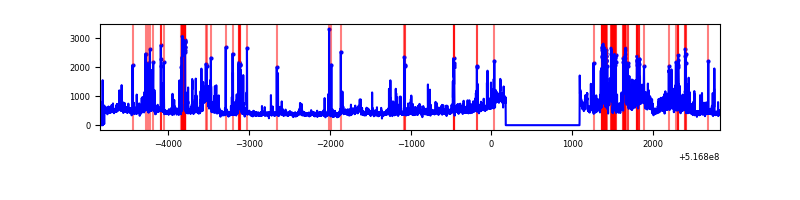 |
Top three noisy pixels from each quadrant. If the there are fewer than three noisy pixels in the level2.evt file, extra rows are filled as -1
| Pixel properties | Quadrant properties | ||||||
|---|---|---|---|---|---|---|---|
| Quadrant | DetID | PixID | Counts | Sigma | Mean | Median | Sigma |
| A | 3 | 14 | 2641283 | 14649.09 | 735 | 714 | 180.3 |
| A | 4 | 249 | 85301 | 469.26 | 735 | 714 | 180.3 |
| A | 3 | 245 | 57748 | 316.41 | 735 | 714 | 180.3 |
| B | 4 | 142 | 306189 | 1979.28 | 719 | 692 | 154.3 |
| B | 5 | 185 | 278370 | 1799.04 | 719 | 692 | 154.3 |
| B | 4 | 206 | 93640 | 602.2 | 719 | 692 | 154.3 |
| C | 15 | 224 | 1362360 | 7046.9 | 707 | 698 | 193.2 |
| C | 6 | 223 | 93295 | 479.21 | 707 | 698 | 193.2 |
| C | 12 | 254 | 79061 | 405.55 | 707 | 698 | 193.2 |
| D | 8 | 160 | 794176 | 3961.68 | 715 | 685 | 200.3 |
| D | 15 | 142 | 167462 | 832.67 | 715 | 685 | 200.3 |
| D | 2 | 252 | 115449 | 572.98 | 715 | 685 | 200.3 |
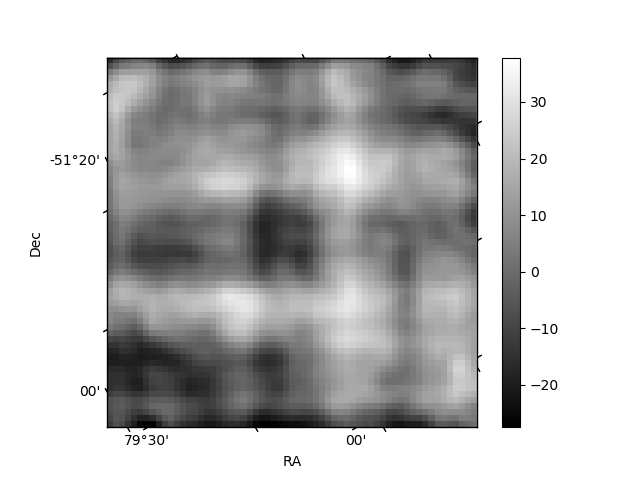
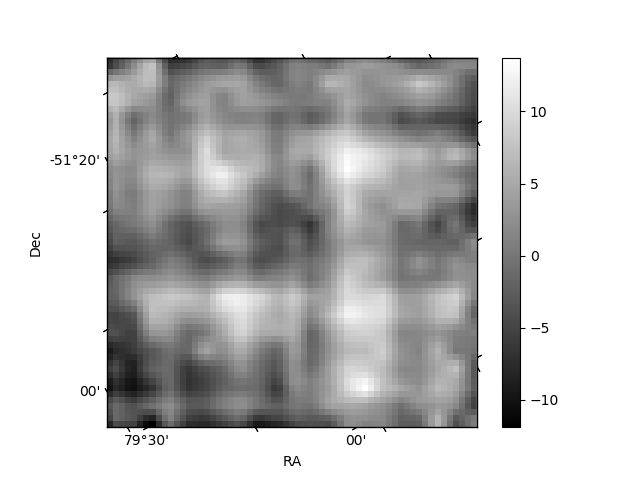
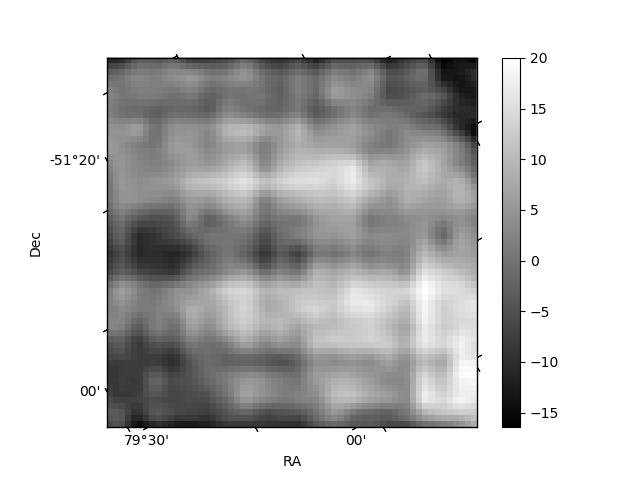
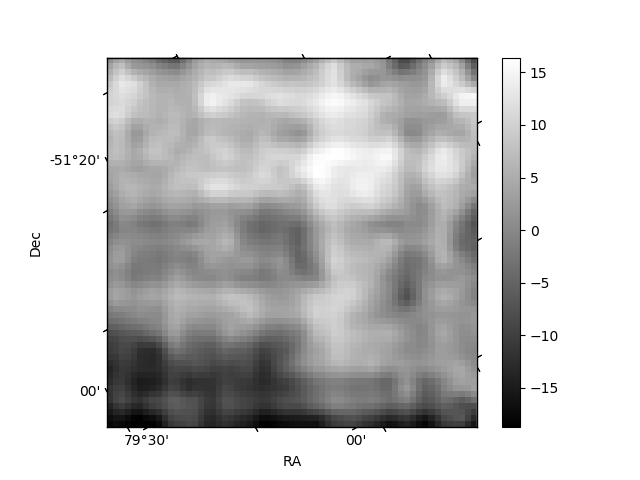
Histogram calculated using DETX and DETY for each event in the final _common_clean file
| Quadrant A | 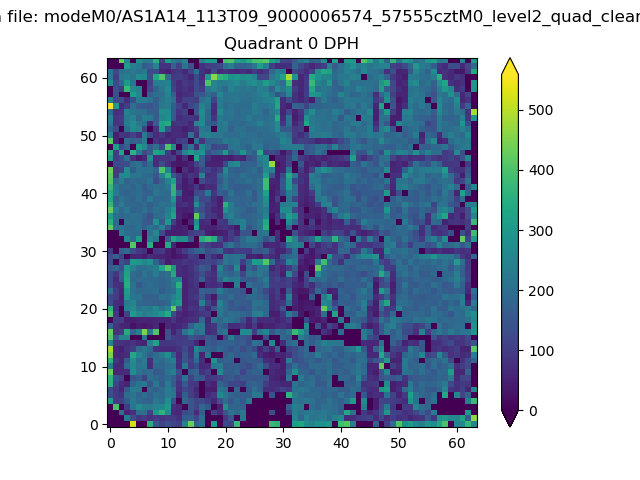 |
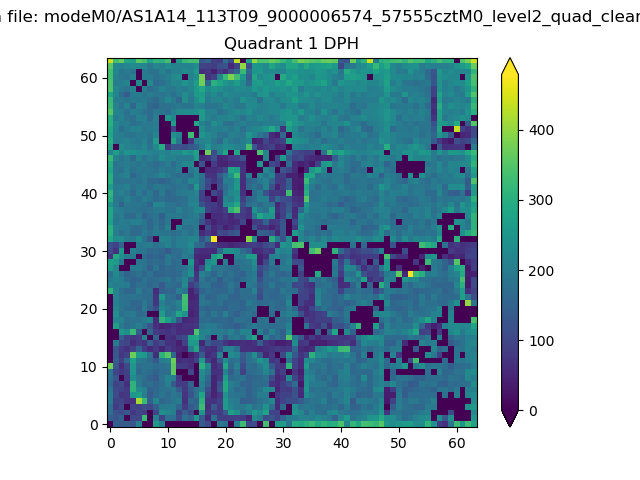 |
Quadrant B |
|---|---|---|---|
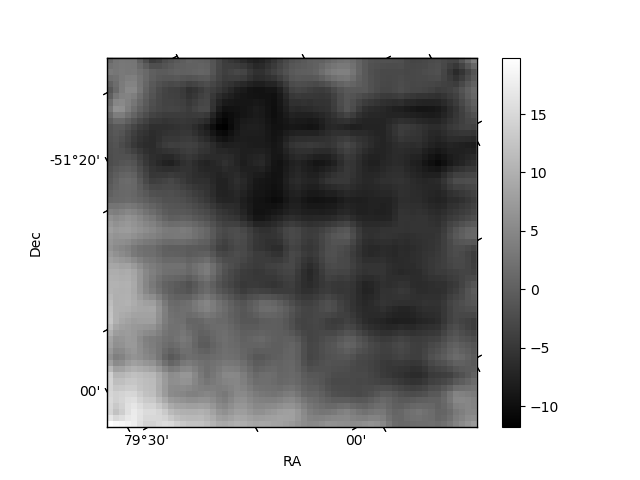
| Quadrant D | 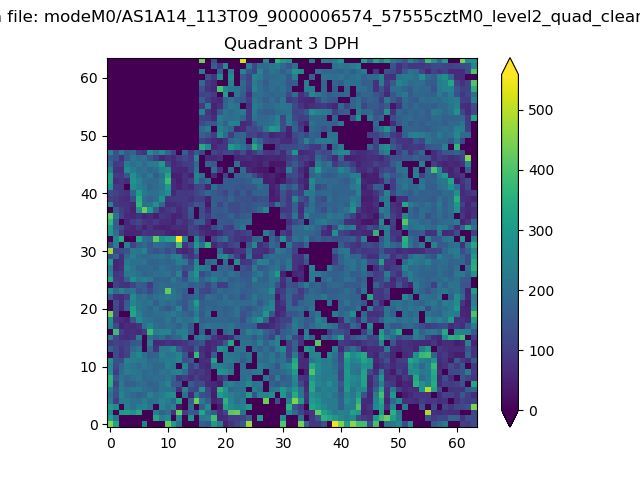 |
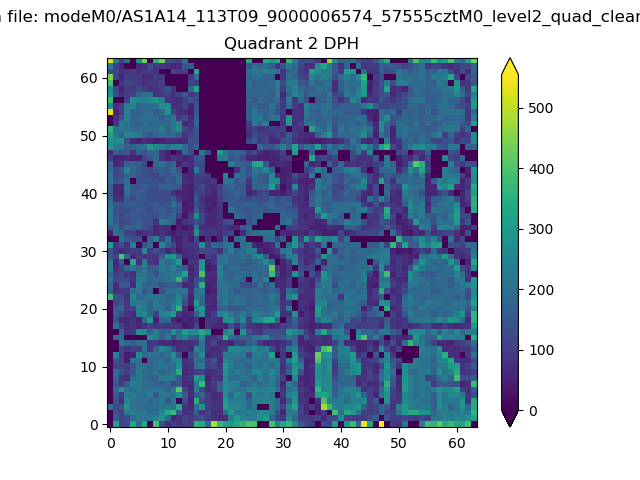 |
Quadrant C |
| Plot type | Count rate plots | Images |
|---|---|---|
| Comparison with Poisson distribution Blue bars denote a histogram of data divided into 1 sec bins. Red curve is a Poisson curve with rate = median count rate of data. |
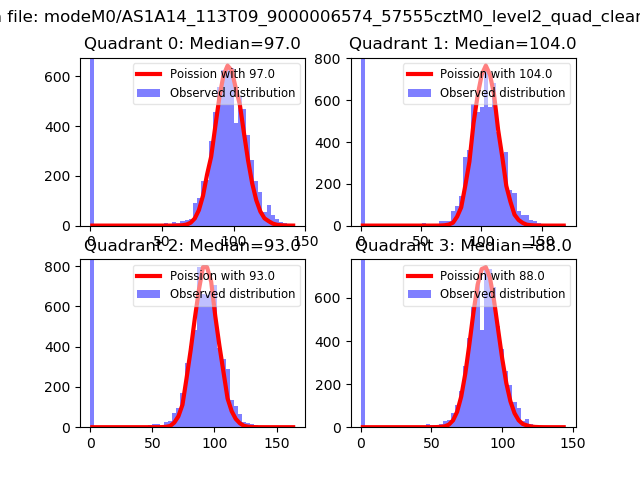 |
 |
| Quadrant-wise count rates Data is divided into 100 sec bins |
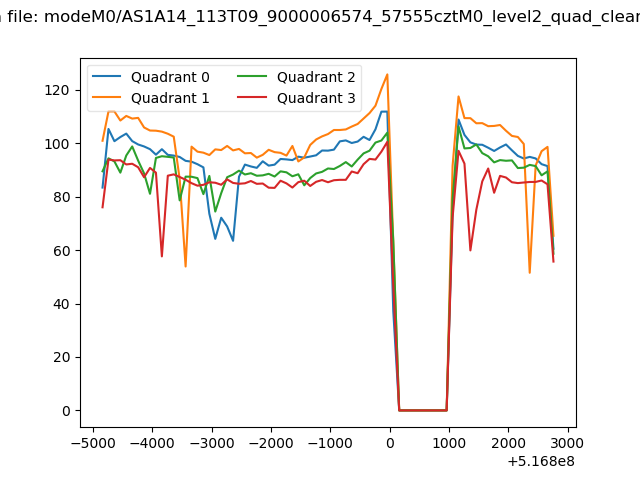 |
|
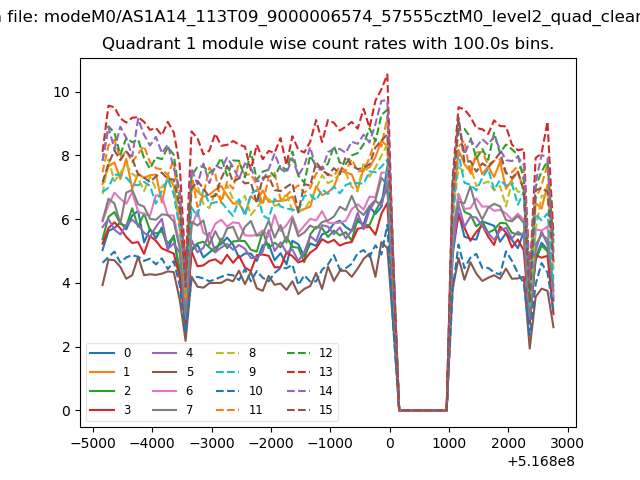
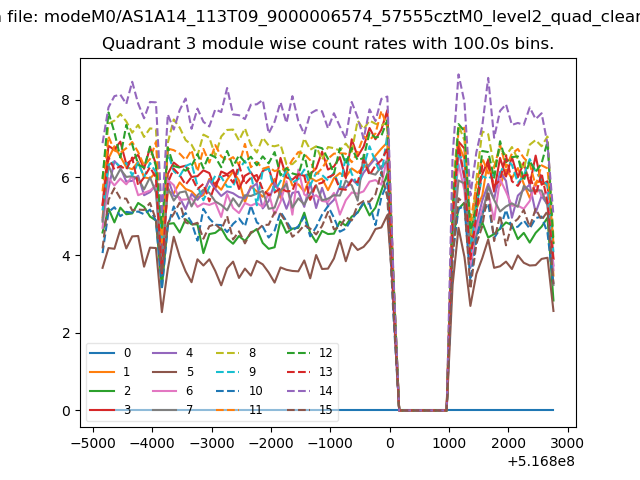
| Module-wise count rates for Quadrant A Data is divided into 100 sec bins |
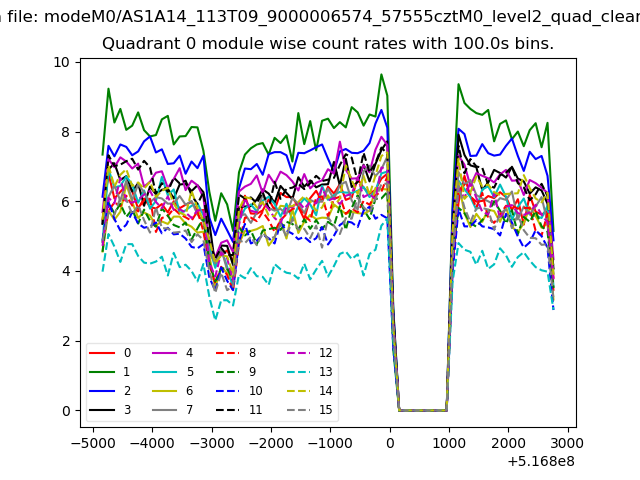 |
 |
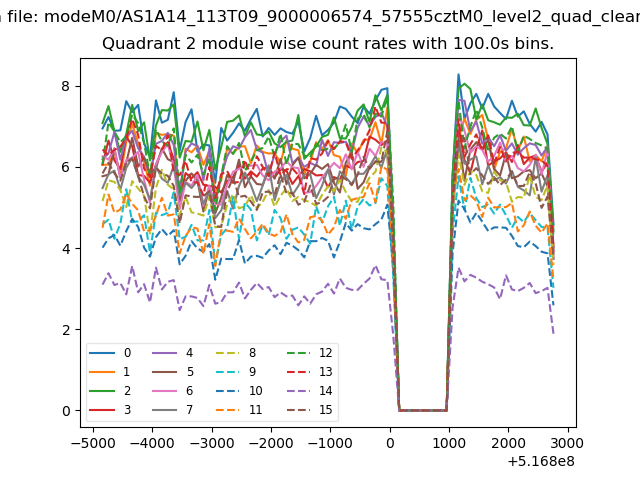
| Module-wise count rates for Quadrant B Data is divided into 100 sec bins |
 |
 |
| Module-wise count rates for Quadrant C Data is divided into 100 sec bins |
 |
 |
| Module-wise count rates for Quadrant D Data is divided into 100 sec bins |
 |
 |
| Parameter | Plot |
|---|---|
| CZT HV Monitor | 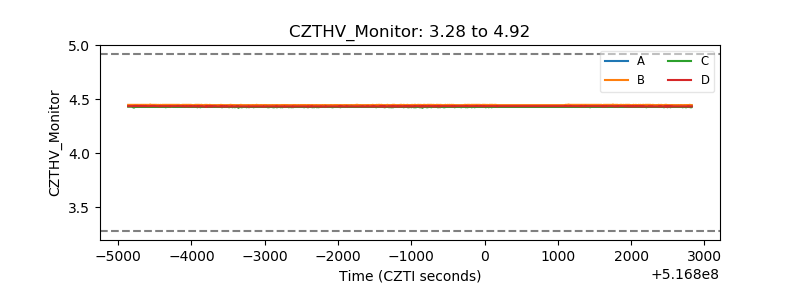 |
| D_VDD | 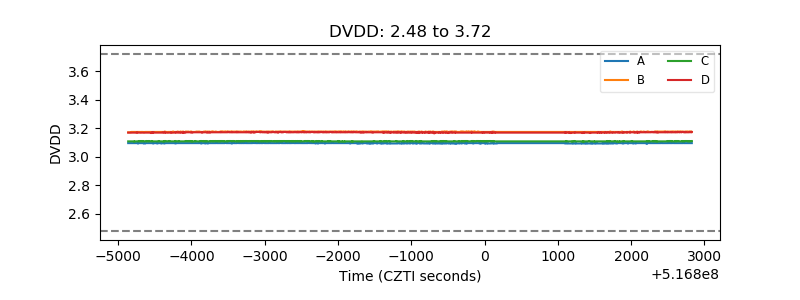 |
| Temperature 1 | 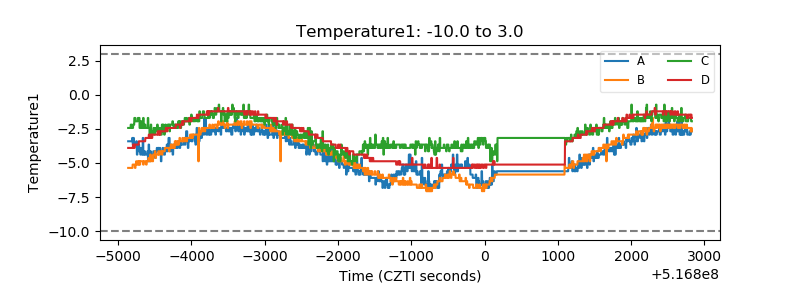 |
| Veto HV Monitor | 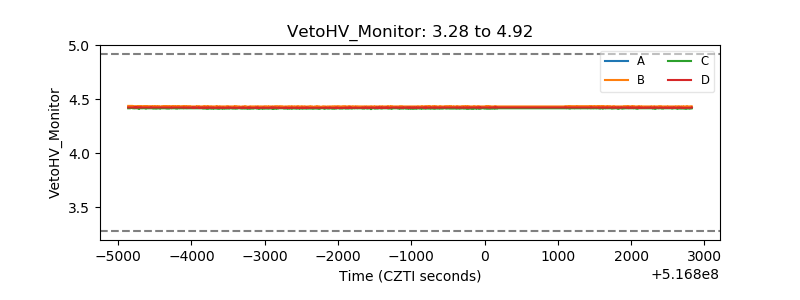 |
| Veto LLD | 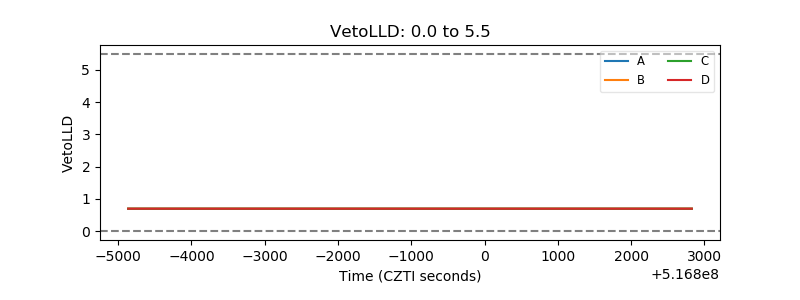 |
| Alpha Counter | 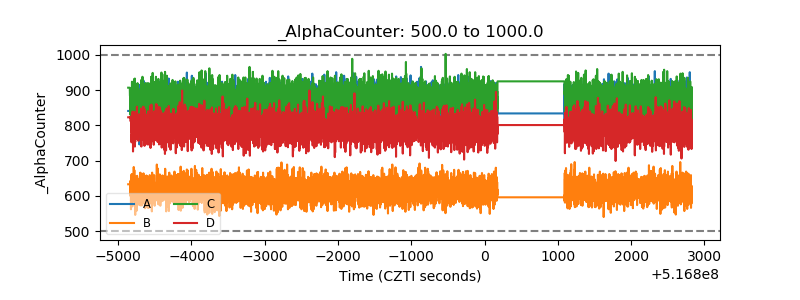 |
| _CPM_Rate | 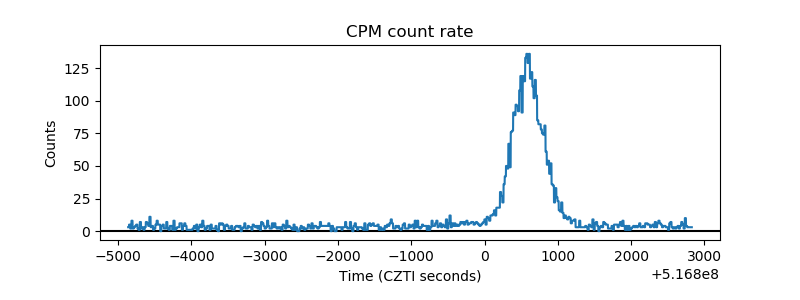 |
| CZT Counter | 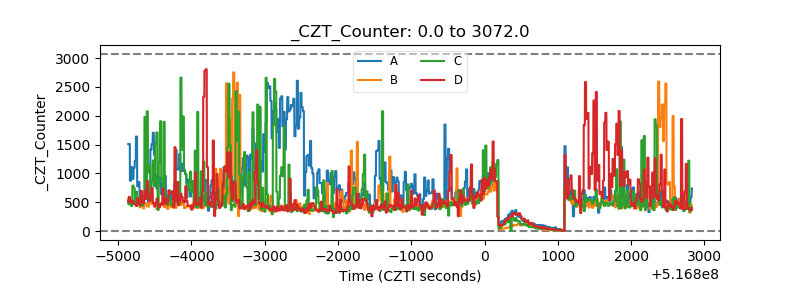 |
| +2.5 Volts monitor |  |
| +5 Volts monitor |  |
| _ROLL_ROT | 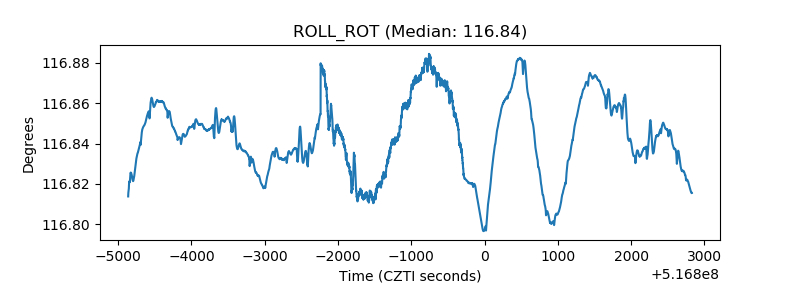 |
| _Roll_DEC | 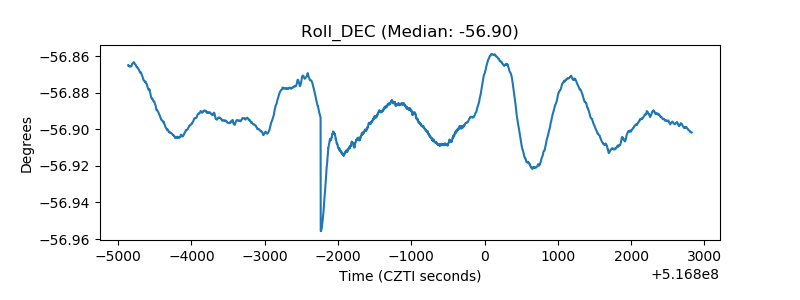 |
| _Roll_RA | 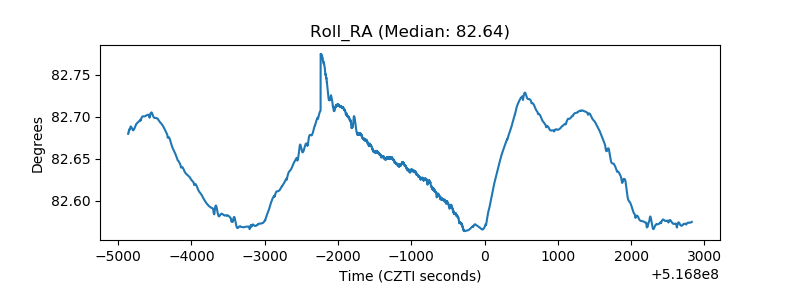 |
| Veto Counter | 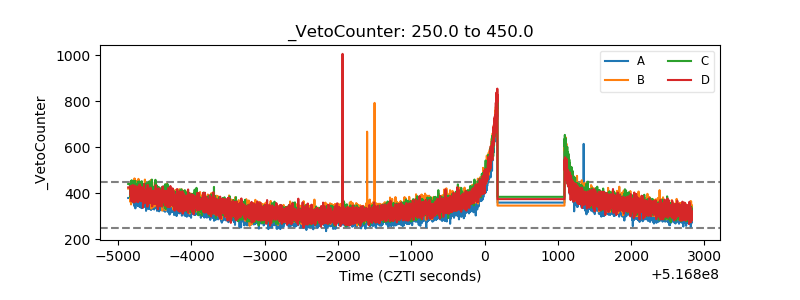 |