| Param | Original file | Final file |
|---|---|---|
| Filename | modeM0/AS1A14_113T09_9000006574_57558cztM0_level2.fits | modeM0/AS1A14_113T09_9000006574_57558cztM0_level2_quad_clean.evt |
| Size (bytes) | 650,384,640 | 101,401,920 |
| Size | 620.3 MB | 96.7 MB |
| Events in quadrant A | 4,043,517 | 698,827 |
| Events in quadrant B | 3,681,164 | 750,169 |
| Events in quadrant C | 6,052,820 | 637,224 |
| Events in quadrant D | 9,719,217 | 465,225 |
| Mode SS | |||
|---|---|---|---|
| Quadrant | BADHDUFLAG | Total packets | Discarded packets |
| A | 0 | 148 | 0 |
| B | 0 | 148 | 0 |
| C | 0 | 148 | 0 |
| D | 0 | 148 | 0 |
| Mode M0 | |||
|---|---|---|---|
| Quadrant | BADHDUFLAG | Total packets | Discarded packets |
| A | 0 | 17191 | 0 |
| B | 0 | 16330 | 0 |
| C | 0 | 23216 | 0 |
| D | 0 | 34091 | 0 |
| Quadrant | Total seconds | Saturated seconds | Saturation percentage |
|---|---|---|---|
| A | 7457 | 103 | 1.381253% |
| B | 7458 | 54 | 0.724055% |
| C | 7458 | 560 | 7.508715% |
| D | 7458 | 2192 | 29.391258% |
Noise dominated data is calculated using 1-second bins in cleaned event files. If a bin has >2000 counts, and if more than 50% of those come from <1% of pixels, then it is considered to be noise-dominated and hence unusable.
| Quadrant | # 1 sec bins | Bins with >0 counts | Bins with >2000 counts | High rate bins dominated by noise | Noise dominated (total time) | Noise dominated (detector-on time) | Marked lightcurve |
|---|---|---|---|---|---|---|---|
| A | 7456 | 7456 | 86 | 86 | 1.15% | 1.15% | 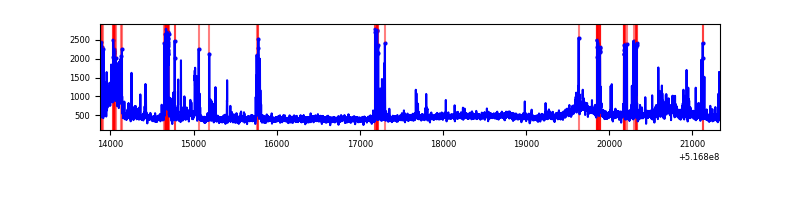 |
| B | 7457 | 7457 | 22 | 22 | 0.30% | 0.30% | 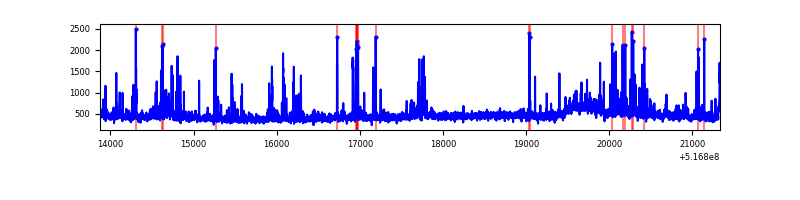 |
| C | 7457 | 7457 | 537 | 537 | 7.20% | 7.20% | 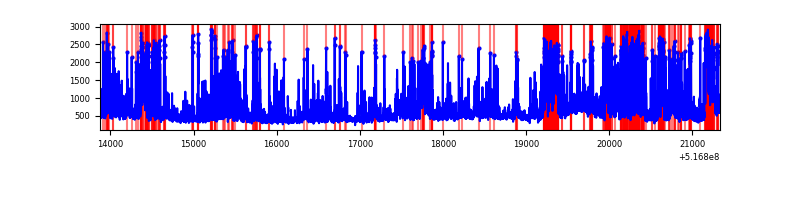 |
| D | 7457 | 7457 | 2316 | 2316 | 31.06% | 31.06% | 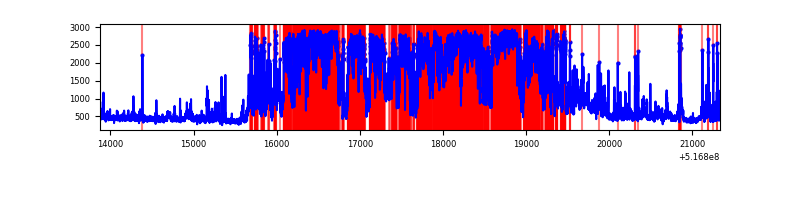 |
Top three noisy pixels from each quadrant. If the there are fewer than three noisy pixels in the level2.evt file, extra rows are filled as -1
| Pixel properties | Quadrant properties | ||||||
|---|---|---|---|---|---|---|---|
| Quadrant | DetID | PixID | Counts | Sigma | Mean | Median | Sigma |
| A | 3 | 14 | 416030 | 2127.02 | 798 | 776 | 195.2 |
| A | 10 | 251 | 335110 | 1712.53 | 798 | 776 | 195.2 |
| A | 8 | 249 | 109039 | 554.55 | 798 | 776 | 195.2 |
| B | 10 | 247 | 144391 | 838.72 | 791 | 761 | 171.2 |
| B | 4 | 206 | 115507 | 670.05 | 791 | 761 | 171.2 |
| B | 0 | 245 | 71082 | 410.63 | 791 | 761 | 171.2 |
| C | 15 | 224 | 2222117 | 10958.1 | 752 | 747 | 202.7 |
| C | 12 | 254 | 290934 | 1431.5 | 752 | 747 | 202.7 |
| C | 14 | 254 | 212685 | 1045.5 | 752 | 747 | 202.7 |
| D | 15 | 142 | 6254752 | 32401.37 | 676 | 645 | 193.0 |
| D | 2 | 252 | 271125 | 1401.31 | 676 | 645 | 193.0 |
| D | 2 | 249 | 174359 | 899.98 | 676 | 645 | 193.0 |
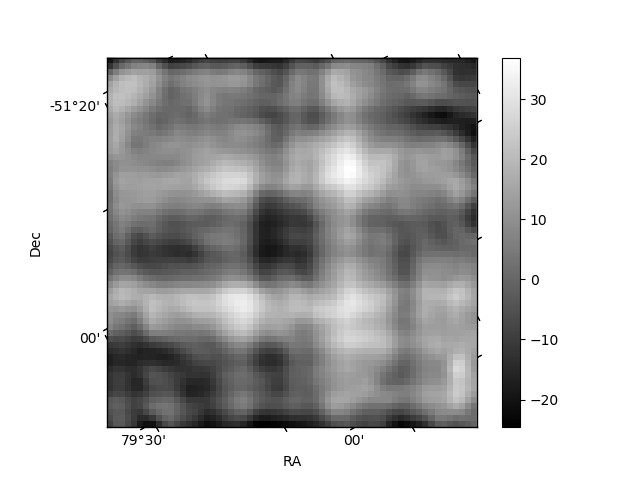
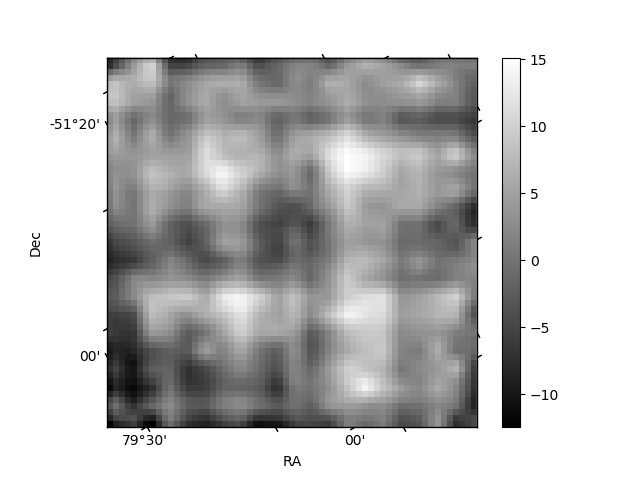
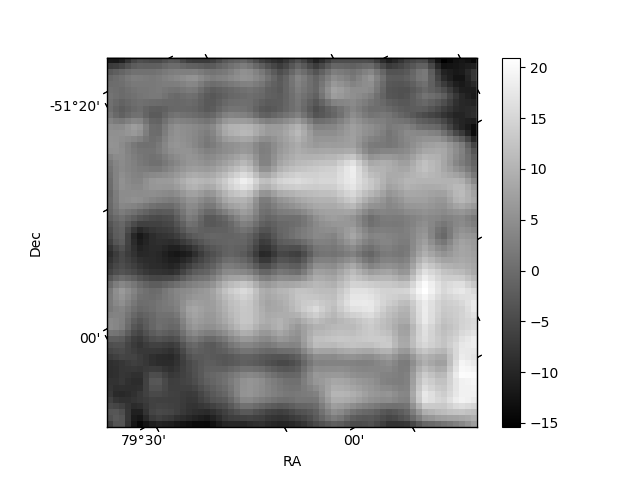
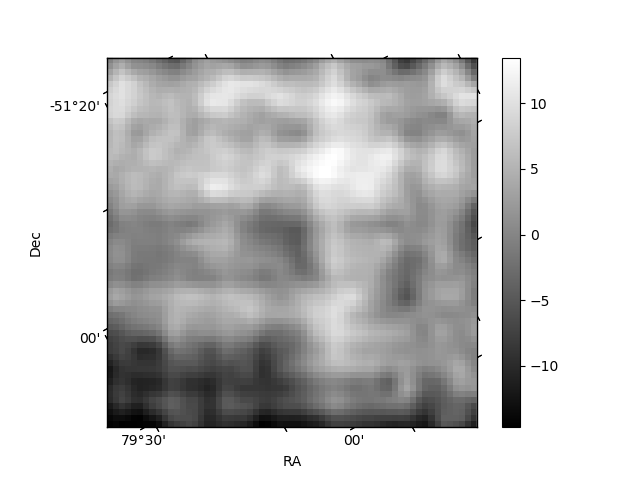
Histogram calculated using DETX and DETY for each event in the final _common_clean file
| Quadrant A | 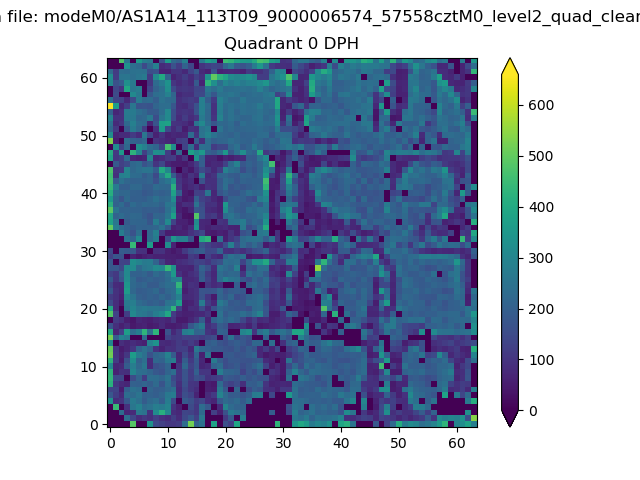 |
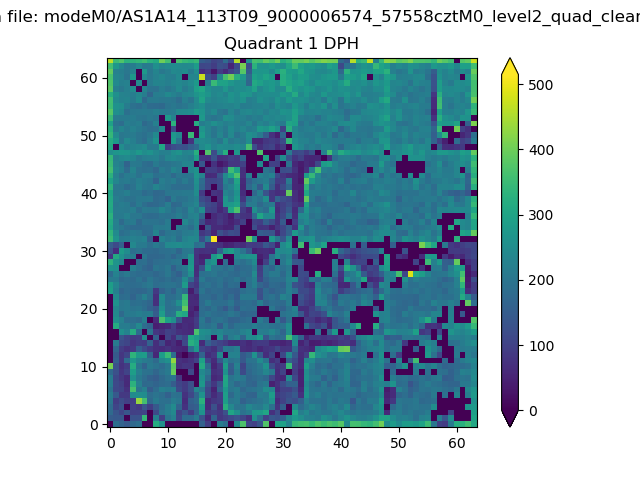 |
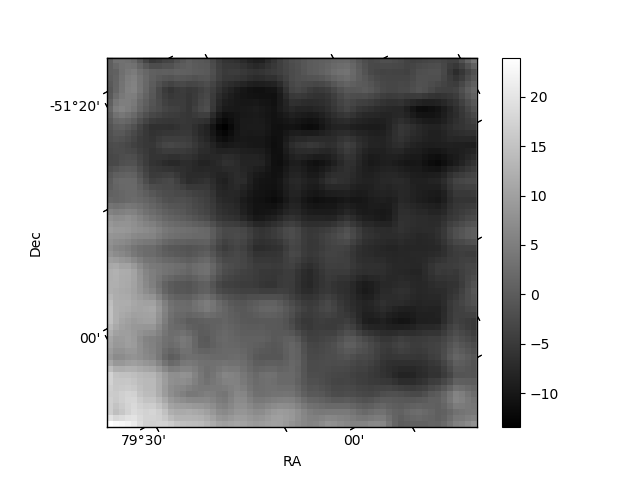
Quadrant B |
|---|---|---|---|
| Quadrant D | 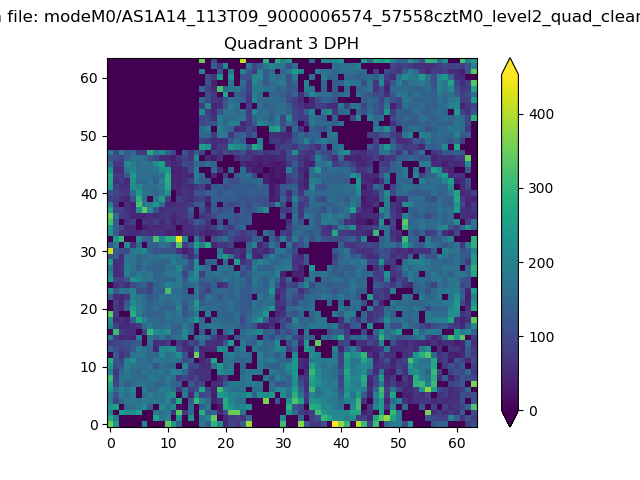 |
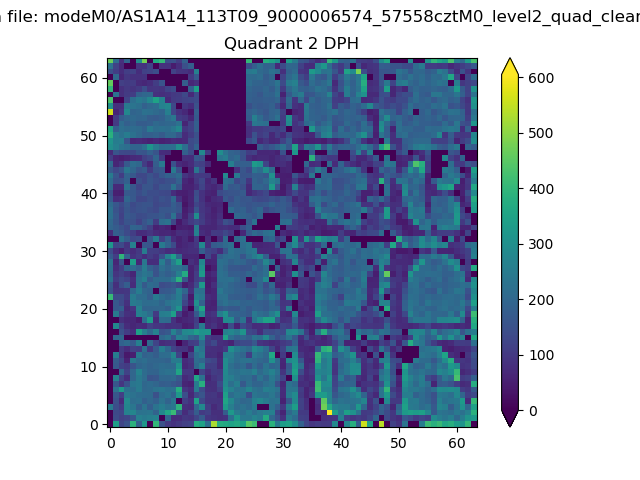 |
Quadrant C |
| Plot type | Count rate plots | Images |
|---|---|---|
| Comparison with Poisson distribution Blue bars denote a histogram of data divided into 1 sec bins. Red curve is a Poisson curve with rate = median count rate of data. |
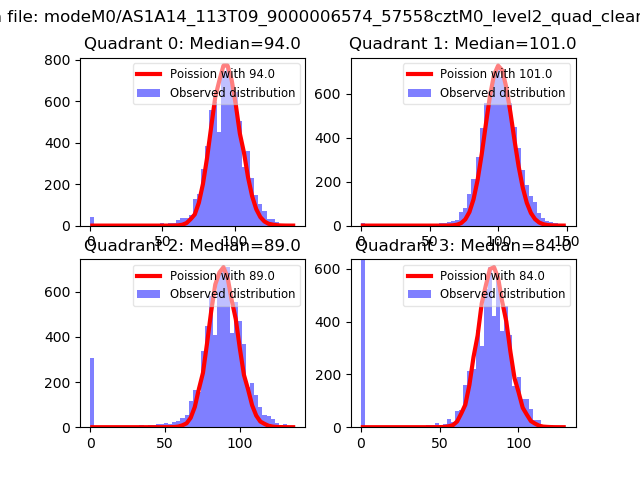 |
 |
| Quadrant-wise count rates Data is divided into 100 sec bins |
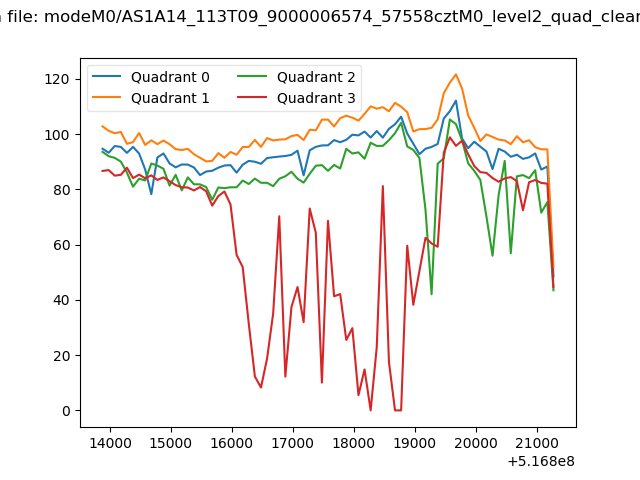 |
|
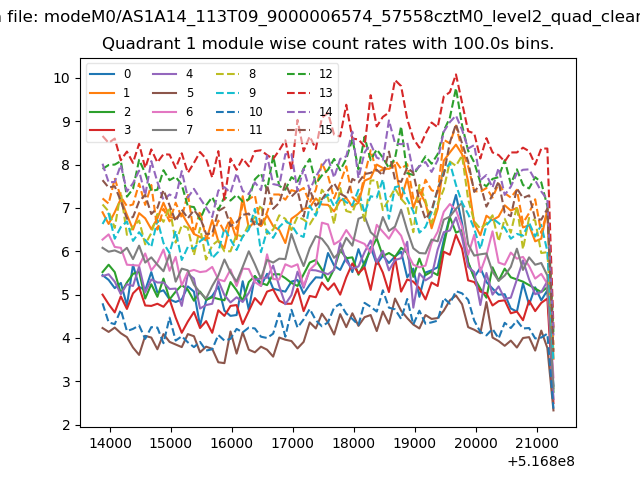
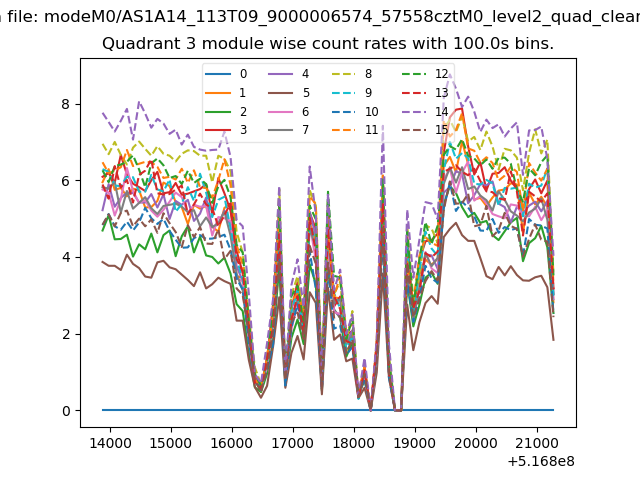
| Module-wise count rates for Quadrant A Data is divided into 100 sec bins |
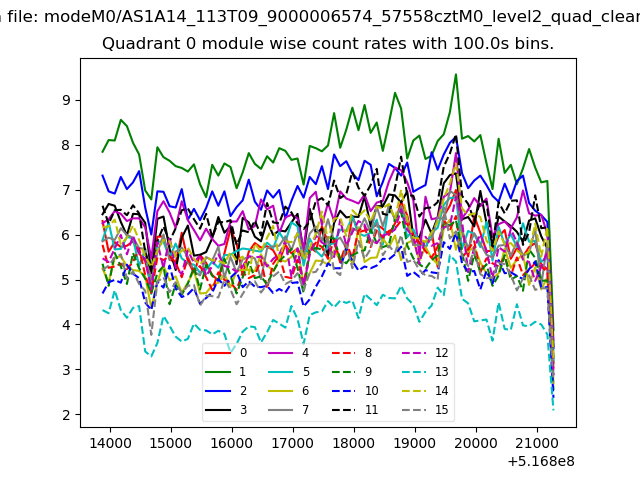 |
 |
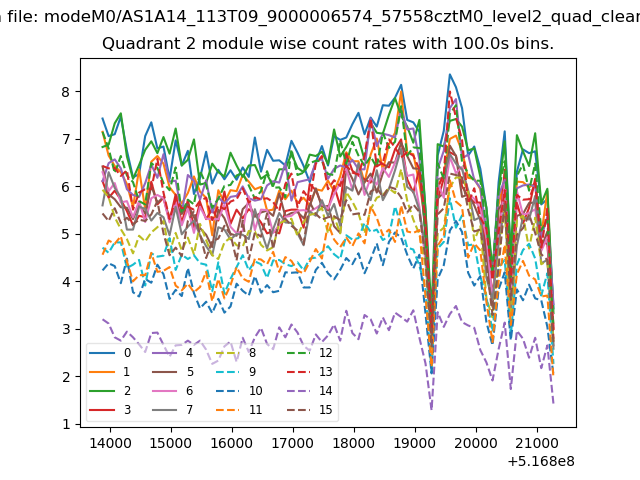
| Module-wise count rates for Quadrant B Data is divided into 100 sec bins |
 |
 |
| Module-wise count rates for Quadrant C Data is divided into 100 sec bins |
 |
 |
| Module-wise count rates for Quadrant D Data is divided into 100 sec bins |
 |
 |
| Parameter | Plot |
|---|---|
| CZT HV Monitor | 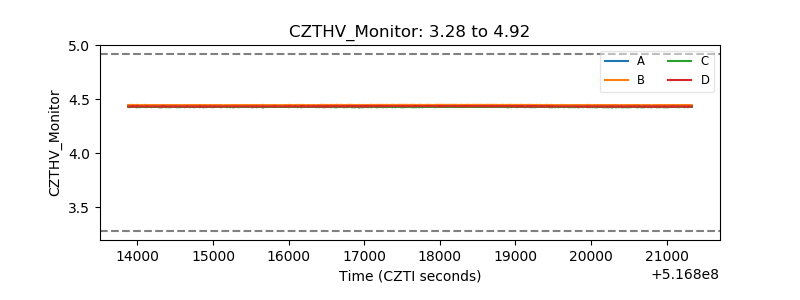 |
| D_VDD | 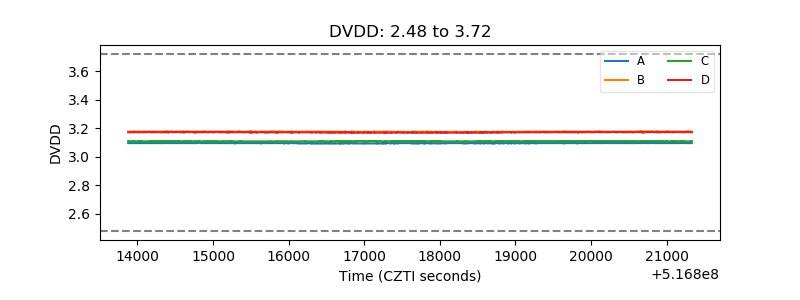 |
| Temperature 1 | 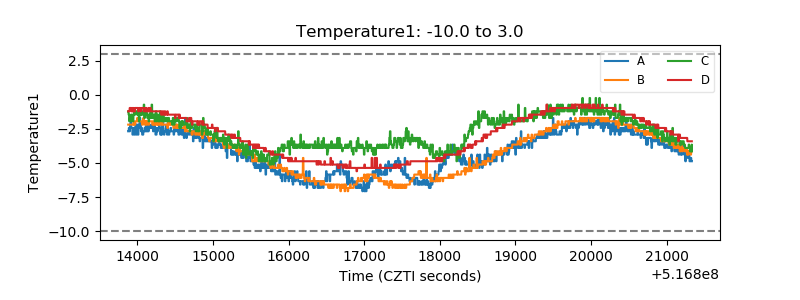 |
| Veto HV Monitor |  |
| Veto LLD | 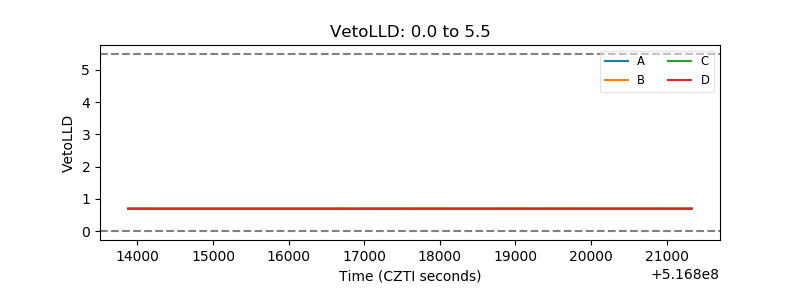 |
| Alpha Counter | 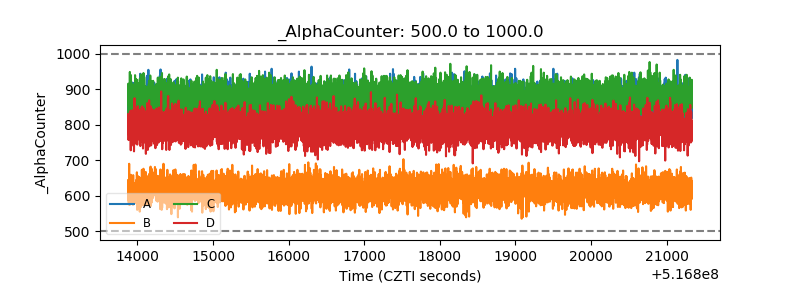 |
| _CPM_Rate | 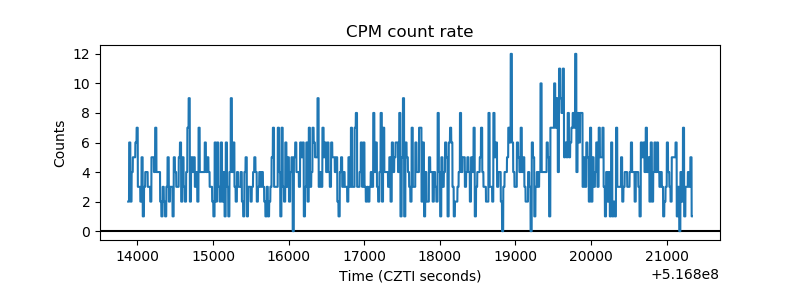 |
| CZT Counter | 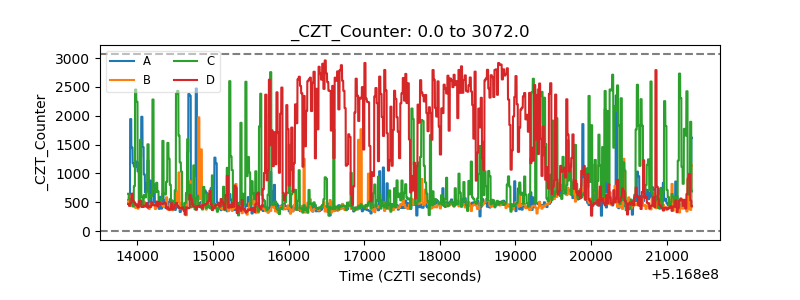 |
| +2.5 Volts monitor |  |
| +5 Volts monitor |  |
| _ROLL_ROT | 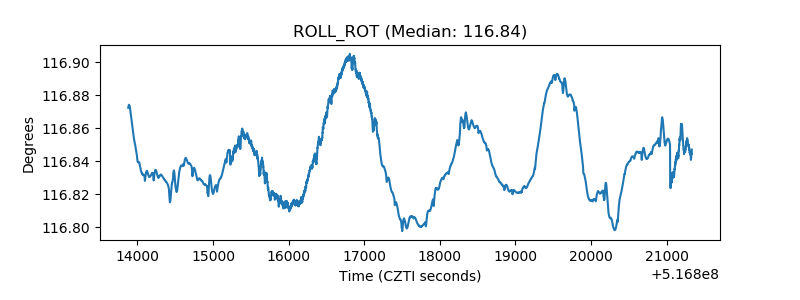 |
| _Roll_DEC | 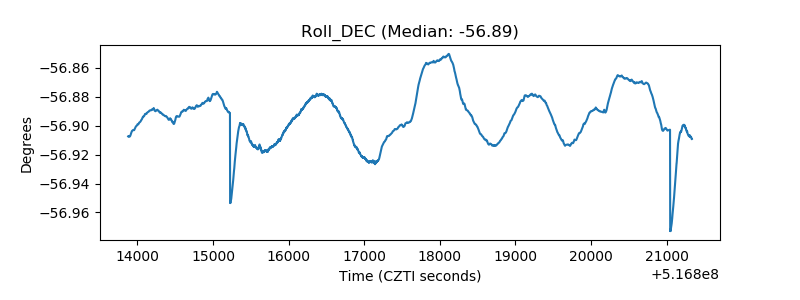 |
| _Roll_RA | 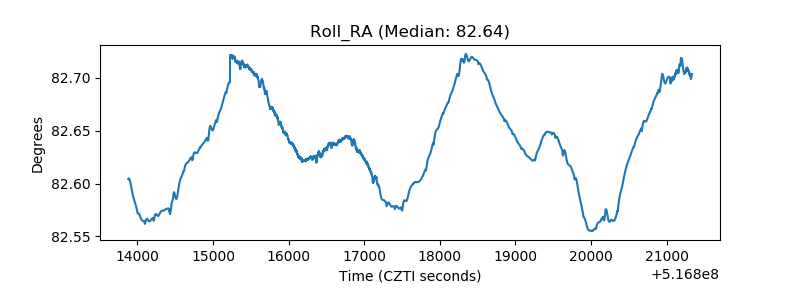 |
| Veto Counter | 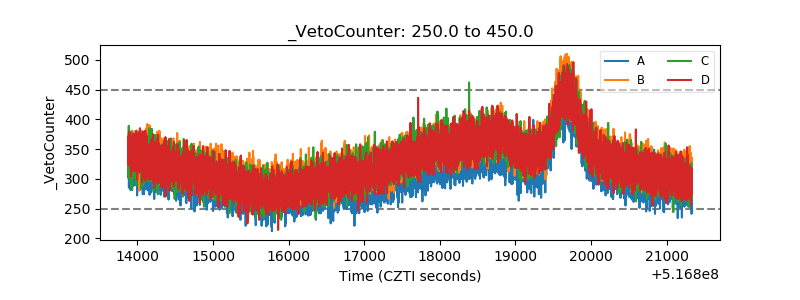 |