| Param | Original file | Final file |
|---|---|---|
| Filename | modeM0/AS1A14_113T09_9000006574_57559cztM0_level2.fits | modeM0/AS1A14_113T09_9000006574_57559cztM0_level2_quad_clean.evt |
| Size (bytes) | 542,013,120 | 106,231,680 |
| Size | 516.9 MB | 101.3 MB |
| Events in quadrant A | 3,704,590 | 702,257 |
| Events in quadrant B | 3,642,641 | 742,120 |
| Events in quadrant C | 6,320,017 | 632,203 |
| Events in quadrant D | 5,817,467 | 620,970 |
| Mode SS | |||
|---|---|---|---|
| Quadrant | BADHDUFLAG | Total packets | Discarded packets |
| A | 0 | 148 | 0 |
| B | 0 | 148 | 0 |
| C | 0 | 148 | 0 |
| D | 0 | 148 | 0 |
| Mode M0 | |||
|---|---|---|---|
| Quadrant | BADHDUFLAG | Total packets | Discarded packets |
| A | 0 | 16189 | 0 |
| B | 0 | 16155 | 0 |
| C | 0 | 23998 | 0 |
| D | 0 | 22377 | 0 |
| Quadrant | Total seconds | Saturated seconds | Saturation percentage |
|---|---|---|---|
| A | 7459 | 94 | 1.260223% |
| B | 7459 | 156 | 2.091433% |
| C | 7459 | 610 | 8.178040% |
| D | 7460 | 311 | 4.168901% |
Noise dominated data is calculated using 1-second bins in cleaned event files. If a bin has >2000 counts, and if more than 50% of those come from <1% of pixels, then it is considered to be noise-dominated and hence unusable.
| Quadrant | # 1 sec bins | Bins with >0 counts | Bins with >2000 counts | High rate bins dominated by noise | Noise dominated (total time) | Noise dominated (detector-on time) | Marked lightcurve |
|---|---|---|---|---|---|---|---|
| A | 7458 | 7458 | 43 | 43 | 0.58% | 0.58% | 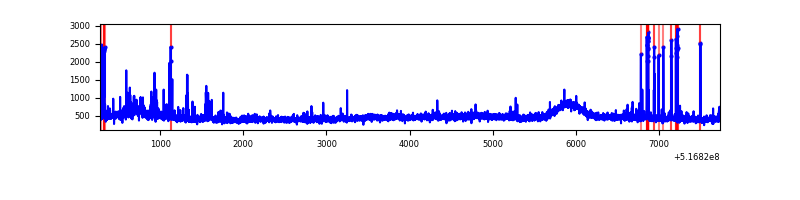 |
| B | 7458 | 7458 | 31 | 31 | 0.42% | 0.42% | 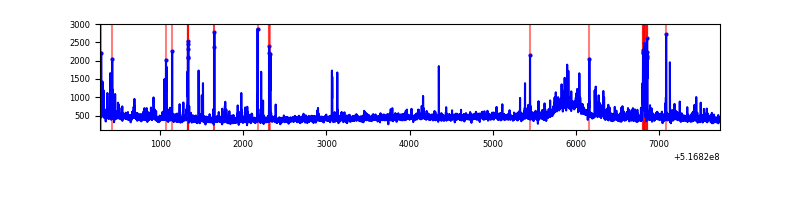 |
| C | 7458 | 7458 | 573 | 573 | 7.68% | 7.68% | 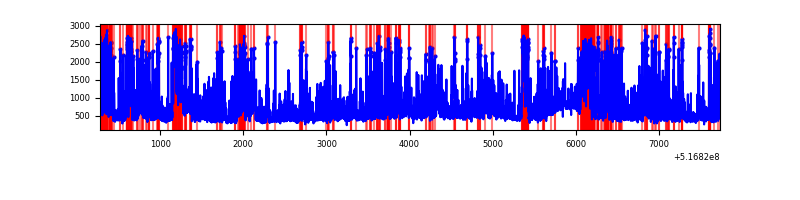 |
| D | 7459 | 7459 | 315 | 315 | 4.22% | 4.22% | 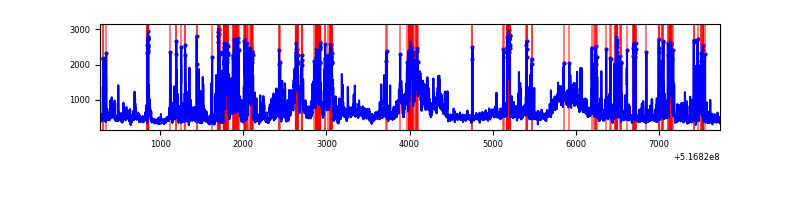 |
Top three noisy pixels from each quadrant. If the there are fewer than three noisy pixels in the level2.evt file, extra rows are filled as -1
| Pixel properties | Quadrant properties | ||||||
|---|---|---|---|---|---|---|---|
| Quadrant | DetID | PixID | Counts | Sigma | Mean | Median | Sigma |
| A | 3 | 14 | 228655 | 1136.14 | 811 | 788 | 200.6 |
| A | 10 | 251 | 127036 | 629.47 | 811 | 788 | 200.6 |
| A | 8 | 249 | 87778 | 433.73 | 811 | 788 | 200.6 |
| B | 4 | 206 | 176816 | 1019.53 | 799 | 770 | 172.7 |
| B | 10 | 247 | 52219 | 297.95 | 799 | 770 | 172.7 |
| B | 0 | 245 | 46717 | 266.09 | 799 | 770 | 172.7 |
| C | 15 | 224 | 2219607 | 10825.82 | 759 | 751 | 205.0 |
| C | 12 | 254 | 549860 | 2679.11 | 759 | 751 | 205.0 |
| C | 14 | 254 | 226103 | 1099.49 | 759 | 751 | 205.0 |
| D | 15 | 142 | 1236023 | 5641.52 | 774 | 741 | 219.0 |
| D | 2 | 249 | 375630 | 1712.12 | 774 | 741 | 219.0 |
| D | 8 | 160 | 234960 | 1069.68 | 774 | 741 | 219.0 |
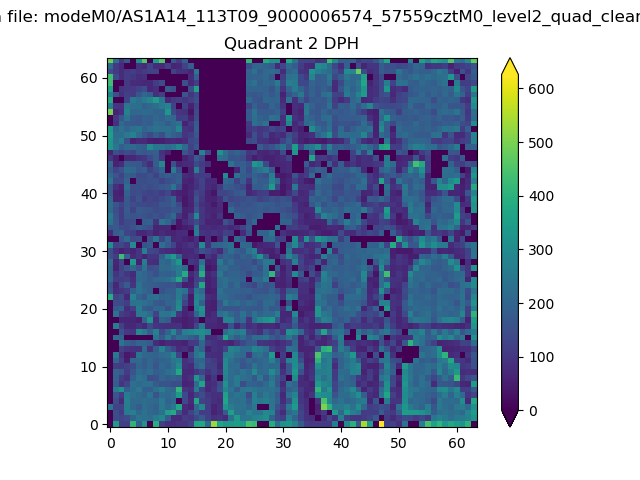
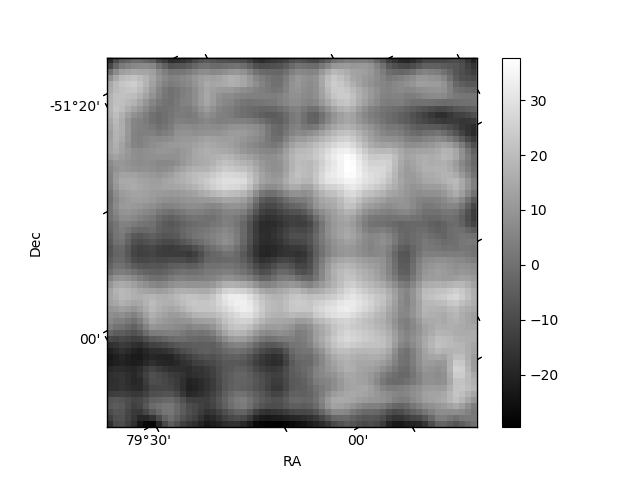
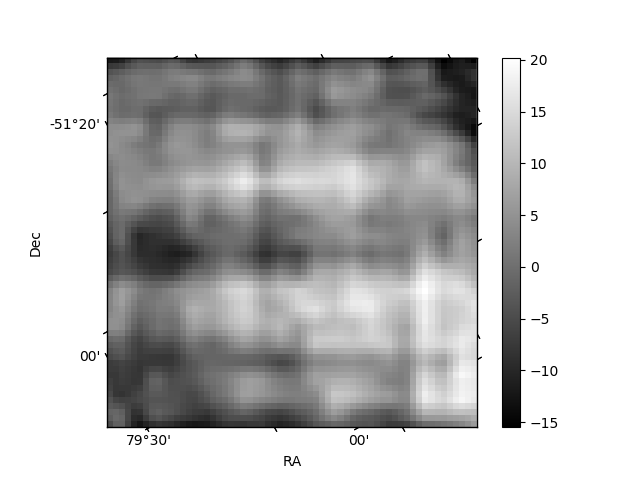
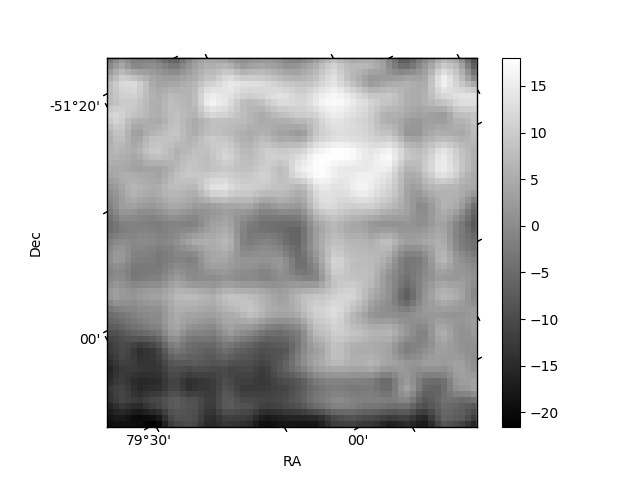
Histogram calculated using DETX and DETY for each event in the final _common_clean file
| Quadrant A | 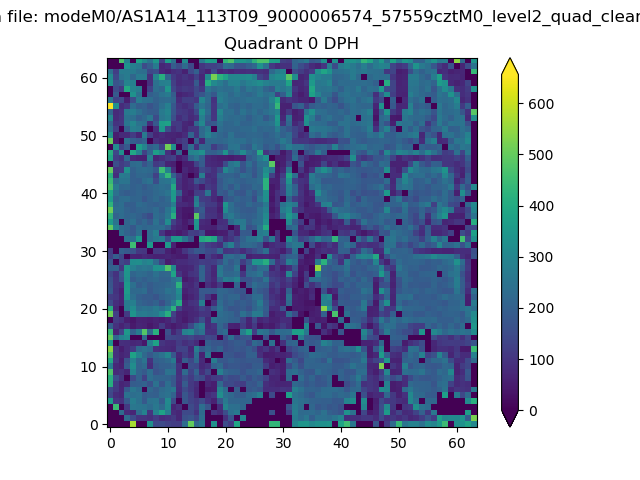 |
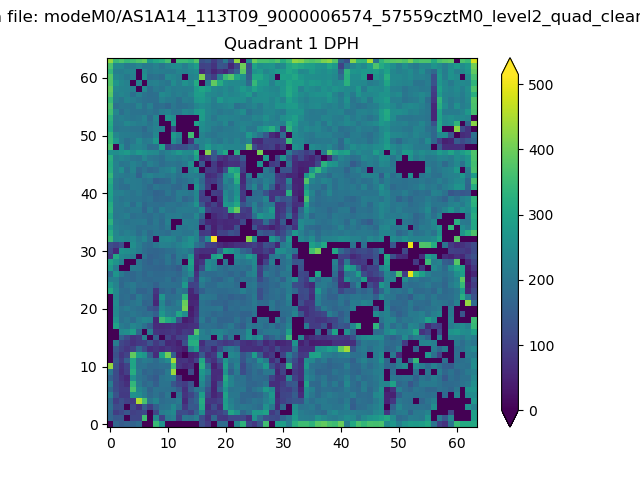 |
Quadrant B |
|---|---|---|---|
| Quadrant D | 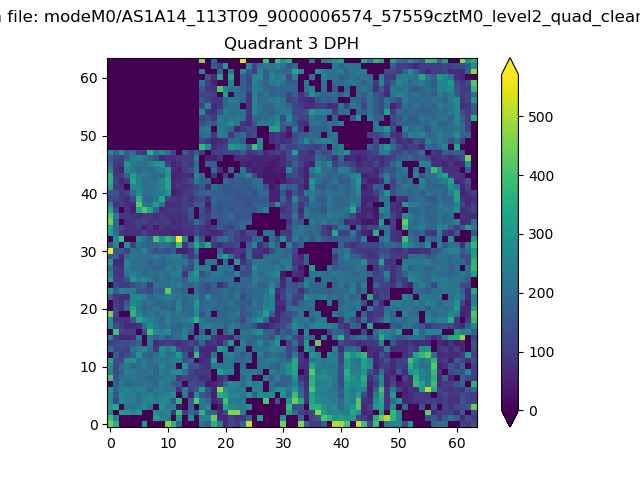 |
 |
Quadrant C |
| Plot type | Count rate plots | Images |
|---|---|---|
| Comparison with Poisson distribution Blue bars denote a histogram of data divided into 1 sec bins. Red curve is a Poisson curve with rate = median count rate of data. |
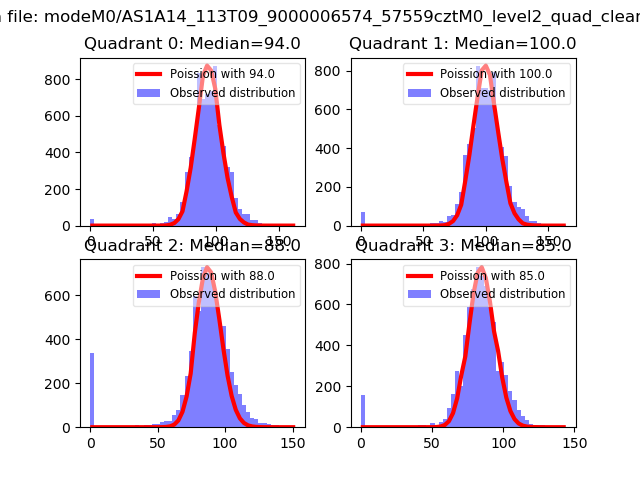 |
 |
| Quadrant-wise count rates Data is divided into 100 sec bins |
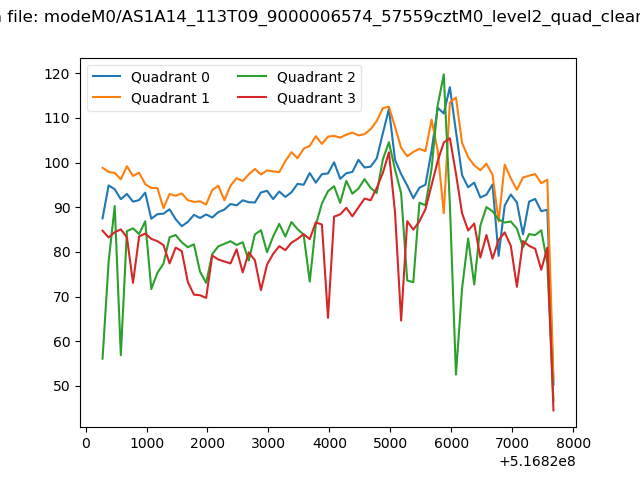 |
|
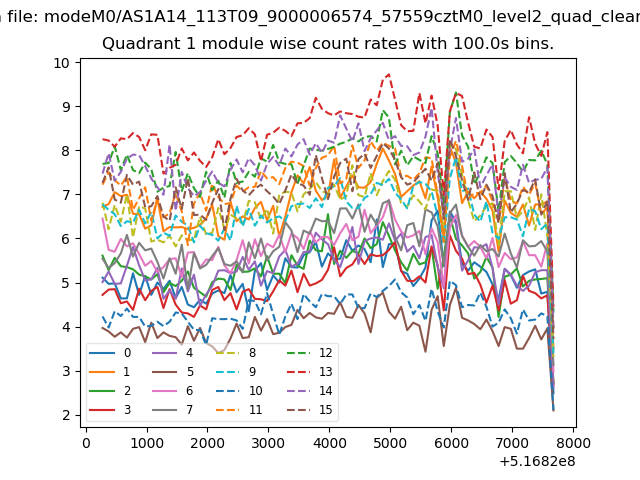
| Module-wise count rates for Quadrant A Data is divided into 100 sec bins |
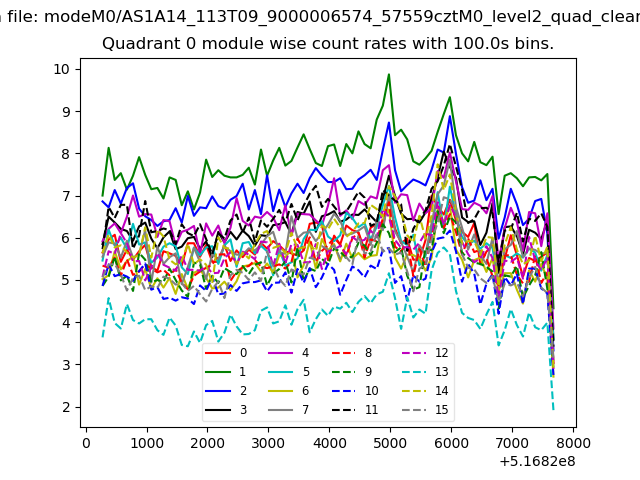 |
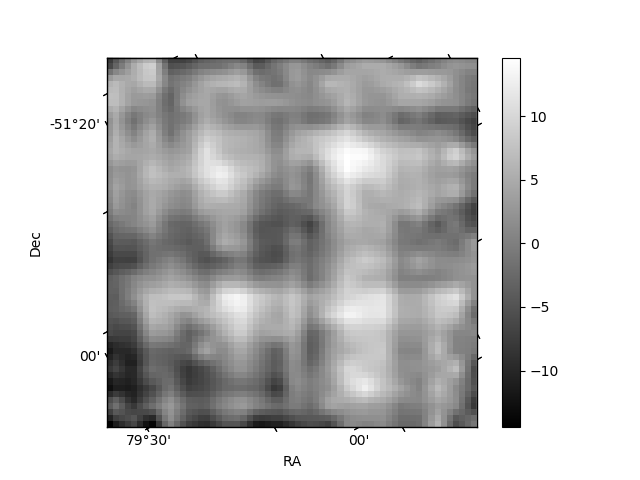 |
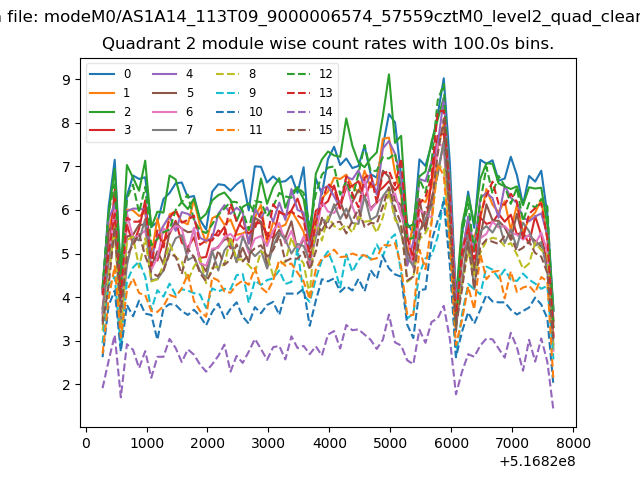
| Module-wise count rates for Quadrant B Data is divided into 100 sec bins |
 |
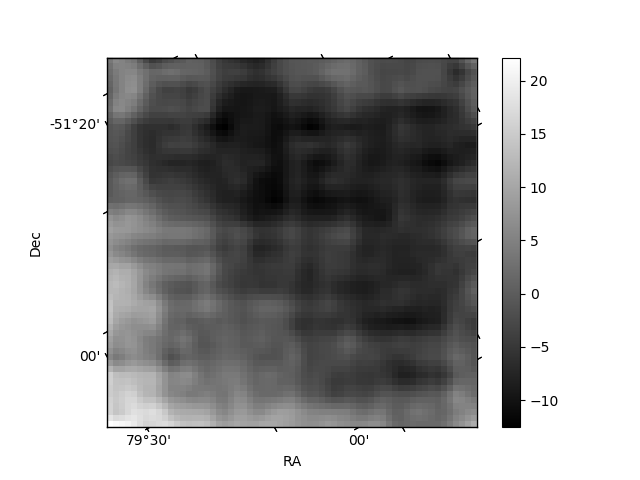 |
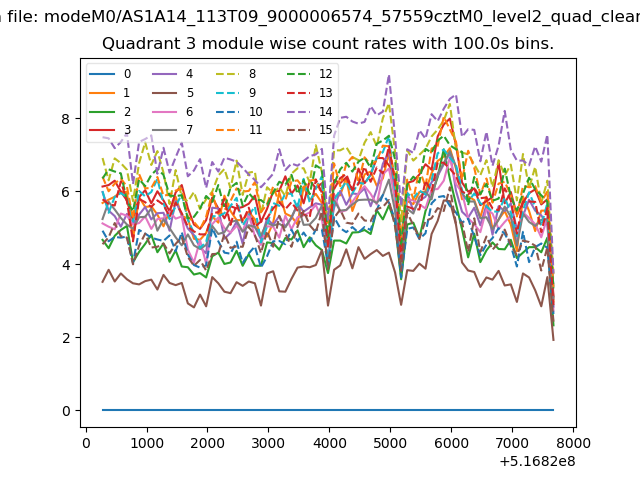
| Module-wise count rates for Quadrant C Data is divided into 100 sec bins |
 |
 |
| Module-wise count rates for Quadrant D Data is divided into 100 sec bins |
 |
 |
| Parameter | Plot |
|---|---|
| CZT HV Monitor | 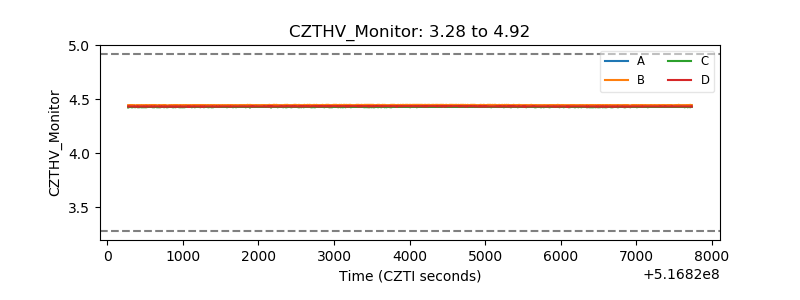 |
| D_VDD | 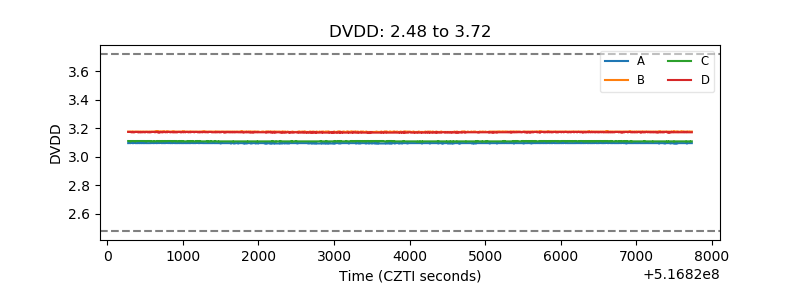 |
| Temperature 1 | 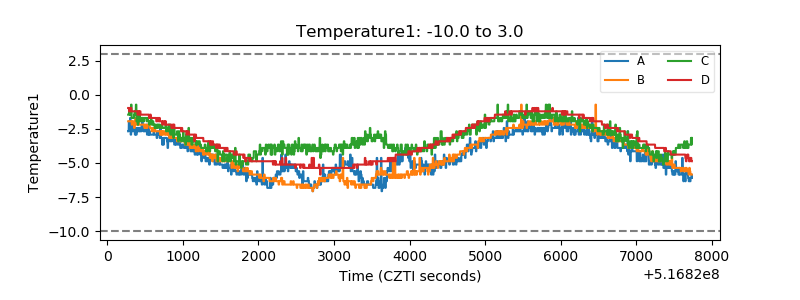 |
| Veto HV Monitor | 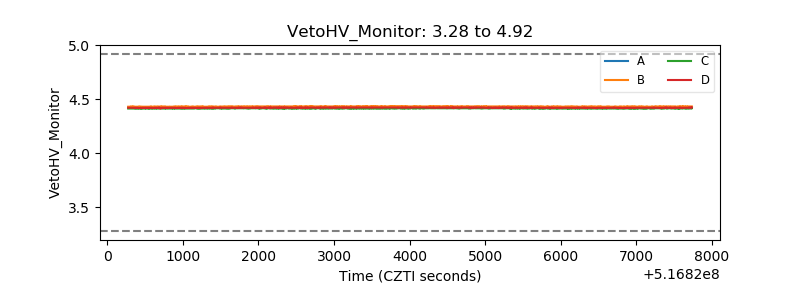 |
| Veto LLD | 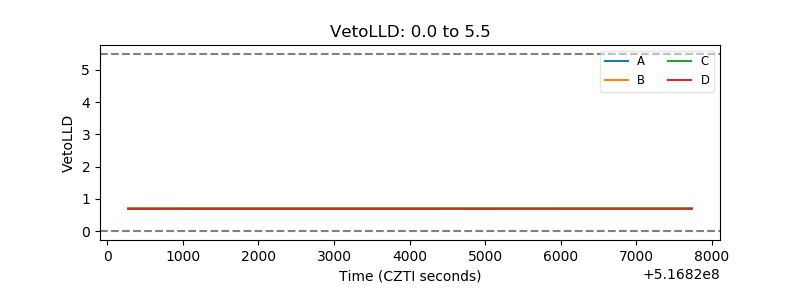 |
| Alpha Counter | 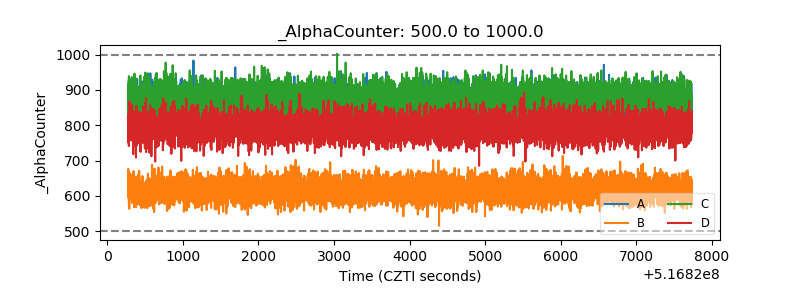 |
| _CPM_Rate | 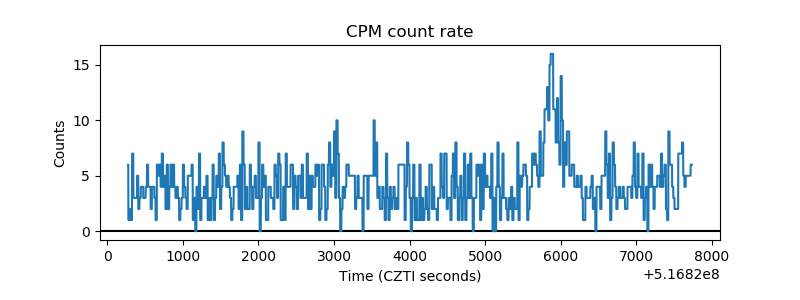 |
| CZT Counter | 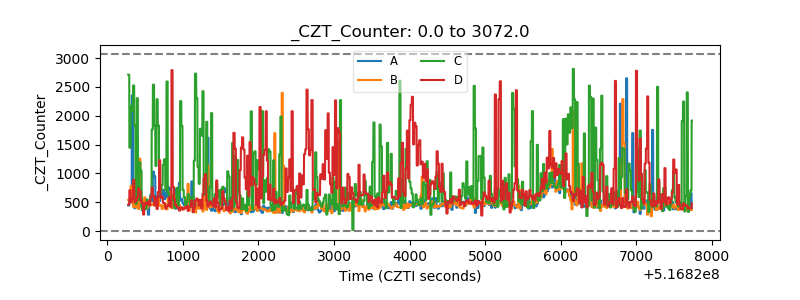 |
| +2.5 Volts monitor | 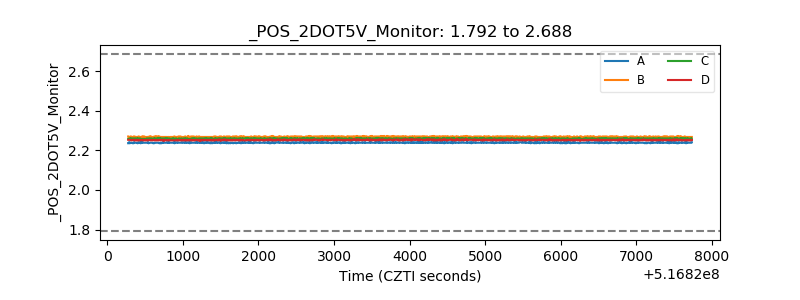 |
| +5 Volts monitor |  |
| _ROLL_ROT | 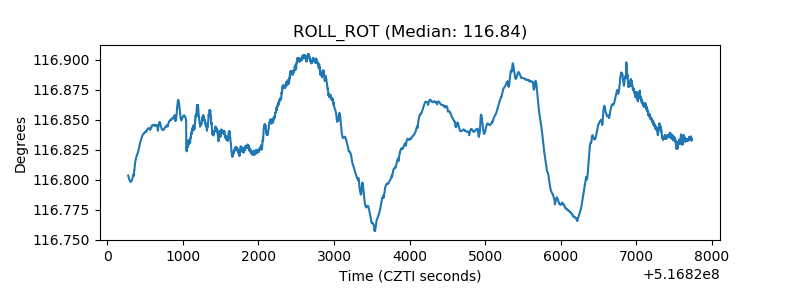 |
| _Roll_DEC | 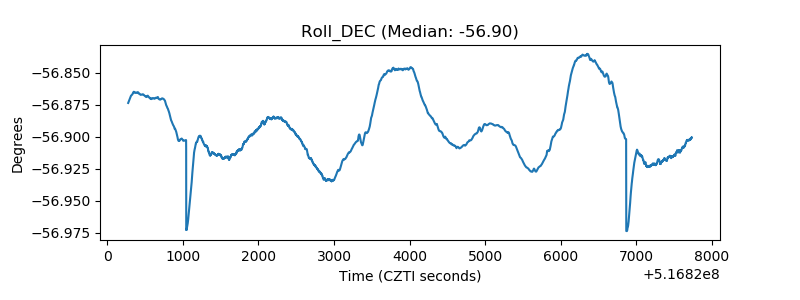 |
| _Roll_RA | 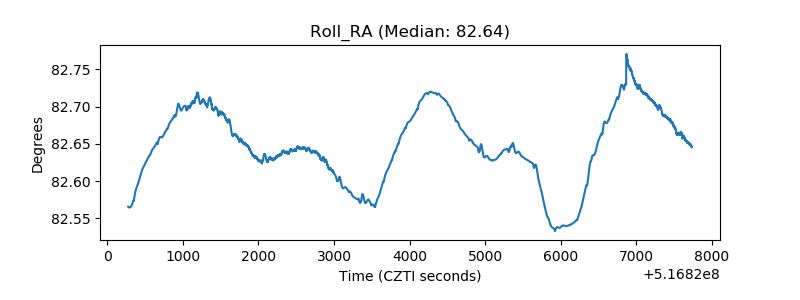 |
| Veto Counter | 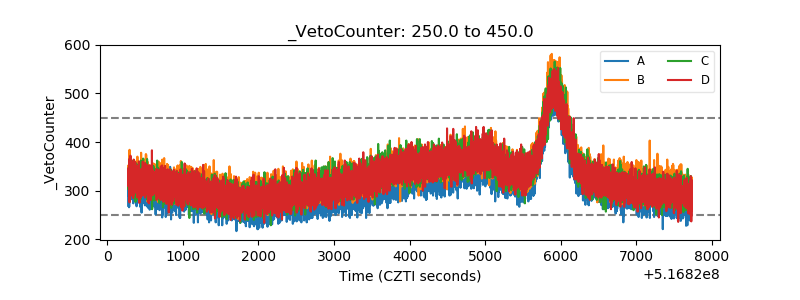 |