| Param | Original file | Final file |
|---|---|---|
| Filename | modeM0/AS1A14_113T09_9000006574_57562cztM0_level2.fits | modeM0/AS1A14_113T09_9000006574_57562cztM0_level2_quad_clean.evt |
| Size (bytes) | 1,522,013,760 | 252,141,120 |
| Size | 1.4 GB | 240.5 MB |
| Events in quadrant A | 8,680,067 | 1,734,764 |
| Events in quadrant B | 9,214,864 | 1,850,552 |
| Events in quadrant C | 16,339,644 | 1,505,231 |
| Events in quadrant D | 20,668,809 | 1,262,506 |
| Mode SS | |||
|---|---|---|---|
| Quadrant | BADHDUFLAG | Total packets | Discarded packets |
| A | 0 | 376 | 0 |
| B | 0 | 376 | 0 |
| C | 0 | 376 | 0 |
| D | 0 | 376 | 0 |
| Mode M9 | |||
|---|---|---|---|
| Quadrant | BADHDUFLAG | Total packets | Discarded packets |
| A | 0 | 17 | 0 |
| B | 0 | 17 | 0 |
| C | 0 | 17 | 0 |
| D | 0 | 17 | 0 |
| Mode M0 | |||
|---|---|---|---|
| Quadrant | BADHDUFLAG | Total packets | Discarded packets |
| A | 0 | 39624 | 3 |
| B | 0 | 40683 | 3 |
| C | 0 | 61591 | 3 |
| D | 0 | 74186 | 3 |
| Quadrant | Total seconds | Saturated seconds | Saturation percentage |
|---|---|---|---|
| A | 18589 | 202 | 1.086664% |
| B | 18589 | 269 | 1.447092% |
| C | 18589 | 1961 | 10.549250% |
| D | 18589 | 3434 | 18.473291% |
Noise dominated data is calculated using 1-second bins in cleaned event files. If a bin has >2000 counts, and if more than 50% of those come from <1% of pixels, then it is considered to be noise-dominated and hence unusable.
| Quadrant | # 1 sec bins | Bins with >0 counts | Bins with >2000 counts | High rate bins dominated by noise | Noise dominated (total time) | Noise dominated (detector-on time) | Marked lightcurve |
|---|---|---|---|---|---|---|---|
| A | 20279 | 18592 | 126 | 126 | 0.62% | 0.68% | 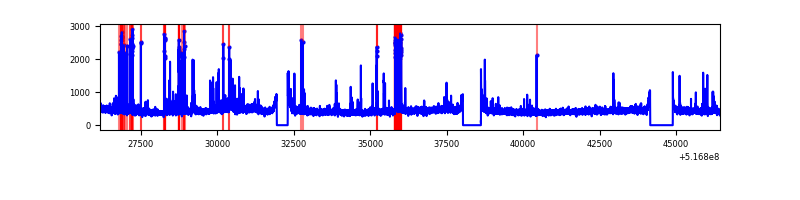 |
| B | 20279 | 18592 | 82 | 82 | 0.40% | 0.44% | 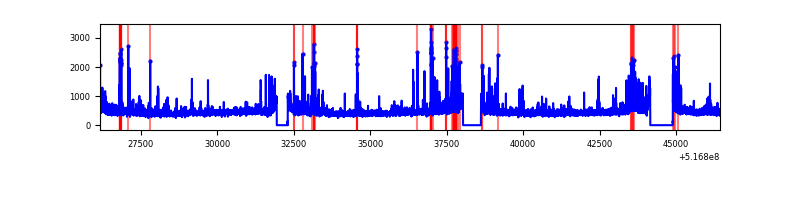 |
| C | 20279 | 18592 | 1791 | 1791 | 8.83% | 9.63% | 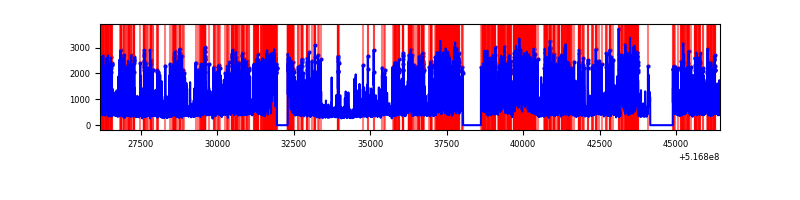 |
| D | 20279 | 18592 | 3562 | 3562 | 17.56% | 19.16% | 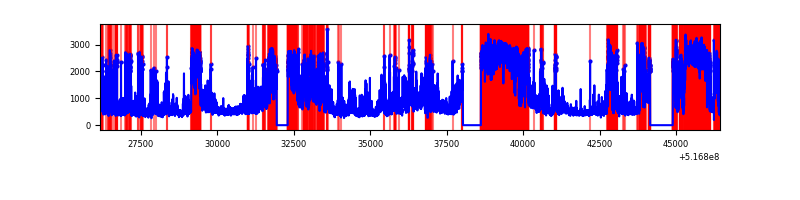 |
Top three noisy pixels from each quadrant. If the there are fewer than three noisy pixels in the level2.evt file, extra rows are filled as -1
| Pixel properties | Quadrant properties | ||||||
|---|---|---|---|---|---|---|---|
| Quadrant | DetID | PixID | Counts | Sigma | Mean | Median | Sigma |
| A | 10 | 251 | 625575 | 1272.31 | 1997 | 1945 | 490.2 |
| A | 3 | 14 | 110553 | 221.58 | 1997 | 1945 | 490.2 |
| A | 8 | 249 | 79935 | 159.11 | 1997 | 1945 | 490.2 |
| B | 4 | 206 | 574197 | 1359.03 | 1971 | 1896 | 421.1 |
| B | 10 | 247 | 283407 | 668.5 | 1971 | 1896 | 421.1 |
| B | 7 | 252 | 134303 | 314.42 | 1971 | 1896 | 421.1 |
| C | 15 | 224 | 4712539 | 9500.44 | 1848 | 1835 | 495.8 |
| C | 12 | 254 | 2758924 | 5560.43 | 1848 | 1835 | 495.8 |
| C | 14 | 254 | 733773 | 1476.16 | 1848 | 1835 | 495.8 |
| D | 15 | 142 | 9539436 | 19402.27 | 1746 | 1668 | 491.6 |
| D | 8 | 160 | 2197368 | 4466.62 | 1746 | 1668 | 491.6 |
| D | 2 | 252 | 423001 | 857.1 | 1746 | 1668 | 491.6 |
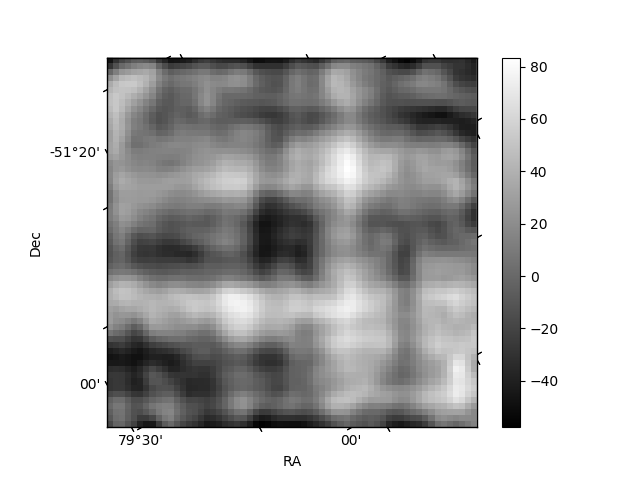
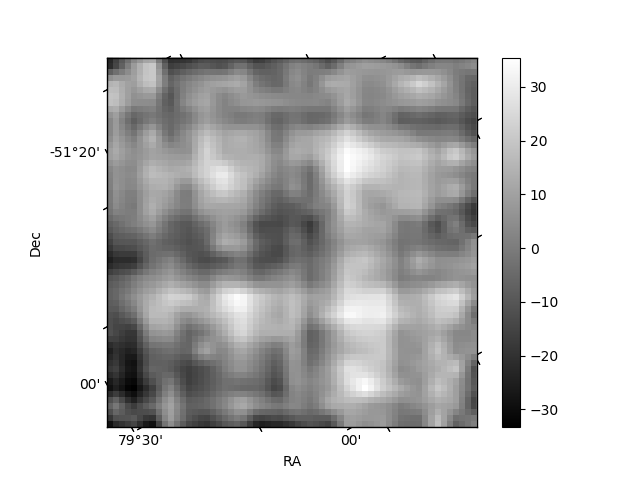
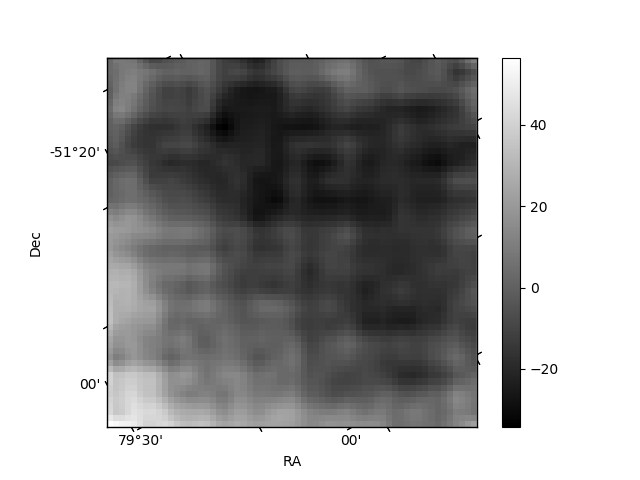
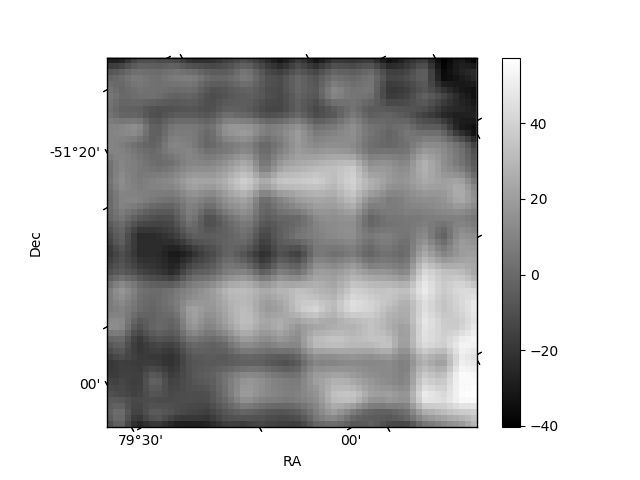
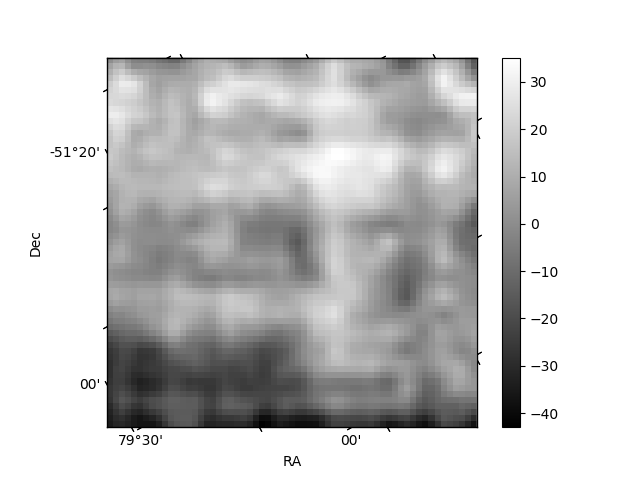
Histogram calculated using DETX and DETY for each event in the final _common_clean file
| Quadrant A | 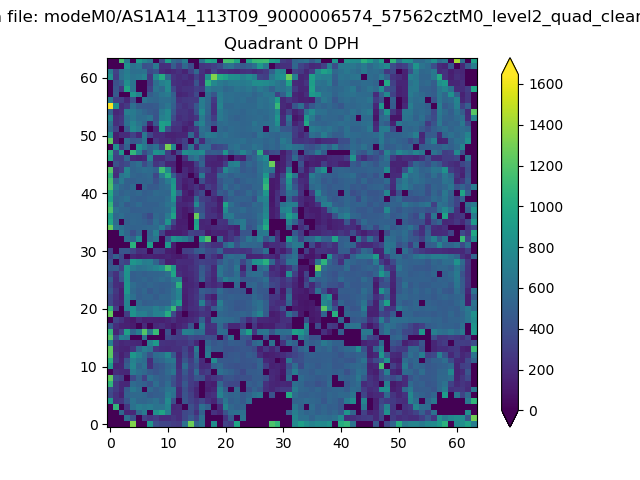 |
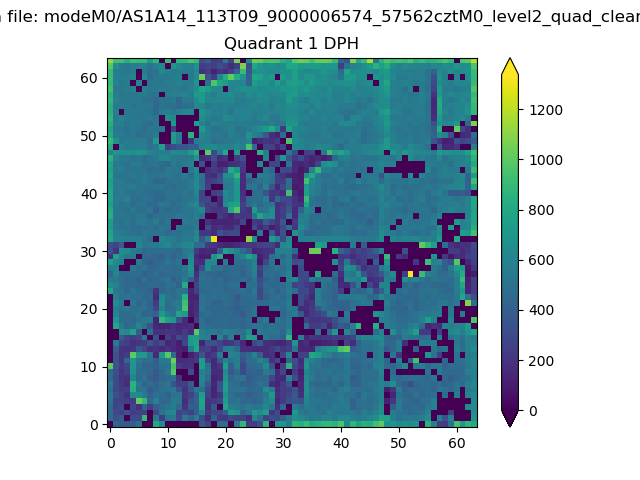 |
Quadrant B |
|---|---|---|---|
| Quadrant D | 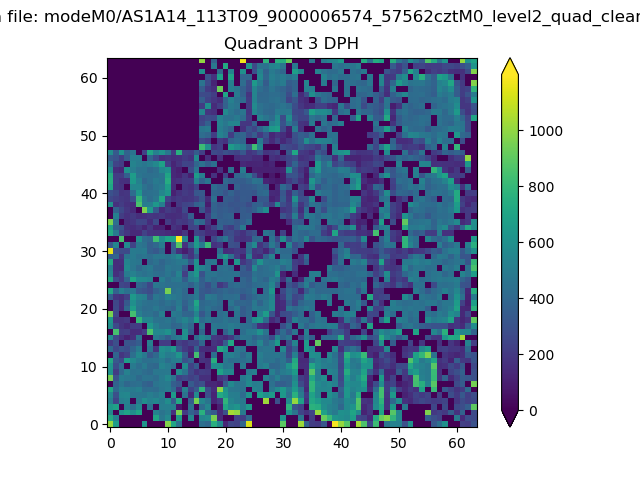 |
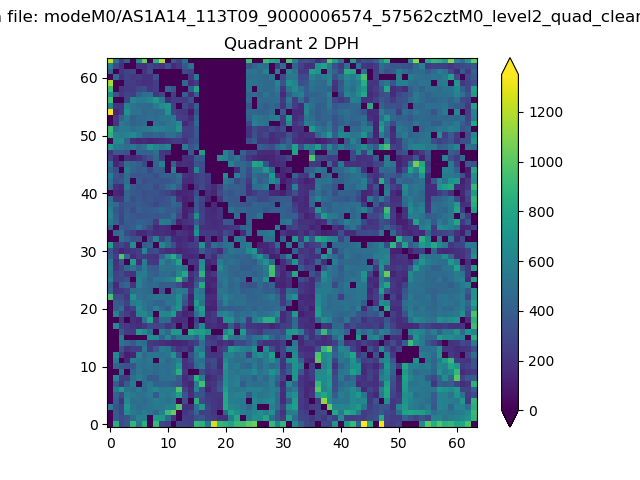 |
Quadrant C |
| Plot type | Count rate plots | Images |
|---|---|---|
| Comparison with Poisson distribution Blue bars denote a histogram of data divided into 1 sec bins. Red curve is a Poisson curve with rate = median count rate of data. |
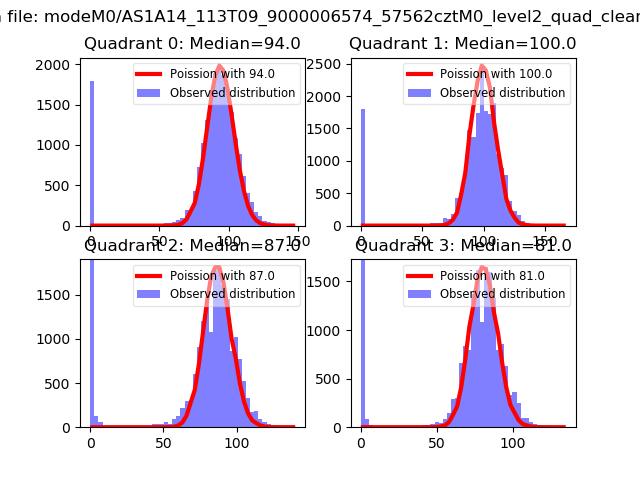 |
 |
| Quadrant-wise count rates Data is divided into 100 sec bins |
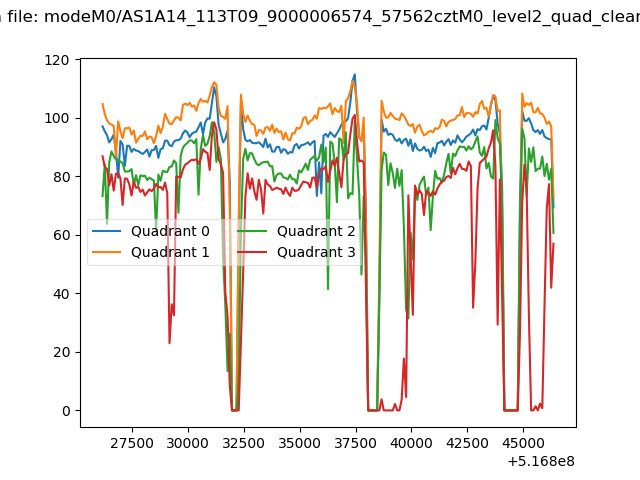 |
|
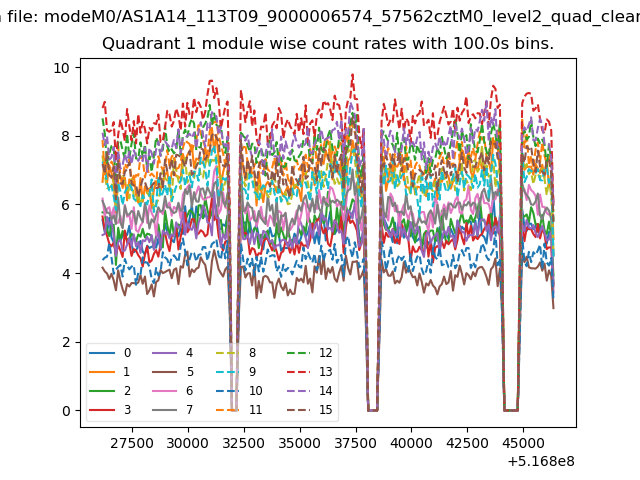
| Module-wise count rates for Quadrant A Data is divided into 100 sec bins |
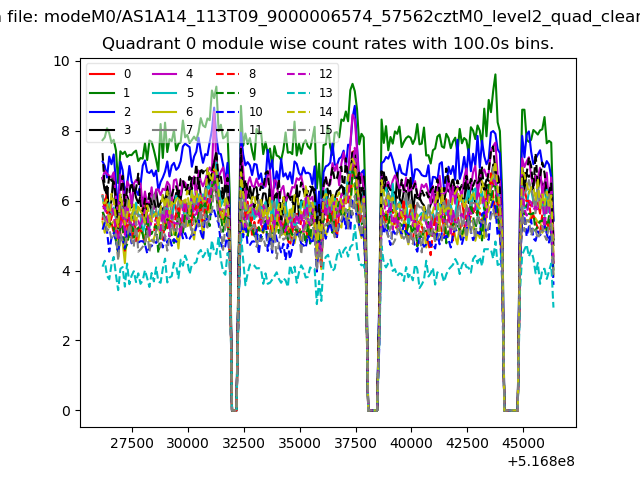 |
 |
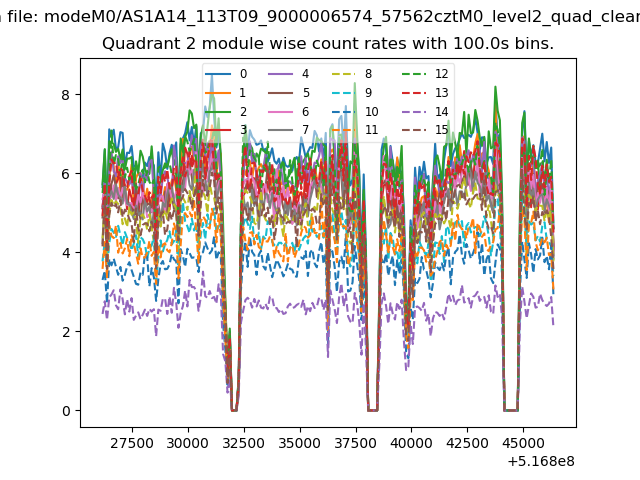
| Module-wise count rates for Quadrant B Data is divided into 100 sec bins |
 |
 |
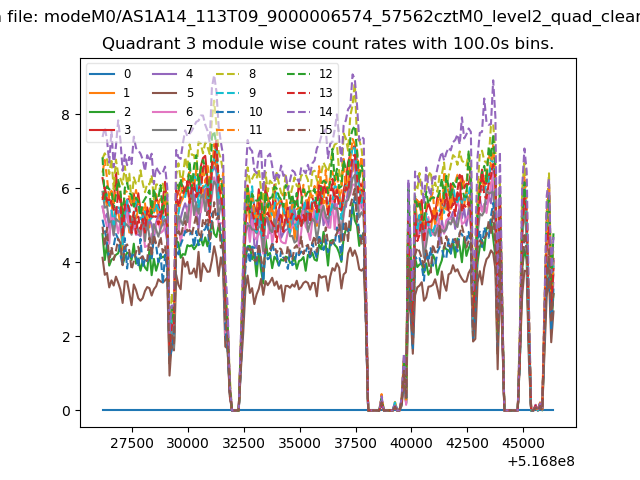
| Module-wise count rates for Quadrant C Data is divided into 100 sec bins |
 |
 |
| Module-wise count rates for Quadrant D Data is divided into 100 sec bins |
 |
 |
| Parameter | Plot |
|---|---|
| CZT HV Monitor | 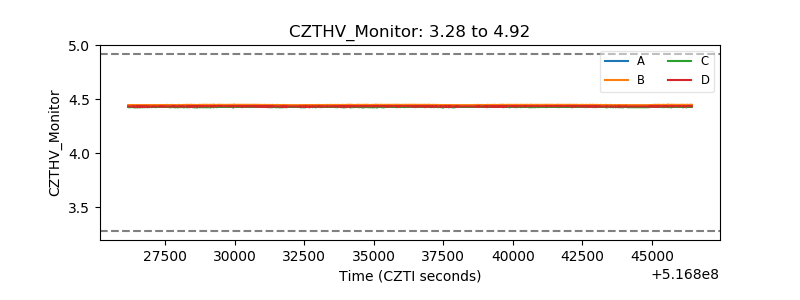 |
| D_VDD | 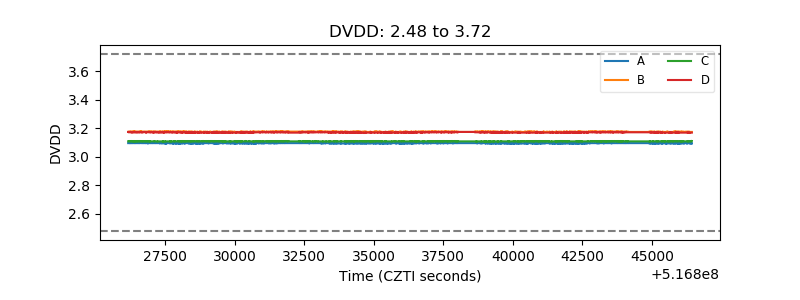 |
| Temperature 1 | 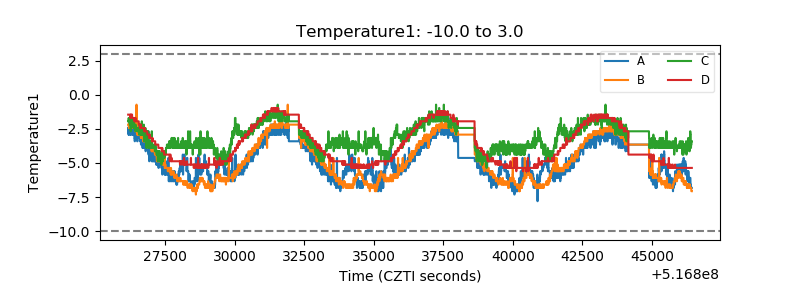 |
| Veto HV Monitor | 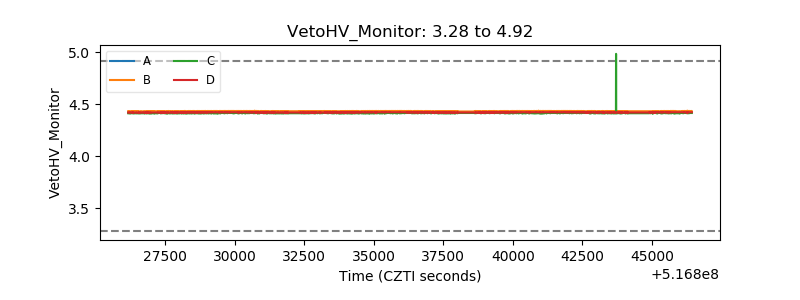 |
| Veto LLD | 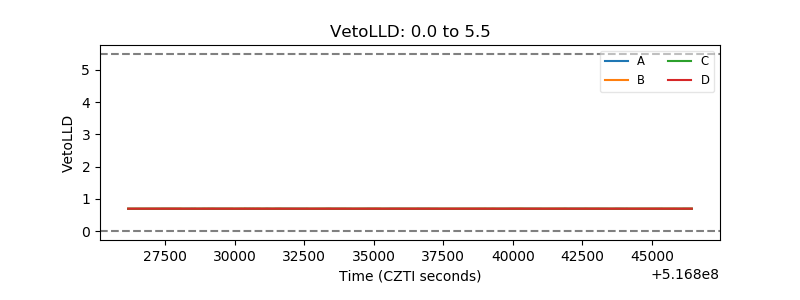 |
| Alpha Counter | 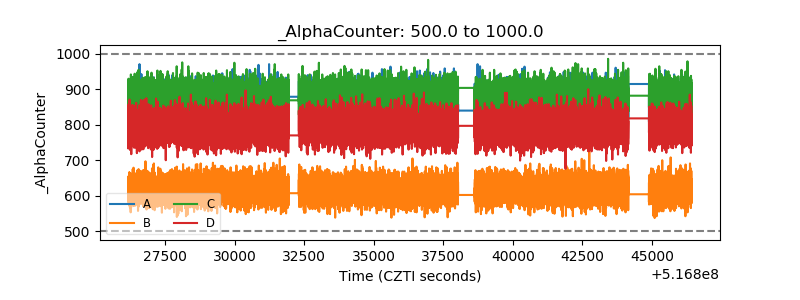 |
| _CPM_Rate | 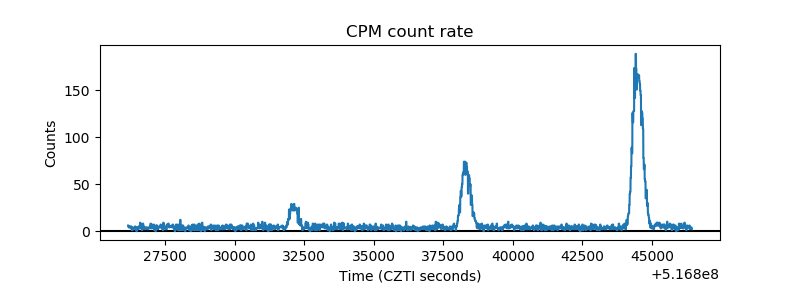 |
| CZT Counter | 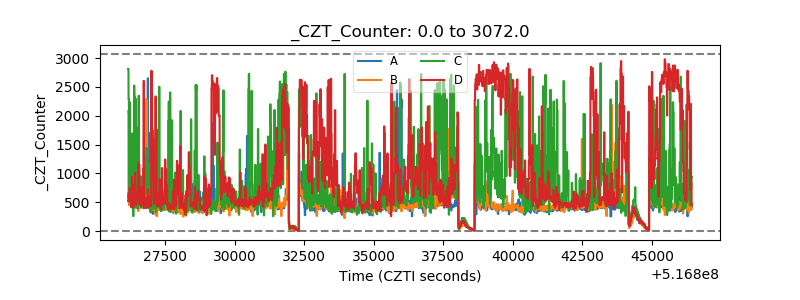 |
| +2.5 Volts monitor | 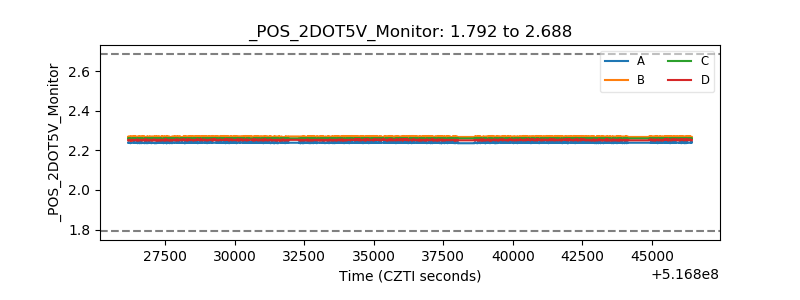 |
| +5 Volts monitor |  |
| _ROLL_ROT | 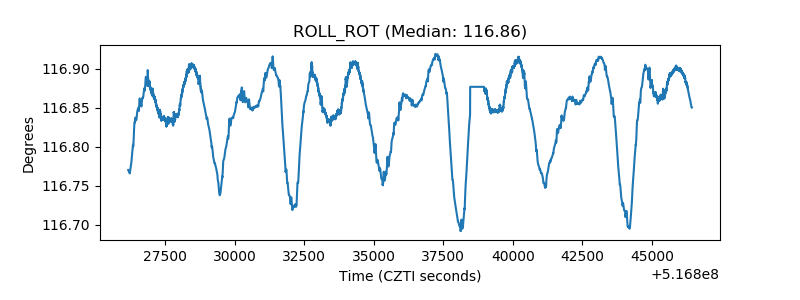 |
| _Roll_DEC | 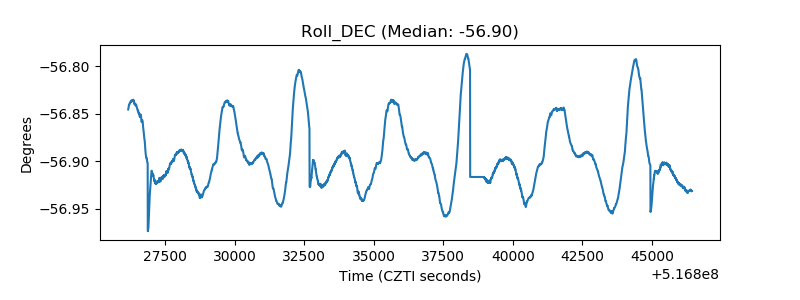 |
| _Roll_RA | 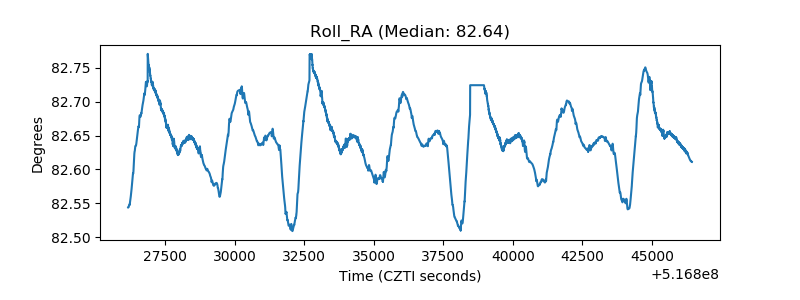 |
| Veto Counter | 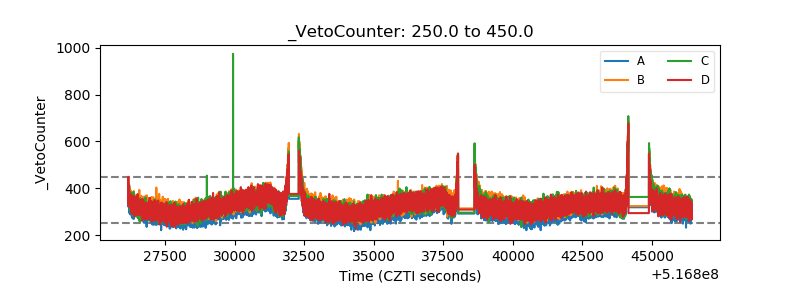 |