| Param | Original file | Final file |
|---|---|---|
| Filename | modeM0/AS1A14_113T09_9000006574_57563cztM0_level2.fits | modeM0/AS1A14_113T09_9000006574_57563cztM0_level2_quad_clean.evt |
| Size (bytes) | 505,967,040 | 92,142,720 |
| Size | 482.5 MB | 87.9 MB |
| Events in quadrant A | 3,195,590 | 621,469 |
| Events in quadrant B | 3,153,858 | 667,221 |
| Events in quadrant C | 5,291,334 | 567,186 |
| Events in quadrant D | 6,581,314 | 478,194 |
| Mode SS | |||
|---|---|---|---|
| Quadrant | BADHDUFLAG | Total packets | Discarded packets |
| A | 0 | 134 | 0 |
| B | 0 | 134 | 0 |
| C | 0 | 134 | 0 |
| D | 0 | 134 | 0 |
| Mode M9 | |||
|---|---|---|---|
| Quadrant | BADHDUFLAG | Total packets | Discarded packets |
| A | 0 | 9 | 0 |
| B | 0 | 9 | 0 |
| C | 0 | 9 | 0 |
| D | 0 | 9 | 0 |
| Mode M0 | |||
|---|---|---|---|
| Quadrant | BADHDUFLAG | Total packets | Discarded packets |
| A | 0 | 14199 | 1 |
| B | 0 | 13891 | 1 |
| C | 0 | 20253 | 1 |
| D | 0 | 23980 | 1 |
| Quadrant | Total seconds | Saturated seconds | Saturation percentage |
|---|---|---|---|
| A | 6529 | 80 | 1.225302% |
| B | 6529 | 59 | 0.903661% |
| C | 6529 | 439 | 6.723847% |
| D | 6529 | 1069 | 16.373105% |
Noise dominated data is calculated using 1-second bins in cleaned event files. If a bin has >2000 counts, and if more than 50% of those come from <1% of pixels, then it is considered to be noise-dominated and hence unusable.
| Quadrant | # 1 sec bins | Bins with >0 counts | Bins with >2000 counts | High rate bins dominated by noise | Noise dominated (total time) | Noise dominated (detector-on time) | Marked lightcurve |
|---|---|---|---|---|---|---|---|
| A | 7434 | 6530 | 49 | 49 | 0.66% | 0.75% | 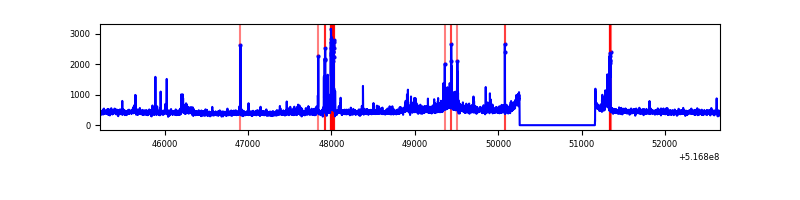 |
| B | 7434 | 6530 | 6 | 6 | 0.08% | 0.09% | 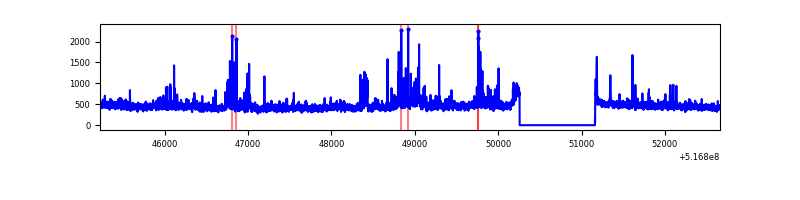 |
| C | 7434 | 6530 | 351 | 351 | 4.72% | 5.38% | 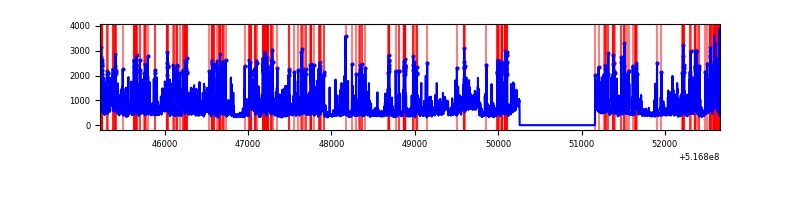 |
| D | 7434 | 6530 | 1083 | 1083 | 14.57% | 16.58% | 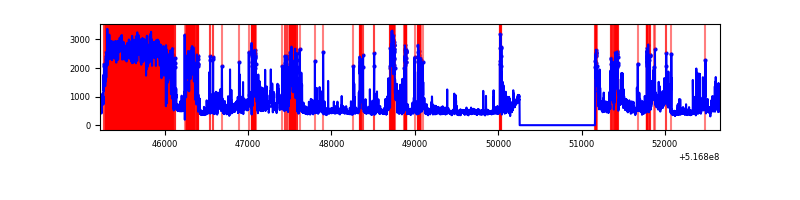 |
Top three noisy pixels from each quadrant. If the there are fewer than three noisy pixels in the level2.evt file, extra rows are filled as -1
| Pixel properties | Quadrant properties | ||||||
|---|---|---|---|---|---|---|---|
| Quadrant | DetID | PixID | Counts | Sigma | Mean | Median | Sigma |
| A | 7 | 64 | 200741 | 1168.9 | 700 | 681 | 171.2 |
| A | 10 | 251 | 189167 | 1101.28 | 700 | 681 | 171.2 |
| A | 4 | 95 | 52735 | 304.14 | 700 | 681 | 171.2 |
| B | 10 | 247 | 124793 | 831.69 | 696 | 670 | 149.2 |
| B | 4 | 206 | 105139 | 699.99 | 696 | 670 | 149.2 |
| B | 4 | 142 | 43437 | 286.56 | 696 | 670 | 149.2 |
| C | 12 | 254 | 1069409 | 5889.27 | 670 | 664 | 181.5 |
| C | 15 | 224 | 828038 | 4559.21 | 670 | 664 | 181.5 |
| C | 12 | 2 | 442073 | 2432.36 | 670 | 664 | 181.5 |
| D | 15 | 142 | 2930048 | 16335.02 | 631 | 602 | 179.3 |
| D | 7 | 96 | 350975 | 1953.73 | 631 | 602 | 179.3 |
| D | 2 | 252 | 231316 | 1286.49 | 631 | 602 | 179.3 |
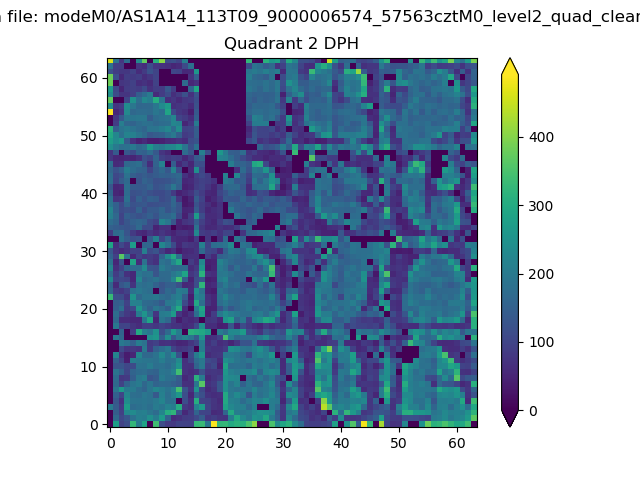
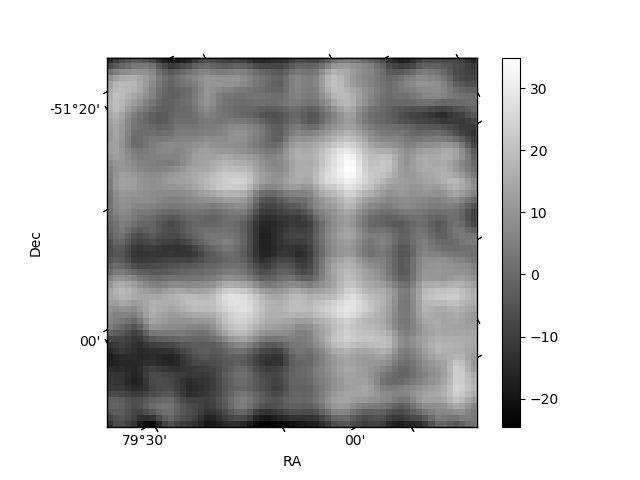
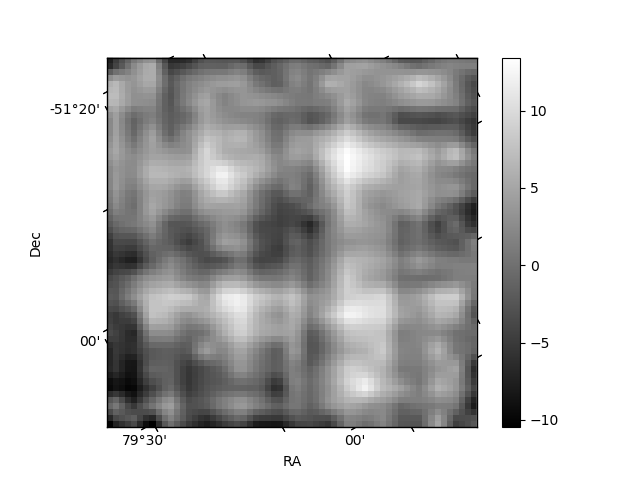
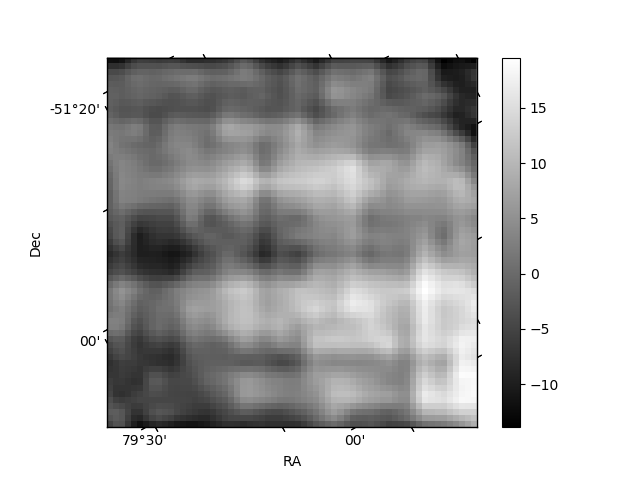
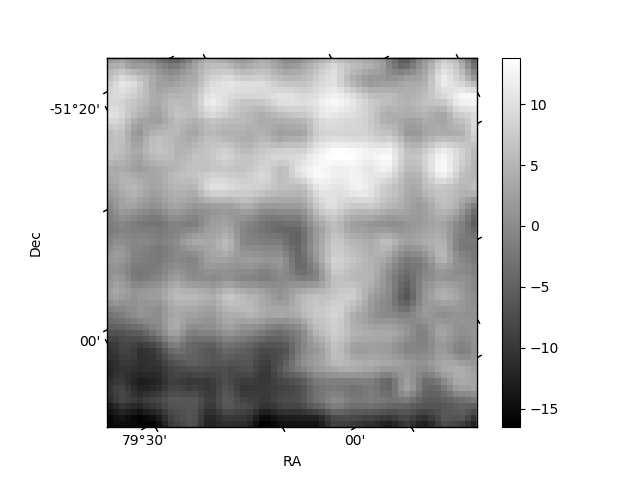
Histogram calculated using DETX and DETY for each event in the final _common_clean file
| Quadrant A | 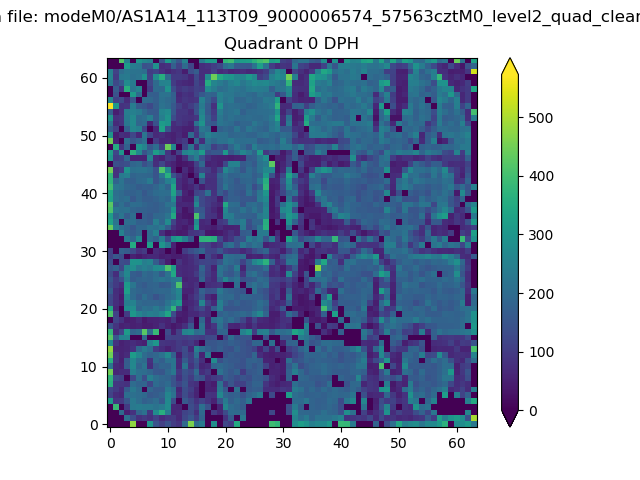 |
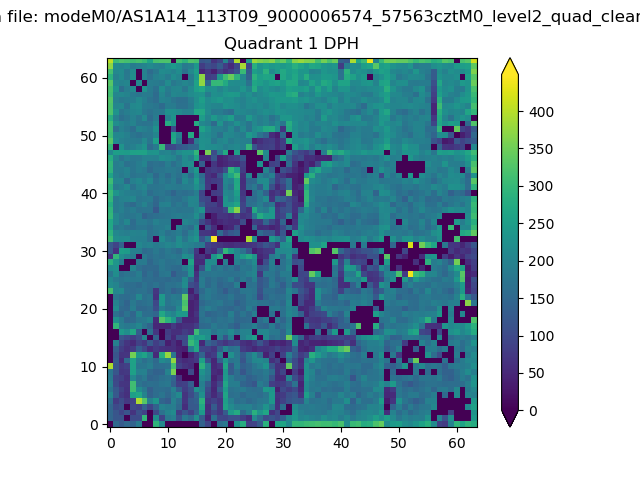 |
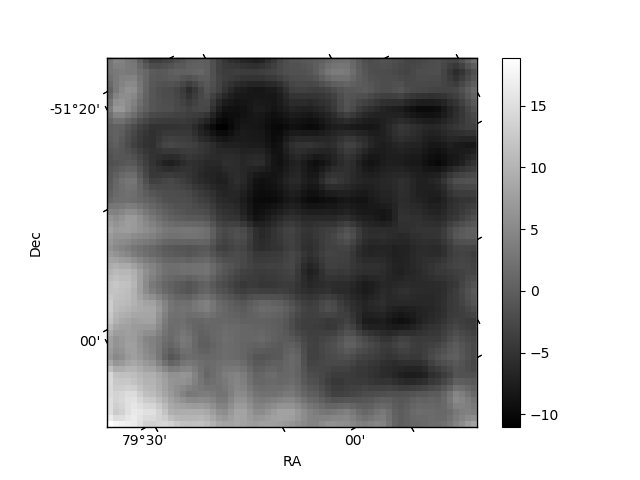
Quadrant B |
|---|---|---|---|
| Quadrant D | 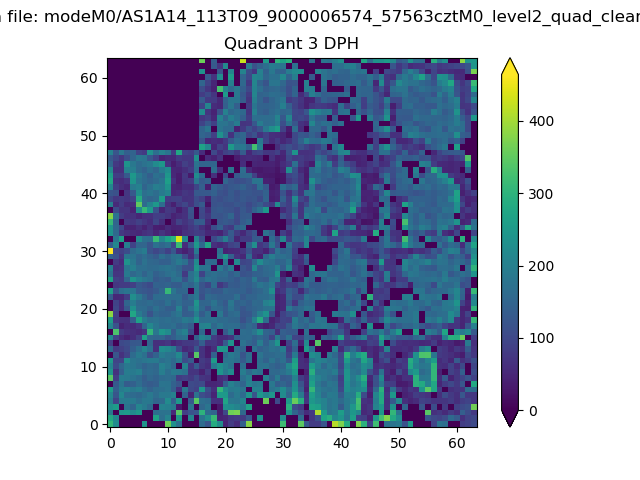 |
 |
Quadrant C |
| Plot type | Count rate plots | Images |
|---|---|---|
| Comparison with Poisson distribution Blue bars denote a histogram of data divided into 1 sec bins. Red curve is a Poisson curve with rate = median count rate of data. |
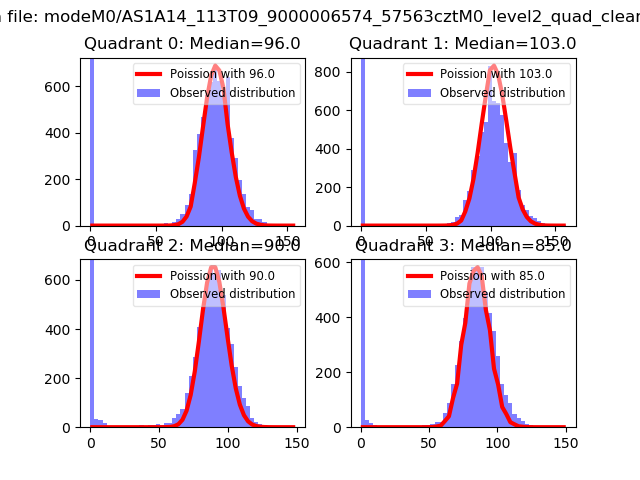 |
 |
| Quadrant-wise count rates Data is divided into 100 sec bins |
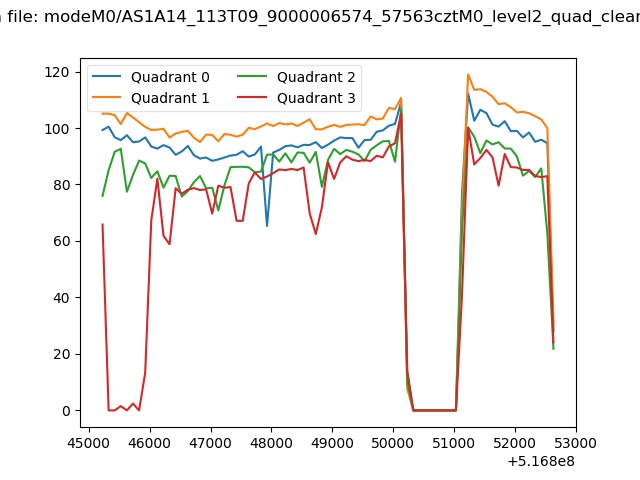 |
|
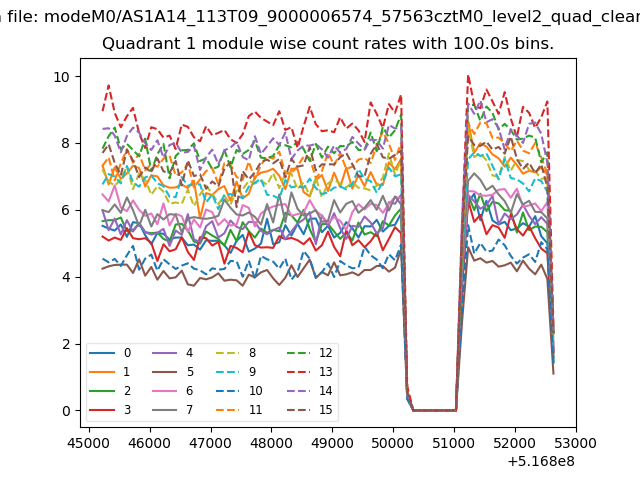
| Module-wise count rates for Quadrant A Data is divided into 100 sec bins |
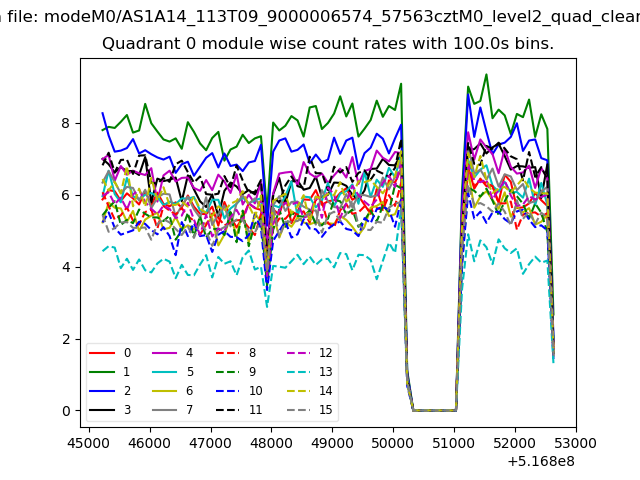 |
 |
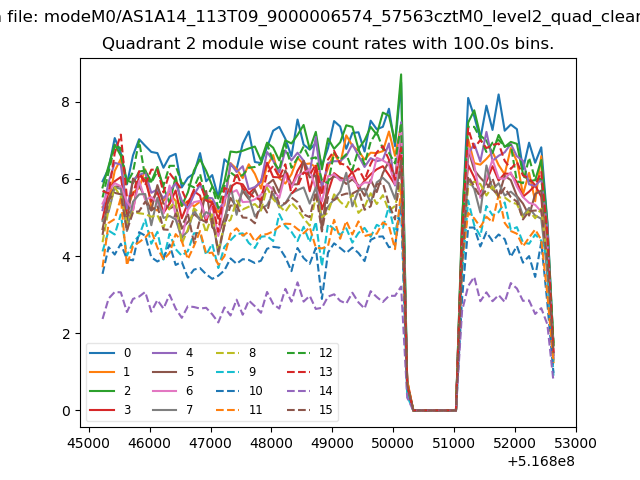
| Module-wise count rates for Quadrant B Data is divided into 100 sec bins |
 |
 |
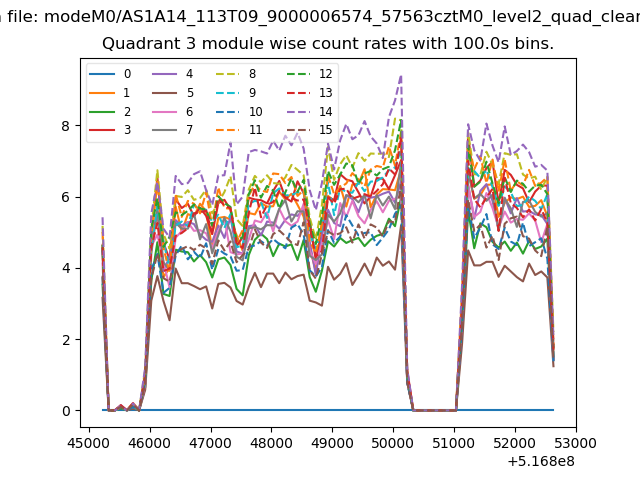
| Module-wise count rates for Quadrant C Data is divided into 100 sec bins |
 |
 |
| Module-wise count rates for Quadrant D Data is divided into 100 sec bins |
 |
 |
| Parameter | Plot |
|---|---|
| CZT HV Monitor | 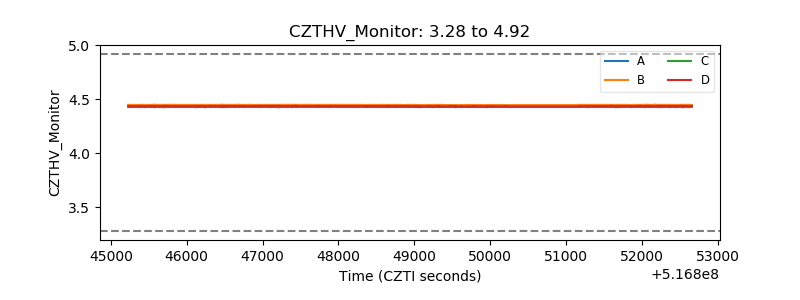 |
| D_VDD | 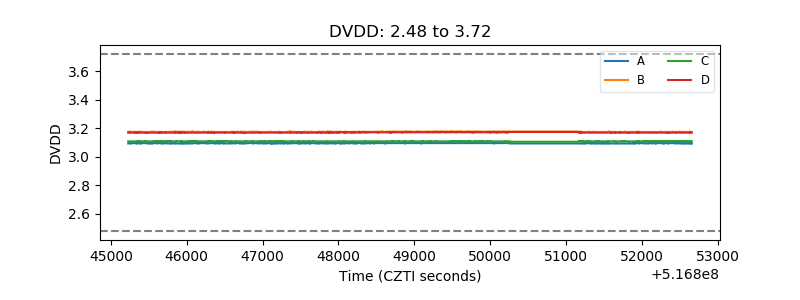 |
| Temperature 1 | 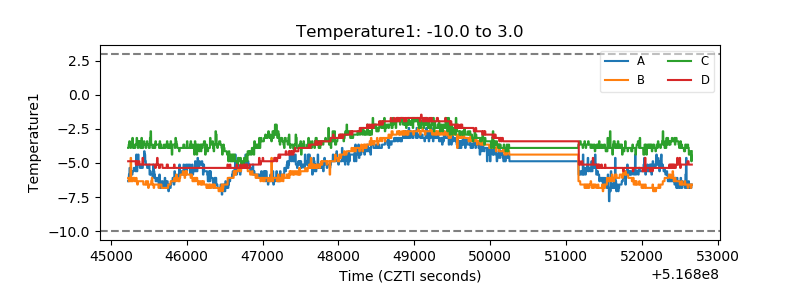 |
| Veto HV Monitor | 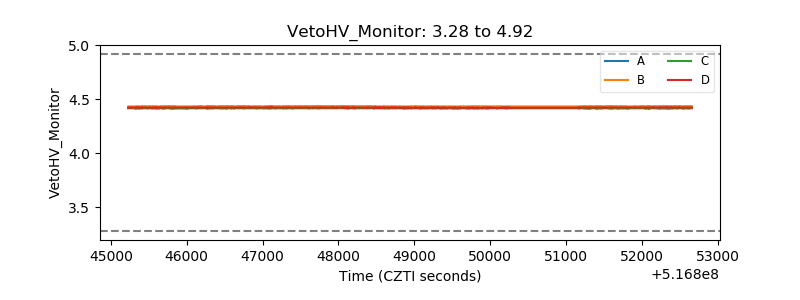 |
| Veto LLD | 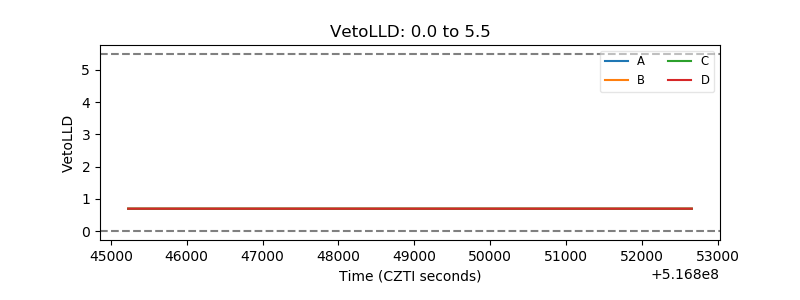 |
| Alpha Counter | 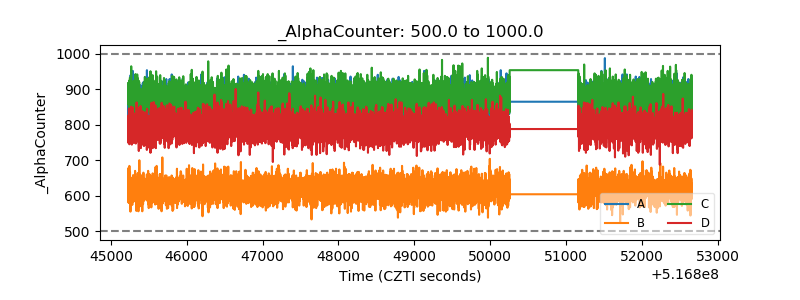 |
| _CPM_Rate | 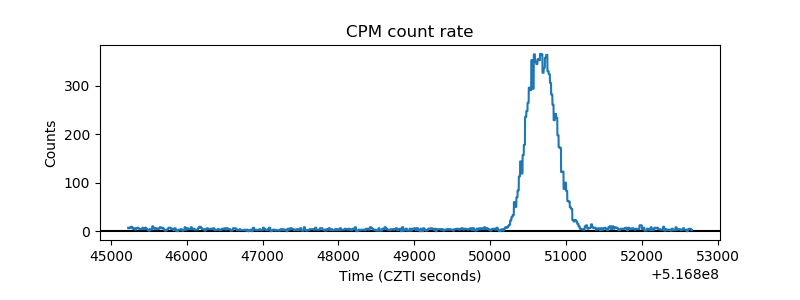 |
| CZT Counter | 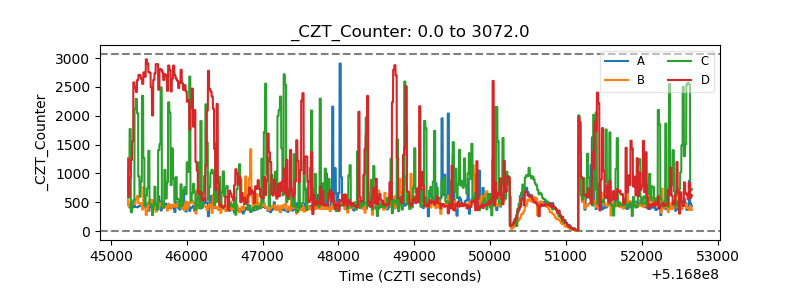 |
| +2.5 Volts monitor |  |
| +5 Volts monitor |  |
| _ROLL_ROT | 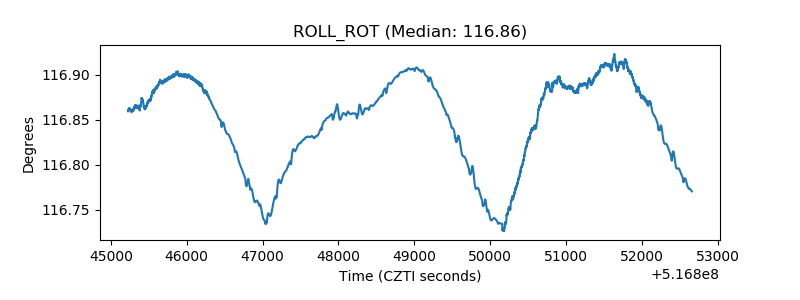 |
| _Roll_DEC | 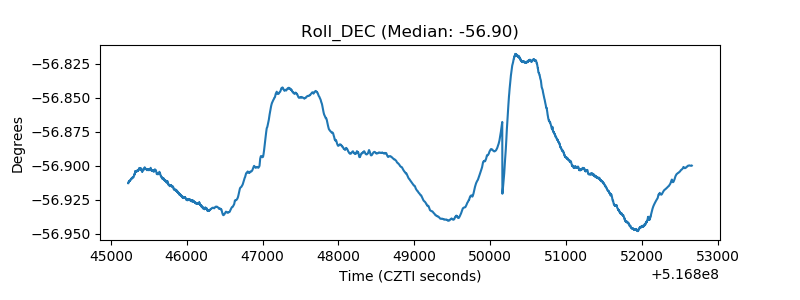 |
| _Roll_RA | 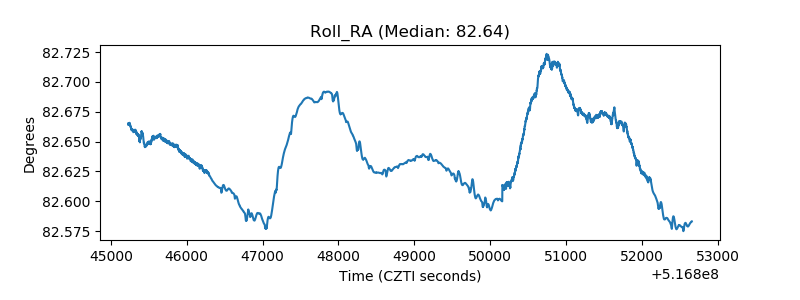 |
| Veto Counter | 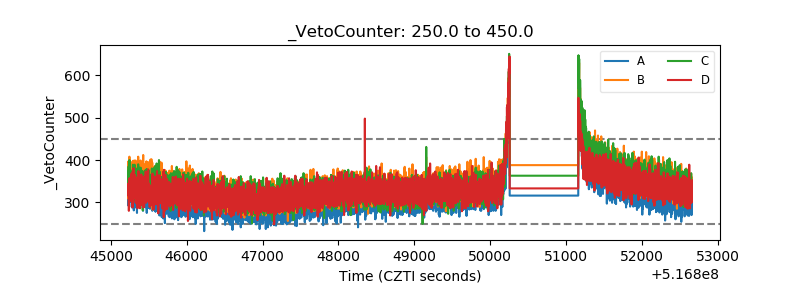 |