| Param | Original file | Final file |
|---|---|---|
| Filename | modeM0/AS1A14_113T09_9000006574_57565cztM0_level2.fits | modeM0/AS1A14_113T09_9000006574_57565cztM0_level2_quad_clean.evt |
| Size (bytes) | 413,467,200 | 95,883,840 |
| Size | 394.3 MB | 91.4 MB |
| Events in quadrant A | 2,848,922 | 631,325 |
| Events in quadrant B | 3,125,761 | 673,809 |
| Events in quadrant C | 4,613,791 | 586,358 |
| Events in quadrant D | 4,213,138 | 560,282 |
| Mode SS | |||
|---|---|---|---|
| Quadrant | BADHDUFLAG | Total packets | Discarded packets |
| A | 0 | 132 | 0 |
| B | 0 | 132 | 0 |
| C | 0 | 132 | 0 |
| D | 0 | 132 | 0 |
| Mode M9 | |||
|---|---|---|---|
| Quadrant | BADHDUFLAG | Total packets | Discarded packets |
| A | 0 | 10 | 0 |
| B | 0 | 10 | 0 |
| C | 0 | 10 | 0 |
| D | 0 | 10 | 0 |
| Mode M0 | |||
|---|---|---|---|
| Quadrant | BADHDUFLAG | Total packets | Discarded packets |
| A | 0 | 13168 | 1 |
| B | 0 | 13803 | 1 |
| C | 0 | 18180 | 1 |
| D | 0 | 16858 | 1 |
| Quadrant | Total seconds | Saturated seconds | Saturation percentage |
|---|---|---|---|
| A | 6472 | 41 | 0.633498% |
| B | 6473 | 108 | 1.668469% |
| C | 6473 | 306 | 4.727329% |
| D | 6473 | 181 | 2.796230% |
Noise dominated data is calculated using 1-second bins in cleaned event files. If a bin has >2000 counts, and if more than 50% of those come from <1% of pixels, then it is considered to be noise-dominated and hence unusable.
| Quadrant | # 1 sec bins | Bins with >0 counts | Bins with >2000 counts | High rate bins dominated by noise | Noise dominated (total time) | Noise dominated (detector-on time) | Marked lightcurve |
|---|---|---|---|---|---|---|---|
| A | 7487 | 6473 | 1 | 1 | 0.01% | 0.02% | 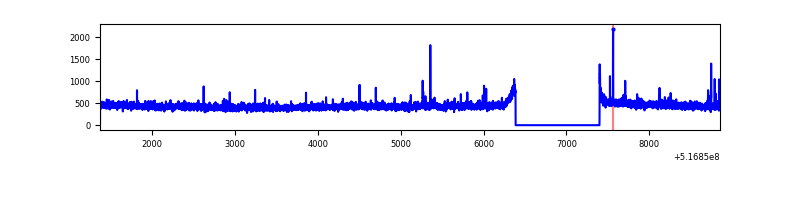 |
| B | 7488 | 6474 | 44 | 44 | 0.59% | 0.68% | 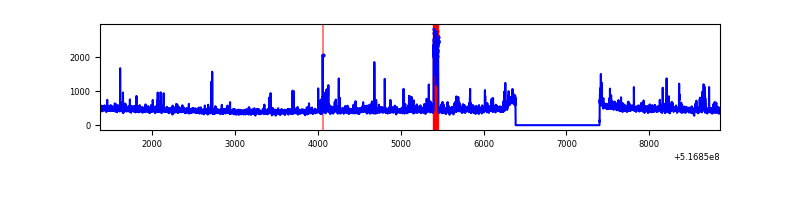 |
| C | 7488 | 6474 | 211 | 211 | 2.82% | 3.26% | 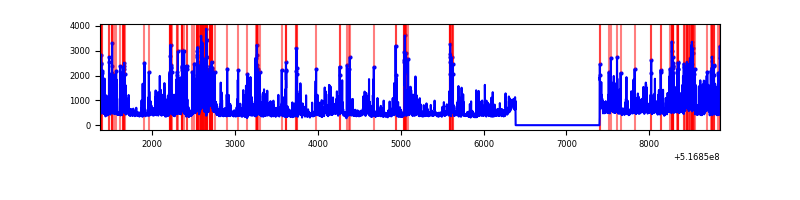 |
| D | 7488 | 6474 | 146 | 146 | 1.95% | 2.26% | 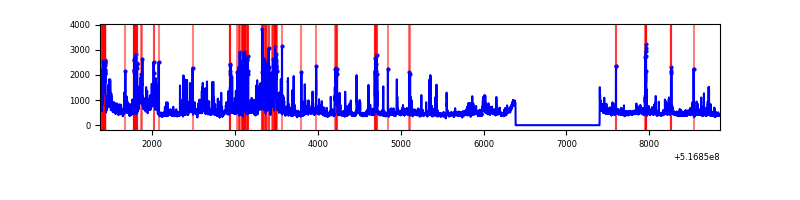 |
Top three noisy pixels from each quadrant. If the there are fewer than three noisy pixels in the level2.evt file, extra rows are filled as -1
| Pixel properties | Quadrant properties | ||||||
|---|---|---|---|---|---|---|---|
| Quadrant | DetID | PixID | Counts | Sigma | Mean | Median | Sigma |
| A | 10 | 251 | 40790 | 228.15 | 709 | 690 | 175.8 |
| A | 3 | 128 | 36116 | 201.56 | 709 | 690 | 175.8 |
| A | 4 | 3 | 8964 | 47.07 | 709 | 690 | 175.8 |
| B | 5 | 185 | 132436 | 875.53 | 700 | 674 | 150.5 |
| B | 4 | 206 | 71925 | 473.45 | 700 | 674 | 150.5 |
| B | 10 | 247 | 32211 | 209.56 | 700 | 674 | 150.5 |
| C | 15 | 224 | 977408 | 5274.33 | 683 | 676 | 185.2 |
| C | 12 | 254 | 562051 | 3031.41 | 683 | 676 | 185.2 |
| C | 14 | 254 | 154313 | 829.64 | 683 | 676 | 185.2 |
| D | 15 | 142 | 535374 | 2758.55 | 685 | 653 | 193.8 |
| D | 7 | 96 | 494684 | 2548.63 | 685 | 653 | 193.8 |
| D | 15 | 94 | 91376 | 468.03 | 685 | 653 | 193.8 |
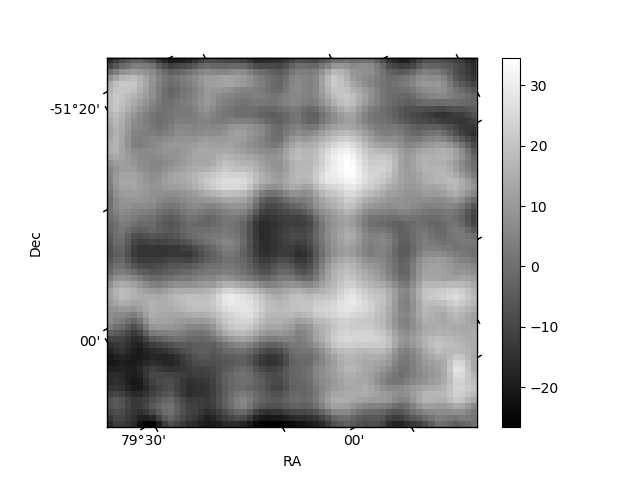
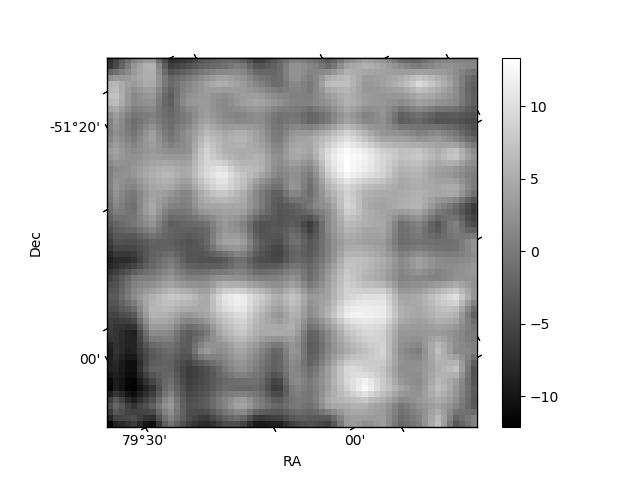
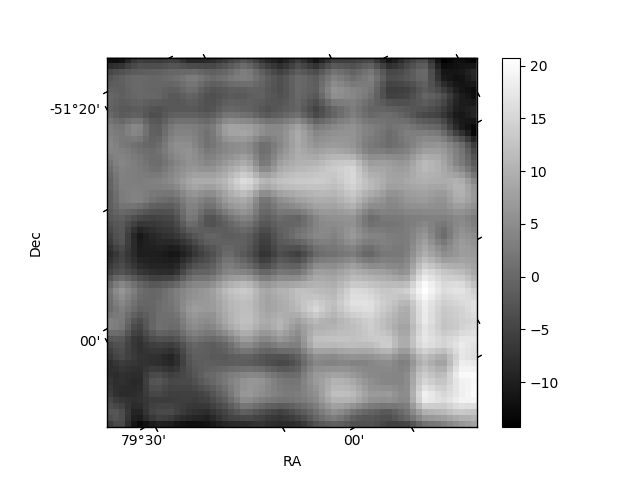
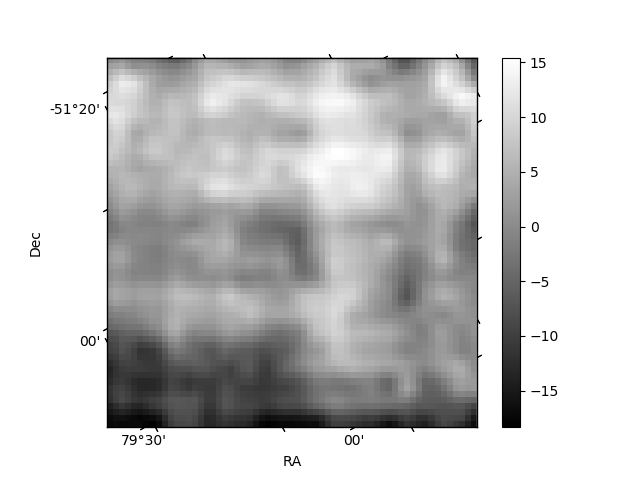
Histogram calculated using DETX and DETY for each event in the final _common_clean file
| Quadrant A | 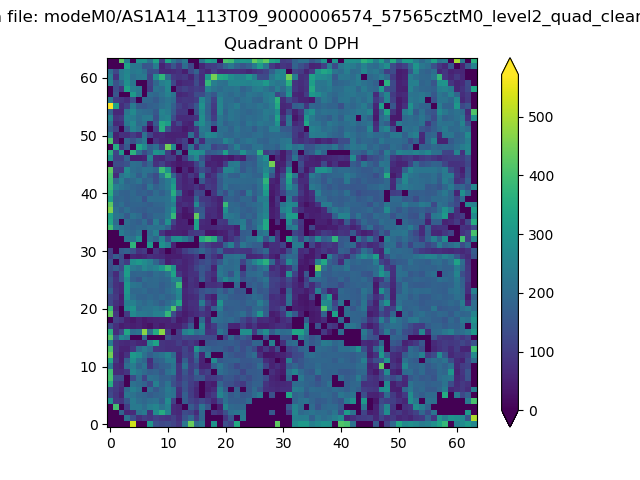 |
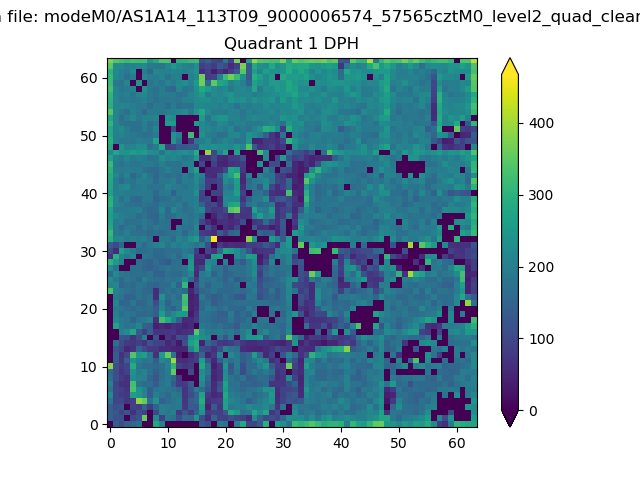 |
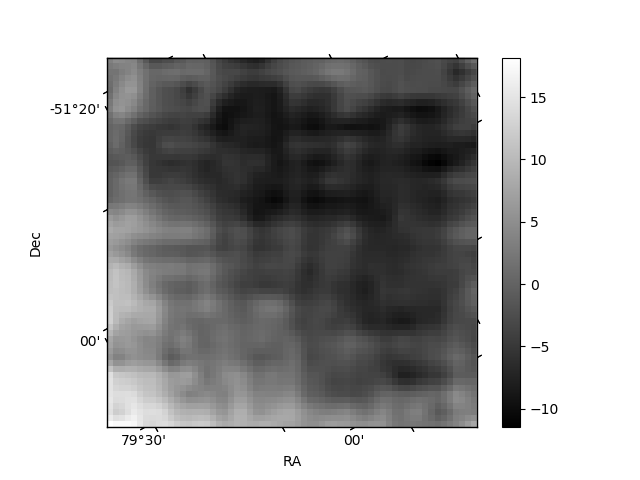
Quadrant B |
|---|---|---|---|
| Quadrant D | 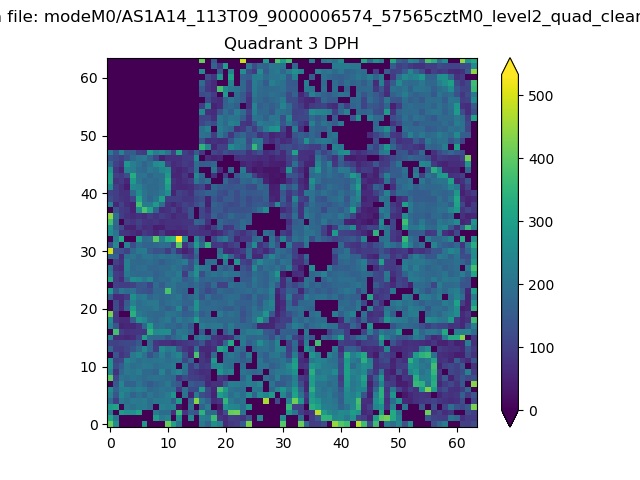 |
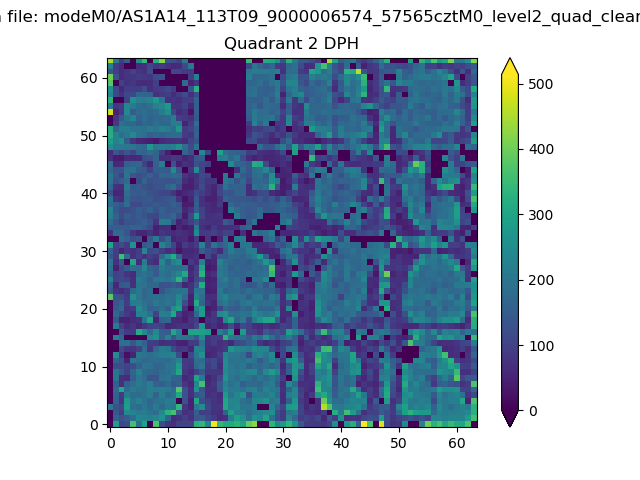 |
Quadrant C |
| Plot type | Count rate plots | Images |
|---|---|---|
| Comparison with Poisson distribution Blue bars denote a histogram of data divided into 1 sec bins. Red curve is a Poisson curve with rate = median count rate of data. |
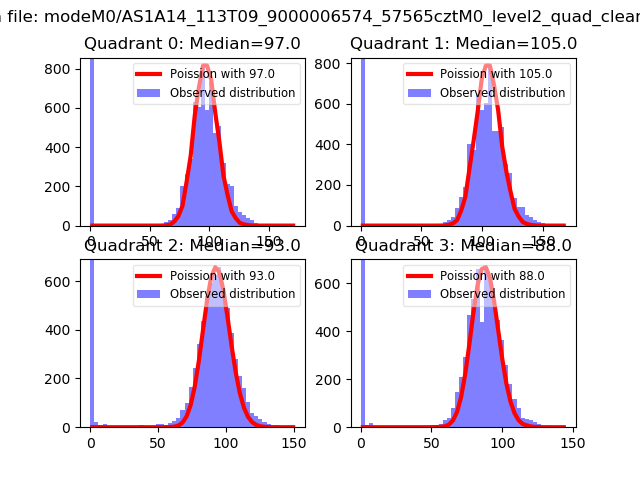 |
 |
| Quadrant-wise count rates Data is divided into 100 sec bins |
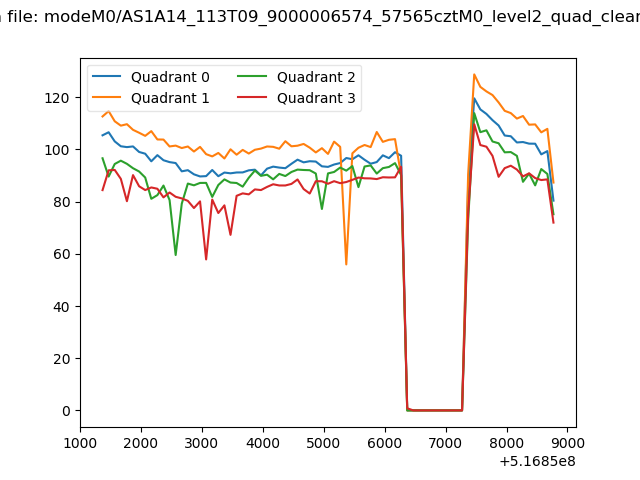 |
|
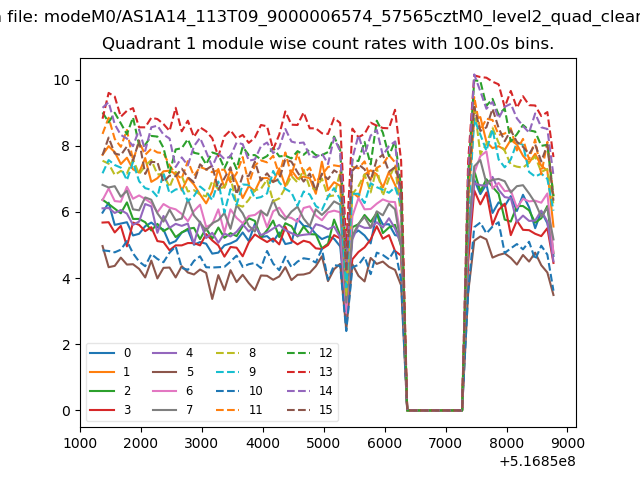
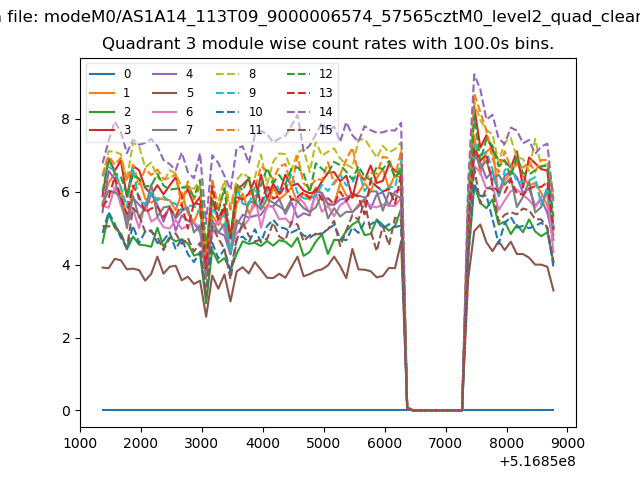
| Module-wise count rates for Quadrant A Data is divided into 100 sec bins |
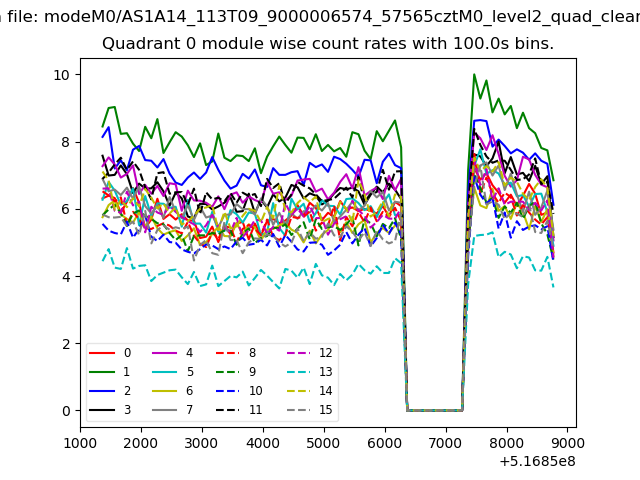 |
 |
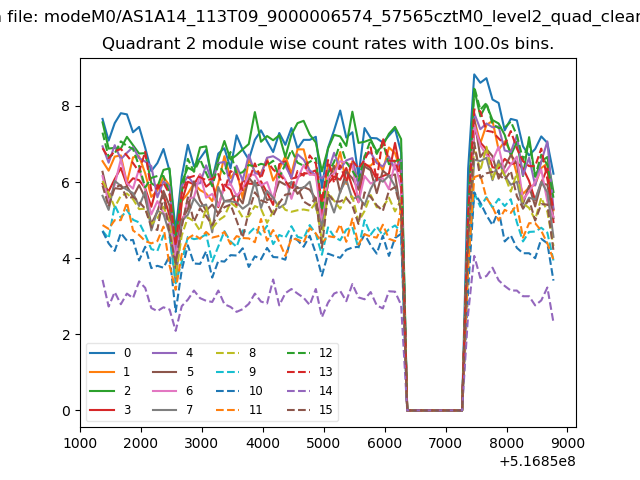
| Module-wise count rates for Quadrant B Data is divided into 100 sec bins |
 |
 |
| Module-wise count rates for Quadrant C Data is divided into 100 sec bins |
 |
 |
| Module-wise count rates for Quadrant D Data is divided into 100 sec bins |
 |
 |
| Parameter | Plot |
|---|---|
| CZT HV Monitor | 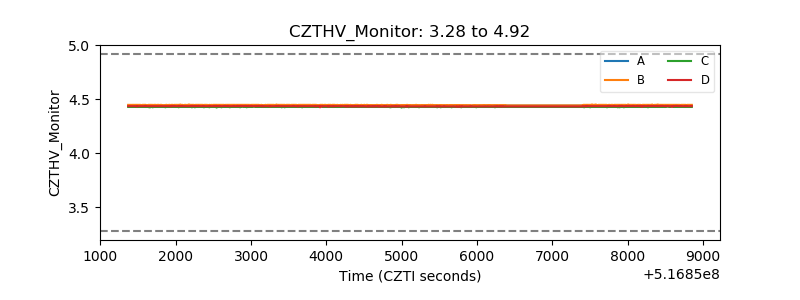 |
| D_VDD | 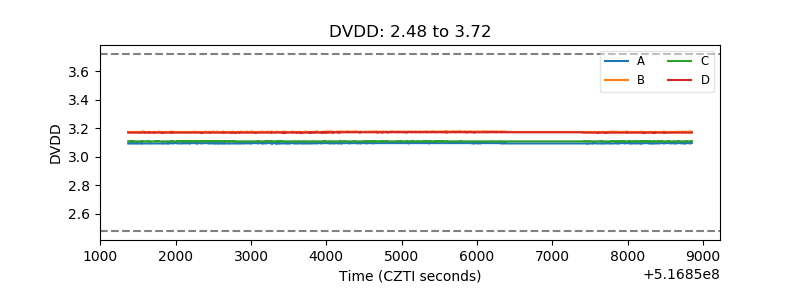 |
| Temperature 1 | 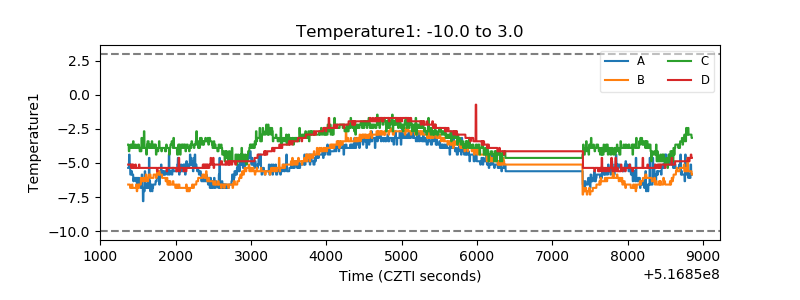 |
| Veto HV Monitor | 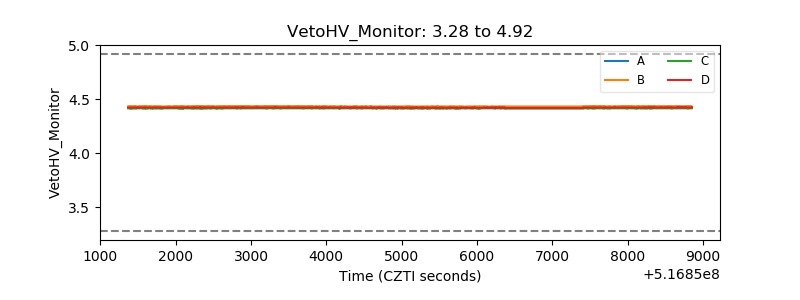 |
| Veto LLD | 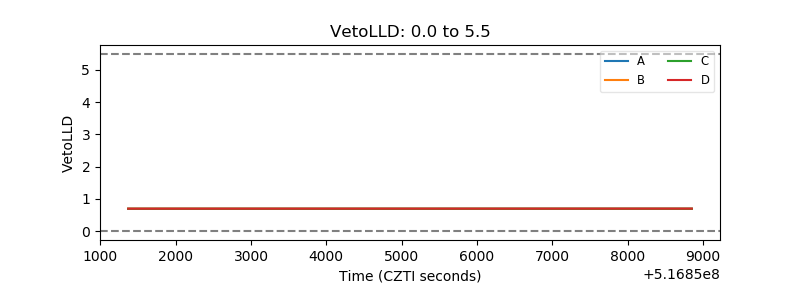 |
| Alpha Counter | 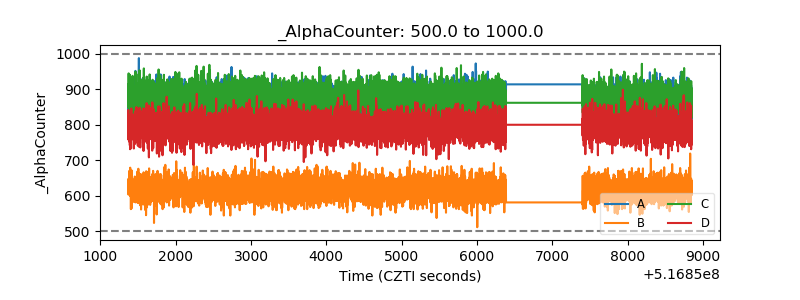 |
| _CPM_Rate | 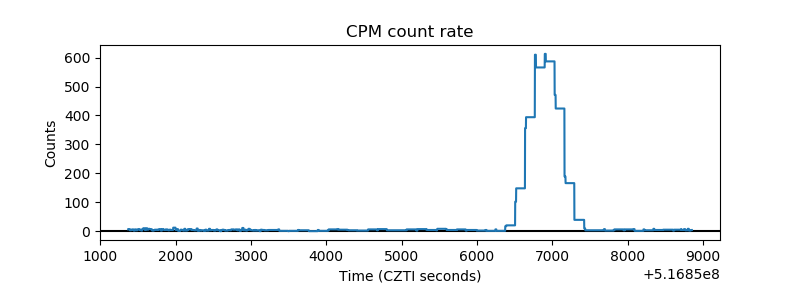 |
| CZT Counter | 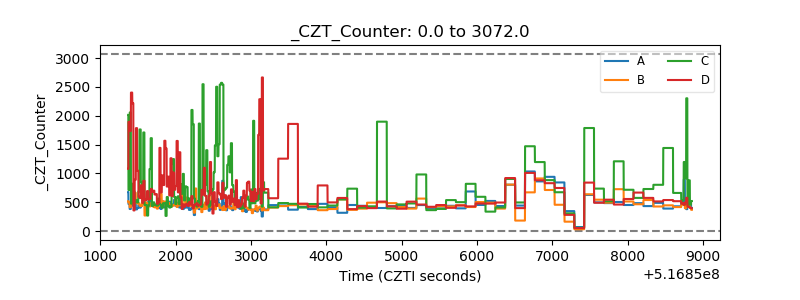 |
| +2.5 Volts monitor |  |
| +5 Volts monitor | 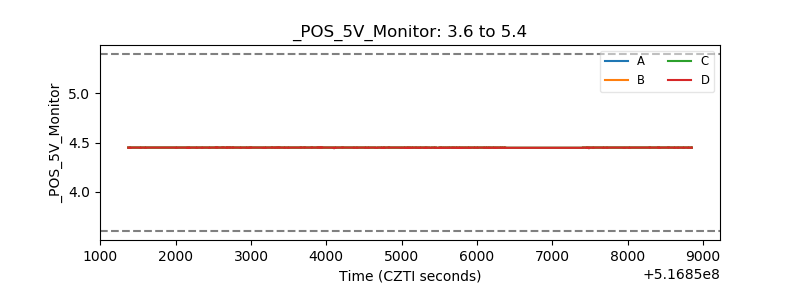 |
| _ROLL_ROT | 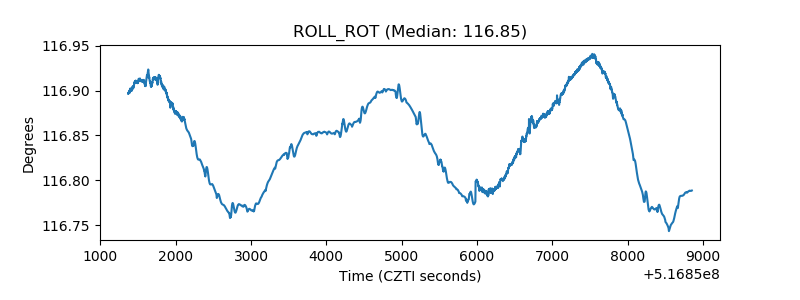 |
| _Roll_DEC | 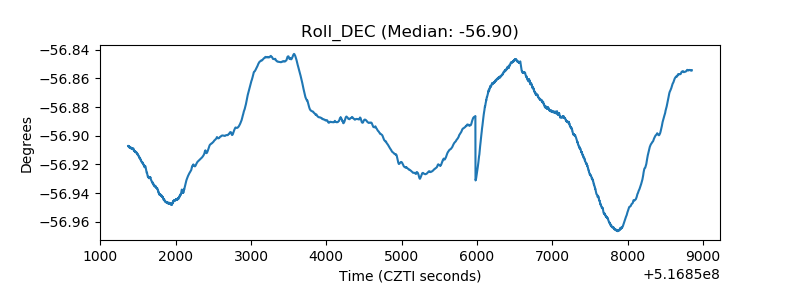 |
| _Roll_RA | 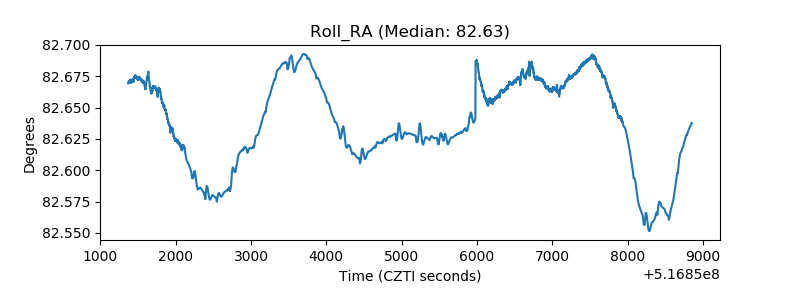 |
| Veto Counter | 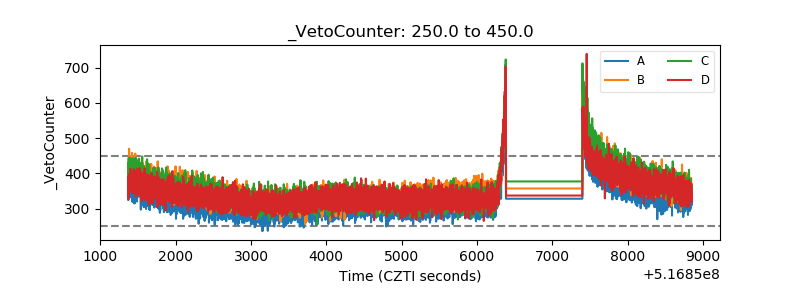 |