| Param | Original file | Final file |
|---|---|---|
| Filename | modeM0/AS1A14_070T08_9000006576_57568cztM0_level2.fits | modeM0/AS1A14_070T08_9000006576_57568cztM0_level2_quad_clean.evt |
| Size (bytes) | 361,235,520 | 91,304,640 |
| Size | 344.5 MB | 87.1 MB |
| Events in quadrant A | 2,788,364 | 602,417 |
| Events in quadrant B | 2,861,042 | 647,528 |
| Events in quadrant C | 3,538,682 | 573,885 |
| Events in quadrant D | 3,716,875 | 522,469 |
| Mode M0 | |||
|---|---|---|---|
| Quadrant | BADHDUFLAG | Total packets | Discarded packets |
| A | 0 | 12651 | 1 |
| B | 0 | 12648 | 1 |
| C | 0 | 14775 | 1 |
| D | 0 | 15128 | 1 |
| Mode M9 | |||
|---|---|---|---|
| Quadrant | BADHDUFLAG | Total packets | Discarded packets |
| A | 0 | 11 | 0 |
| B | 0 | 11 | 0 |
| C | 0 | 11 | 0 |
| D | 0 | 11 | 0 |
| Mode SS | |||
|---|---|---|---|
| Quadrant | BADHDUFLAG | Total packets | Discarded packets |
| A | 0 | 122 | 0 |
| B | 0 | 122 | 0 |
| C | 0 | 122 | 0 |
| D | 0 | 122 | 0 |
| Quadrant | Total seconds | Saturated seconds | Saturation percentage |
|---|---|---|---|
| A | 5992 | 68 | 1.134846% |
| B | 5992 | 100 | 1.668892% |
| C | 5992 | 184 | 3.070761% |
| D | 5992 | 318 | 5.307076% |
Noise dominated data is calculated using 1-second bins in cleaned event files. If a bin has >2000 counts, and if more than 50% of those come from <1% of pixels, then it is considered to be noise-dominated and hence unusable.
| Quadrant | # 1 sec bins | Bins with >0 counts | Bins with >2000 counts | High rate bins dominated by noise | Noise dominated (total time) | Noise dominated (detector-on time) | Marked lightcurve |
|---|---|---|---|---|---|---|---|
| A | 7122 | 5994 | 0 | 0 | 0.00% | 0.00% | 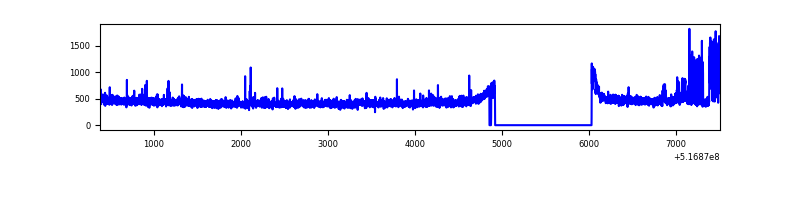 |
| B | 7122 | 5994 | 14 | 14 | 0.20% | 0.23% | 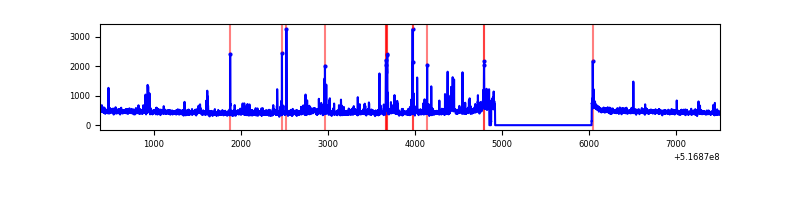 |
| C | 7122 | 5994 | 74 | 74 | 1.04% | 1.23% | 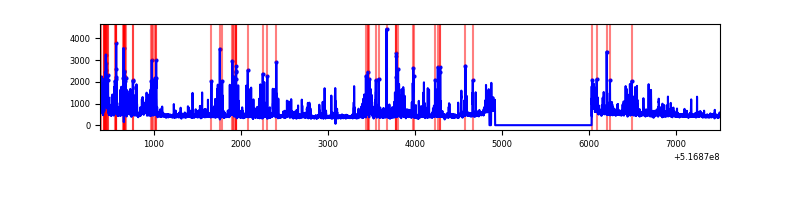 |
| D | 7122 | 5994 | 201 | 201 | 2.82% | 3.35% | 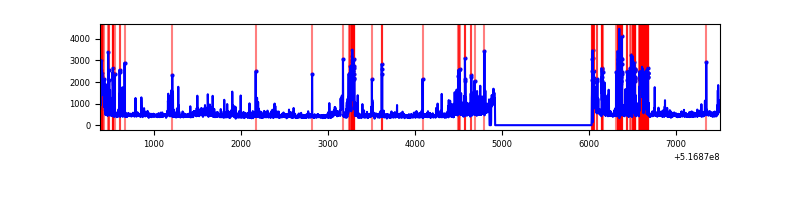 |
Top three noisy pixels from each quadrant. If the there are fewer than three noisy pixels in the level2.evt file, extra rows are filled as -1
| Pixel properties | Quadrant properties | ||||||
|---|---|---|---|---|---|---|---|
| Quadrant | DetID | PixID | Counts | Sigma | Mean | Median | Sigma |
| A | 0 | 12 | 153739 | 931.54 | 664 | 649 | 164.3 |
| A | 10 | 251 | 21503 | 126.89 | 664 | 649 | 164.3 |
| A | 11 | 31 | 13843 | 80.28 | 664 | 649 | 164.3 |
| B | 0 | 171 | 57760 | 409.26 | 651 | 628 | 139.6 |
| B | 4 | 206 | 40116 | 282.87 | 651 | 628 | 139.6 |
| B | 15 | 69 | 29644 | 207.86 | 651 | 628 | 139.6 |
| C | 15 | 224 | 769937 | 4423.46 | 639 | 633 | 173.9 |
| C | 14 | 254 | 119713 | 684.7 | 639 | 633 | 173.9 |
| C | 14 | 245 | 68980 | 392.99 | 639 | 633 | 173.9 |
| D | 8 | 160 | 479713 | 2671.88 | 634 | 604 | 179.3 |
| D | 2 | 249 | 221088 | 1229.59 | 634 | 604 | 179.3 |
| D | 7 | 96 | 161298 | 896.15 | 634 | 604 | 179.3 |
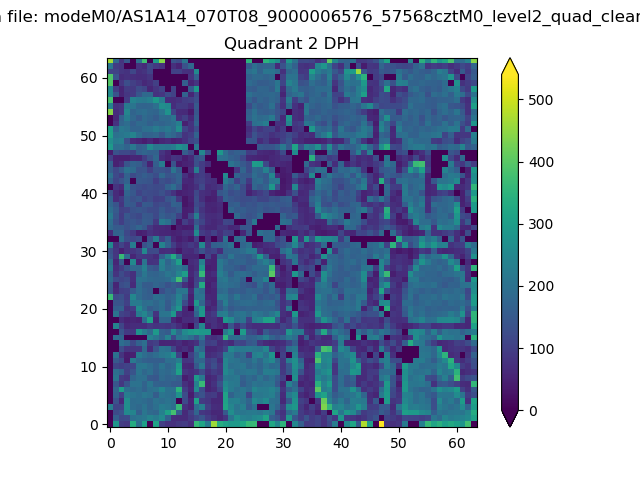
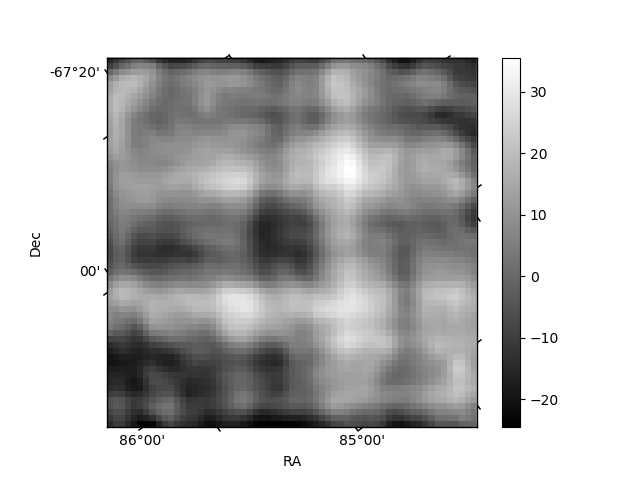
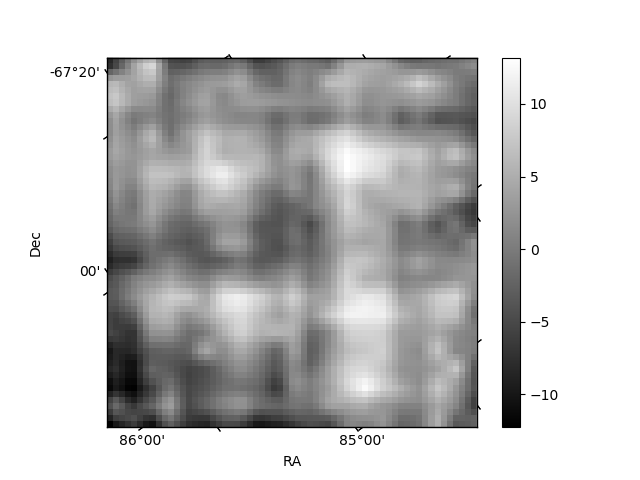
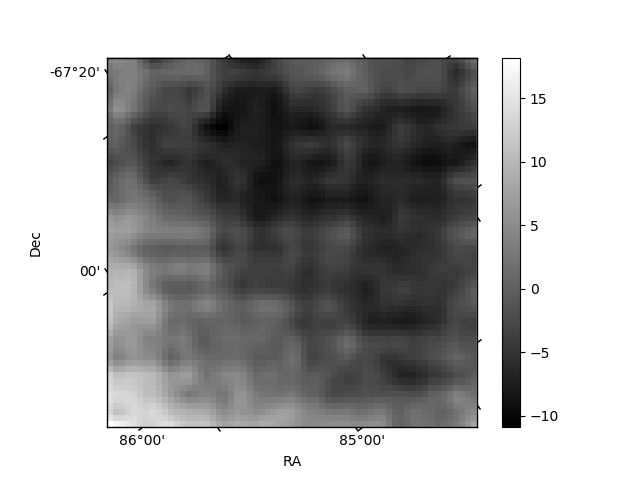
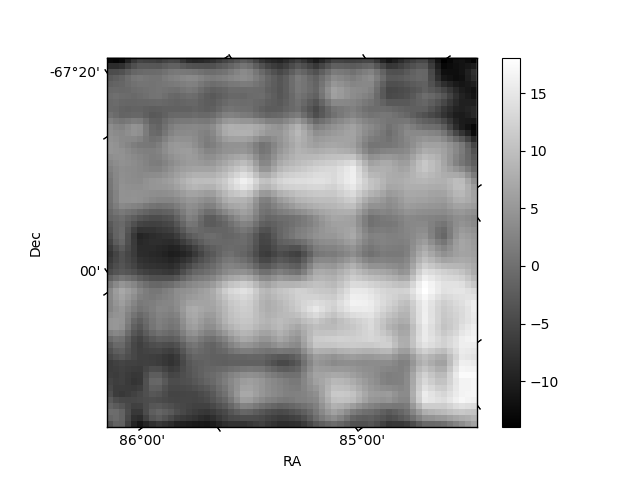
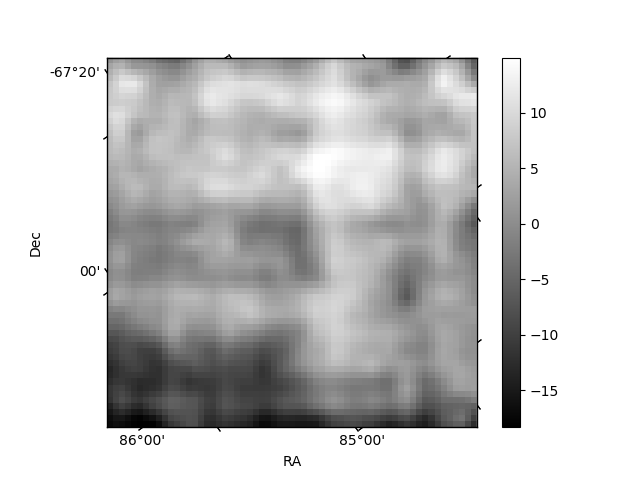
Histogram calculated using DETX and DETY for each event in the final _common_clean file
| Quadrant A | 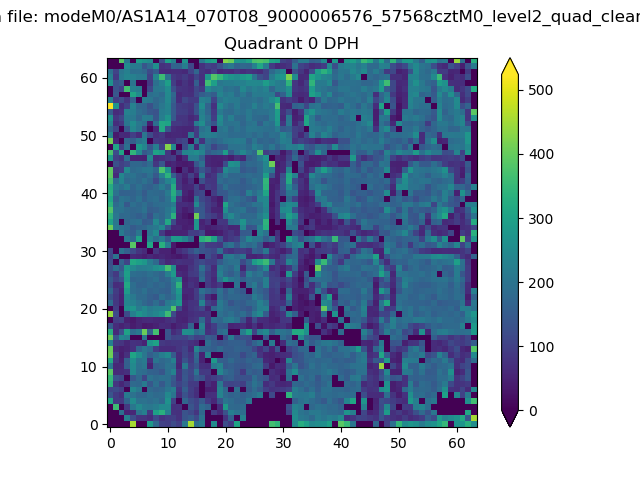 |
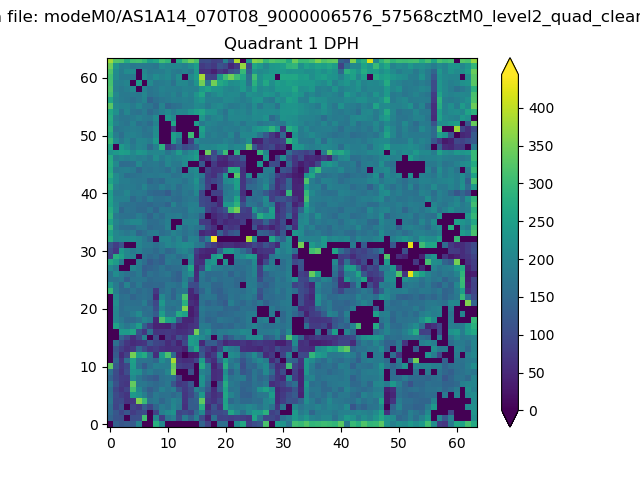 |
Quadrant B |
|---|---|---|---|
| Quadrant D | 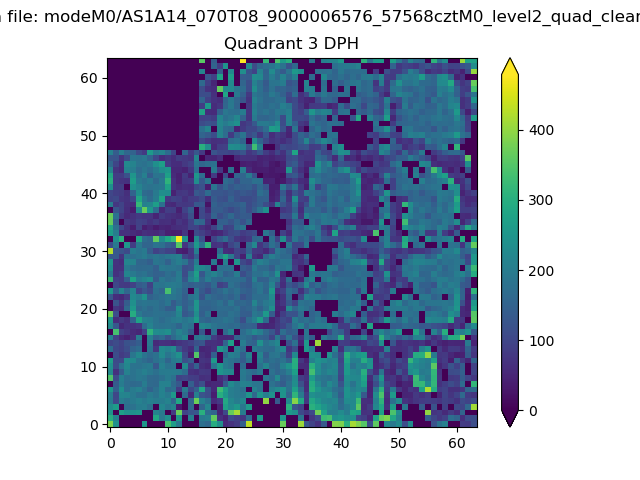 |
 |
Quadrant C |
| Plot type | Count rate plots | Images |
|---|---|---|
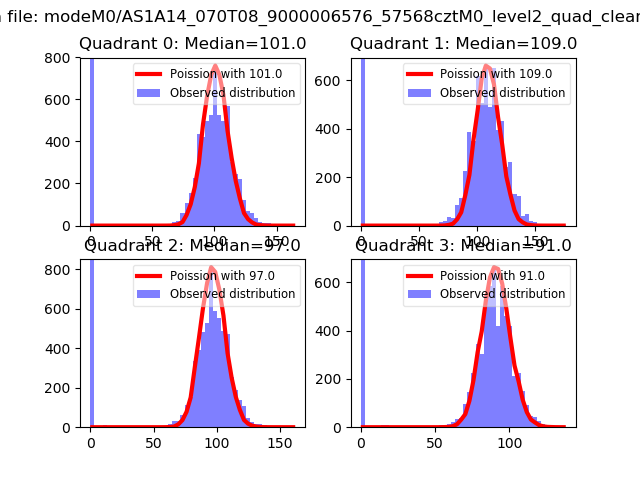
| Comparison with Poisson distribution Blue bars denote a histogram of data divided into 1 sec bins. Red curve is a Poisson curve with rate = median count rate of data. |
 |
 |
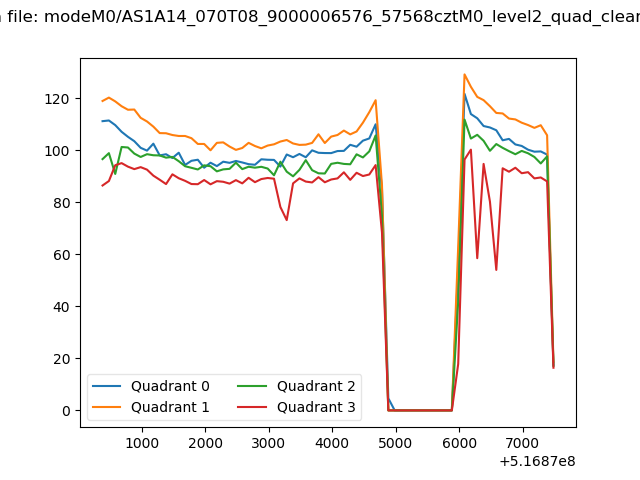
| Quadrant-wise count rates Data is divided into 100 sec bins |
 |
|
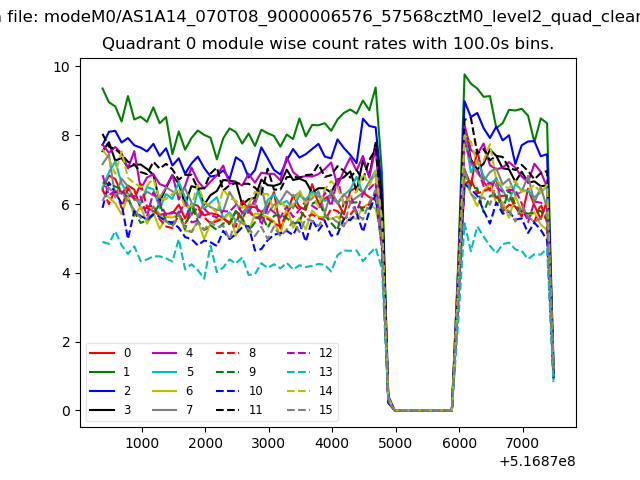
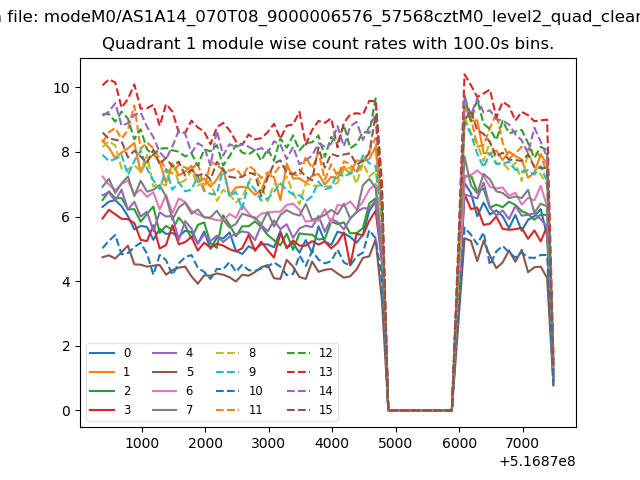
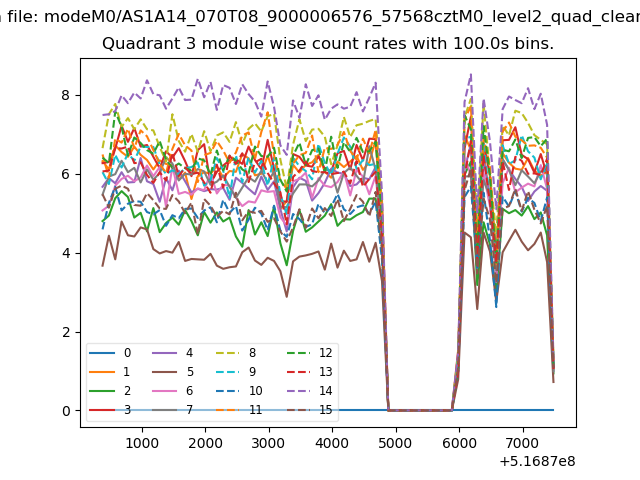
| Module-wise count rates for Quadrant A Data is divided into 100 sec bins |
 |
 |
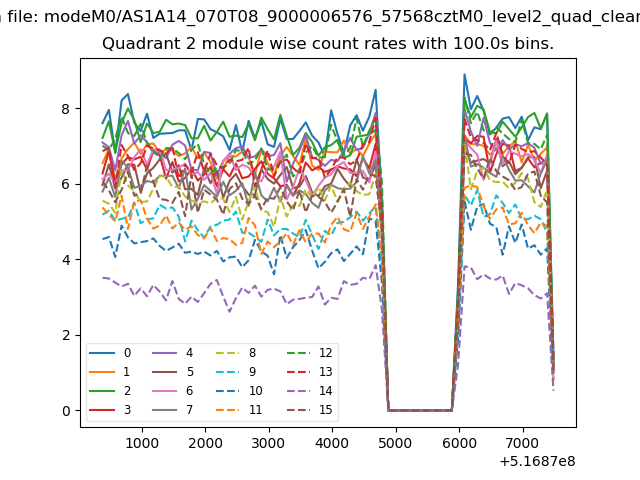
| Module-wise count rates for Quadrant B Data is divided into 100 sec bins |
 |
 |
| Module-wise count rates for Quadrant C Data is divided into 100 sec bins |
 |
 |
| Module-wise count rates for Quadrant D Data is divided into 100 sec bins |
 |
 |
| Parameter | Plot |
|---|---|
| CZT HV Monitor | 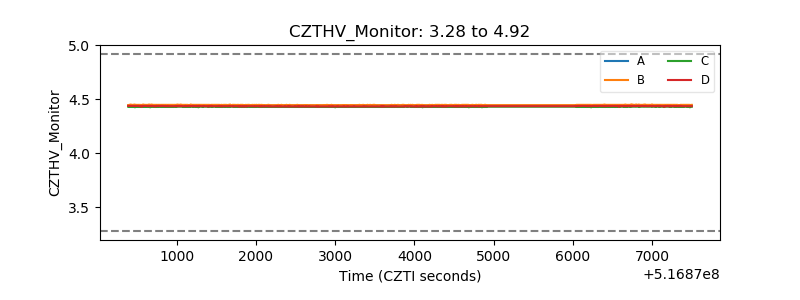 |
| D_VDD | 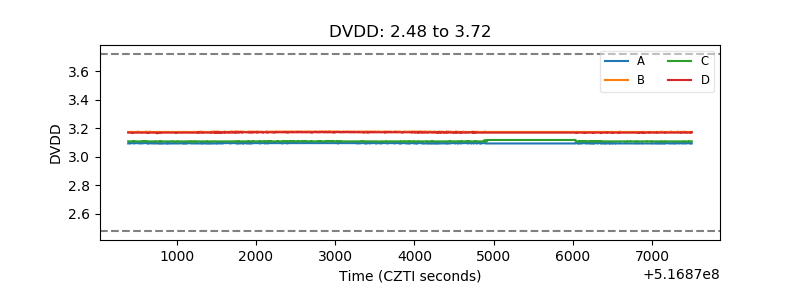 |
| Temperature 1 | 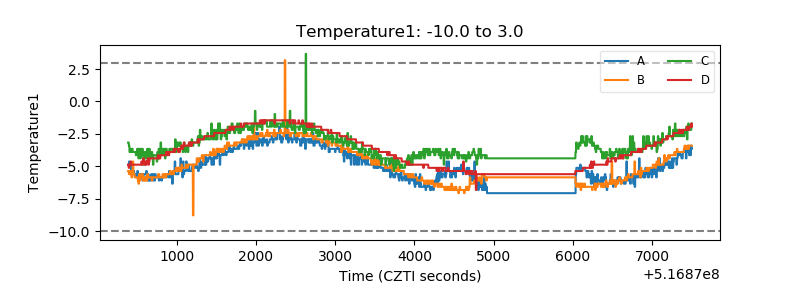 |
| Veto HV Monitor | 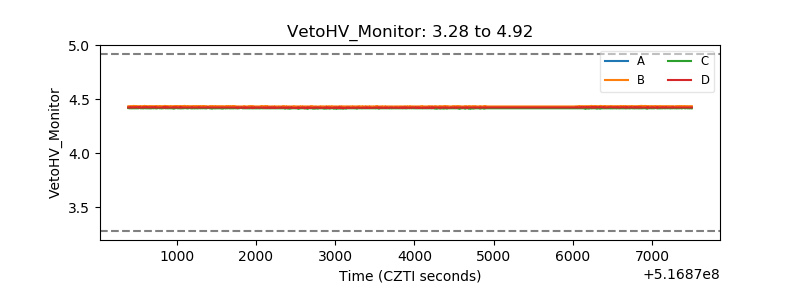 |
| Veto LLD | 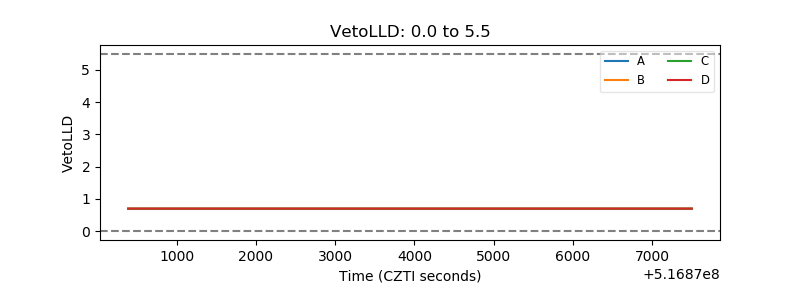 |
| Alpha Counter | 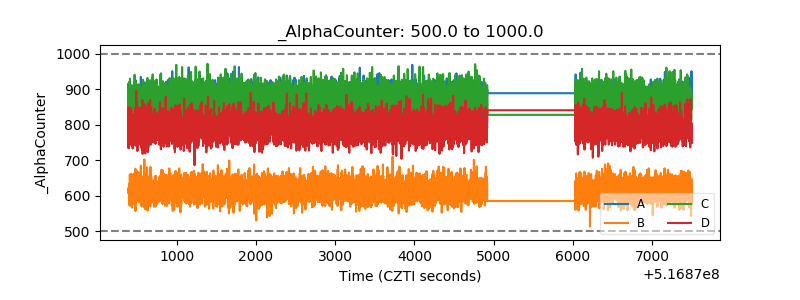 |
| _CPM_Rate | 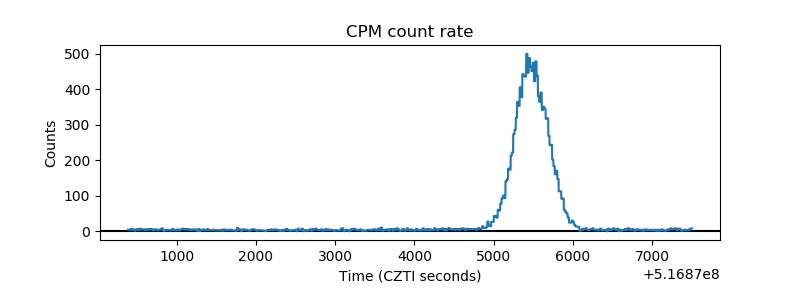 |
| CZT Counter | 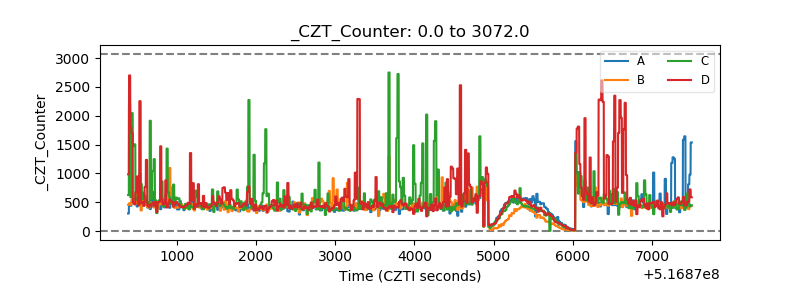 |
| +2.5 Volts monitor |  |
| +5 Volts monitor |  |
| _ROLL_ROT | 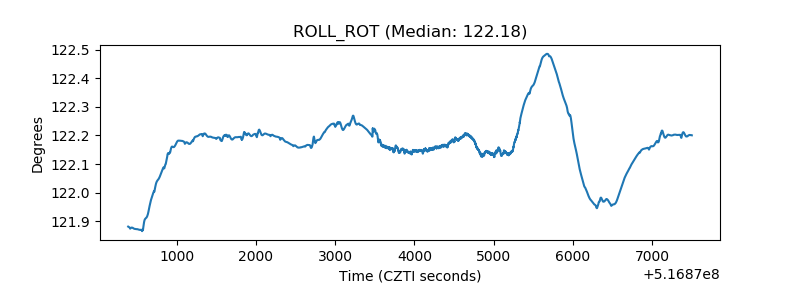 |
| _Roll_DEC | 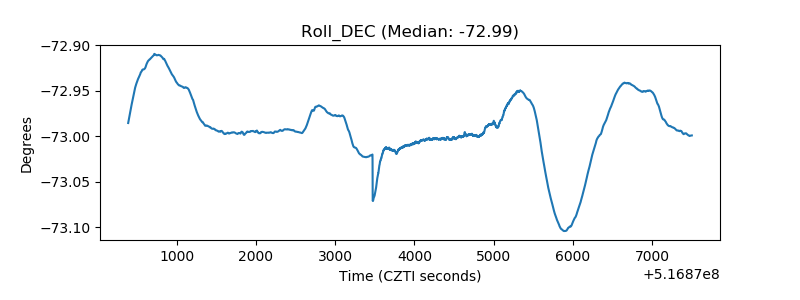 |
| _Roll_RA | 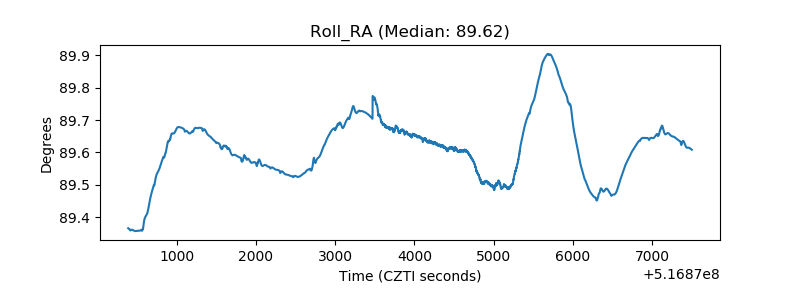 |
| Veto Counter | 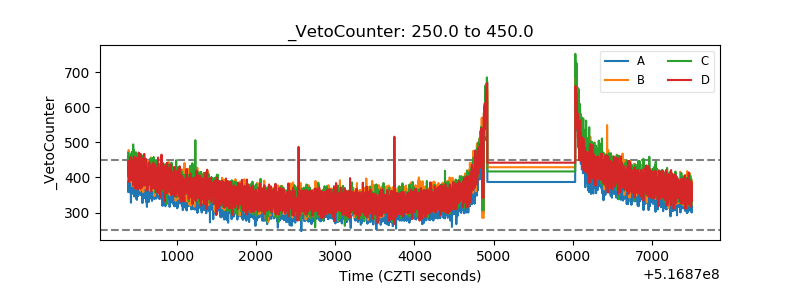 |