| Param | Original file | Final file |
|---|---|---|
| Filename | modeM0/AS1A14_070T08_9000006576_57572cztM0_level2.fits | modeM0/AS1A14_070T08_9000006576_57572cztM0_level2_quad_clean.evt |
| Size (bytes) | 493,300,800 | 90,797,760 |
| Size | 470.4 MB | 86.6 MB |
| Events in quadrant A | 3,050,823 | 593,818 |
| Events in quadrant B | 3,536,564 | 630,252 |
| Events in quadrant C | 6,048,175 | 521,422 |
| Events in quadrant D | 5,086,656 | 520,548 |
| Mode M0 | |||
|---|---|---|---|
| Quadrant | BADHDUFLAG | Total packets | Discarded packets |
| A | 0 | 14212 | 0 |
| B | 0 | 15332 | 0 |
| C | 0 | 23020 | 1 |
| D | 0 | 19861 | 0 |
| Mode SS | |||
|---|---|---|---|
| Quadrant | BADHDUFLAG | Total packets | Discarded packets |
| A | 0 | 140 | 0 |
| B | 0 | 140 | 0 |
| C | 0 | 140 | 0 |
| D | 0 | 140 | 0 |
| Quadrant | Total seconds | Saturated seconds | Saturation percentage |
|---|---|---|---|
| A | 6928 | 18 | 0.259815% |
| B | 6928 | 55 | 0.793880% |
| C | 6927 | 772 | 11.144796% |
| D | 6928 | 413 | 5.961316% |
Noise dominated data is calculated using 1-second bins in cleaned event files. If a bin has >2000 counts, and if more than 50% of those come from <1% of pixels, then it is considered to be noise-dominated and hence unusable.
| Quadrant | # 1 sec bins | Bins with >0 counts | Bins with >2000 counts | High rate bins dominated by noise | Noise dominated (total time) | Noise dominated (detector-on time) | Marked lightcurve |
|---|---|---|---|---|---|---|---|
| A | 7217 | 7217 | 1 | 1 | 0.01% | 0.01% | 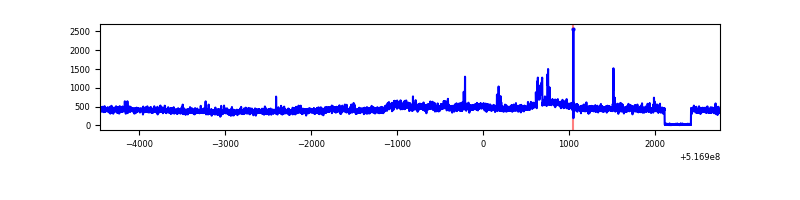 |
| B | 7217 | 7217 | 32 | 32 | 0.44% | 0.44% | 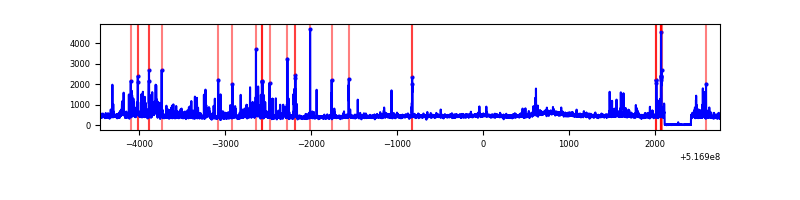 |
| C | 7216 | 7216 | 558 | 558 | 7.73% | 7.73% | 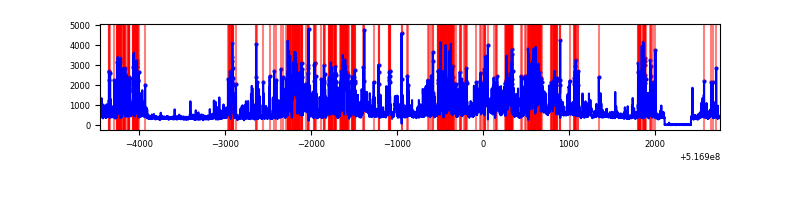 |
| D | 7218 | 7218 | 295 | 295 | 4.09% | 4.09% | 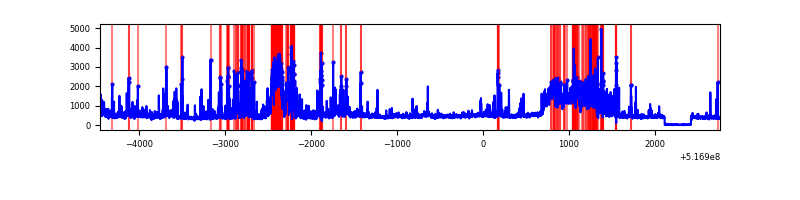 |
Top three noisy pixels from each quadrant. If the there are fewer than three noisy pixels in the level2.evt file, extra rows are filled as -1
| Pixel properties | Quadrant properties | ||||||
|---|---|---|---|---|---|---|---|
| Quadrant | DetID | PixID | Counts | Sigma | Mean | Median | Sigma |
| A | 3 | 14 | 134823 | 728.26 | 745 | 726 | 184.1 |
| A | 10 | 251 | 17873 | 93.12 | 745 | 726 | 184.1 |
| A | 3 | 137 | 9046 | 45.18 | 745 | 726 | 184.1 |
| B | 10 | 247 | 175250 | 1122.49 | 732 | 704 | 155.5 |
| B | 8 | 128 | 116616 | 745.42 | 732 | 704 | 155.5 |
| B | 0 | 245 | 65133 | 414.34 | 732 | 704 | 155.5 |
| C | 15 | 224 | 2164910 | 11489.47 | 687 | 679 | 188.4 |
| C | 12 | 254 | 564848 | 2995.06 | 687 | 679 | 188.4 |
| C | 14 | 245 | 363696 | 1927.18 | 687 | 679 | 188.4 |
| D | 8 | 160 | 619524 | 3084.62 | 707 | 676 | 200.6 |
| D | 15 | 142 | 434255 | 2161.15 | 707 | 676 | 200.6 |
| D | 2 | 249 | 379562 | 1888.54 | 707 | 676 | 200.6 |
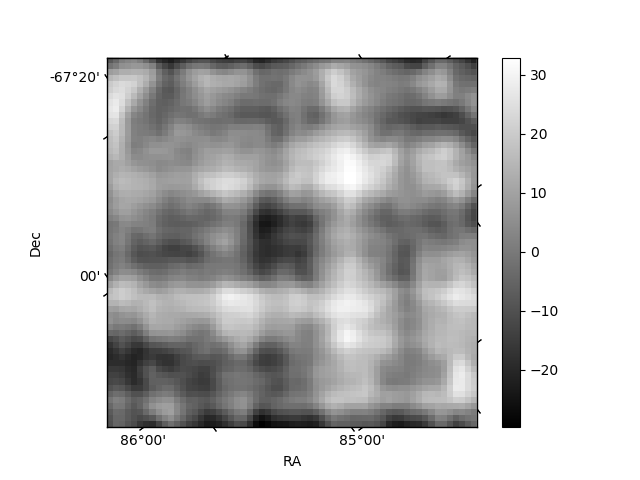
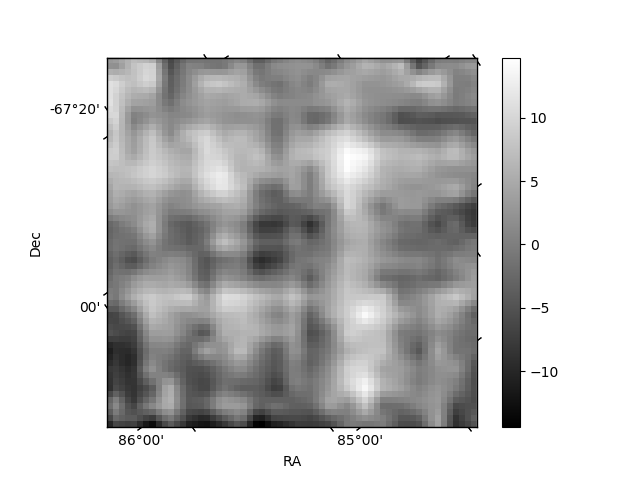
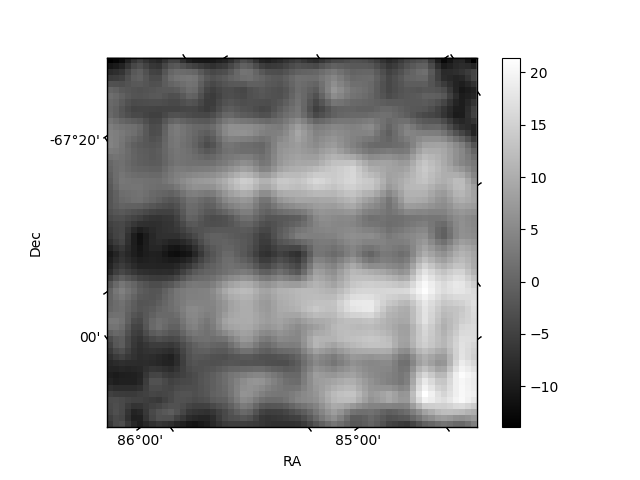
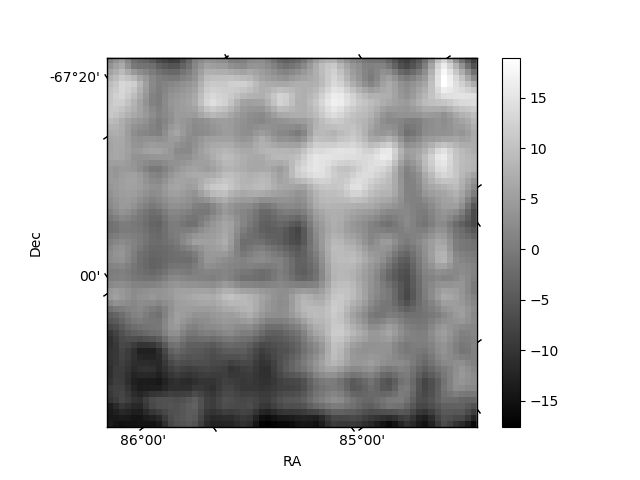
Histogram calculated using DETX and DETY for each event in the final _common_clean file
| Quadrant A | 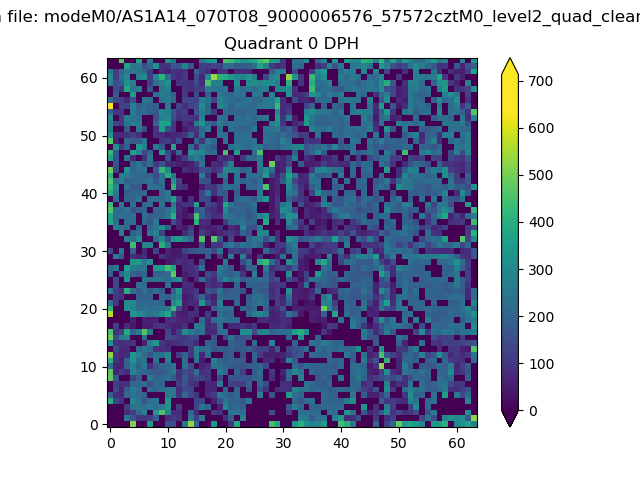 |
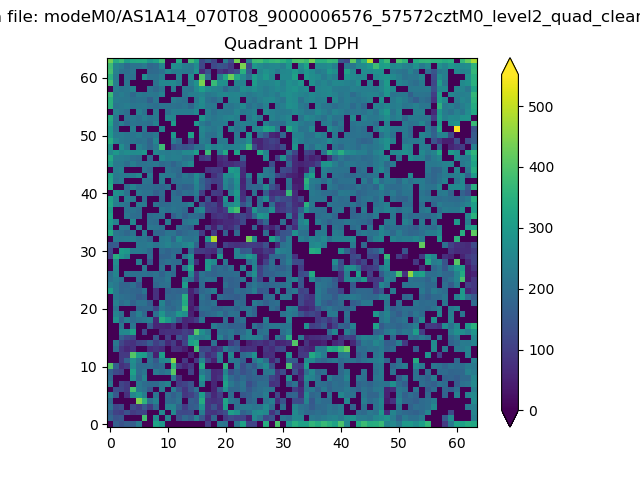 |
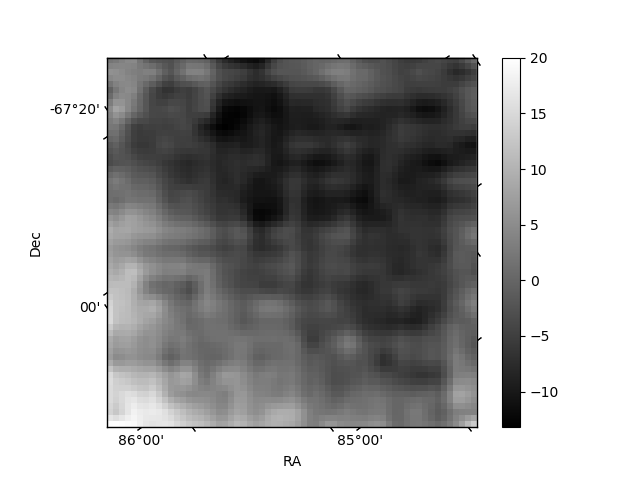
Quadrant B |
|---|---|---|---|
| Quadrant D | 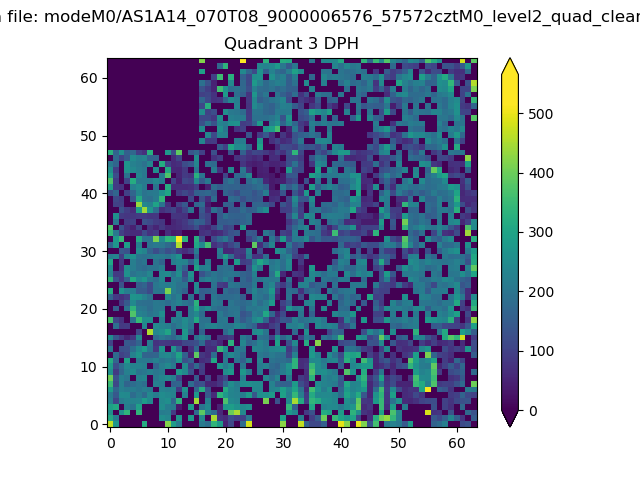 |
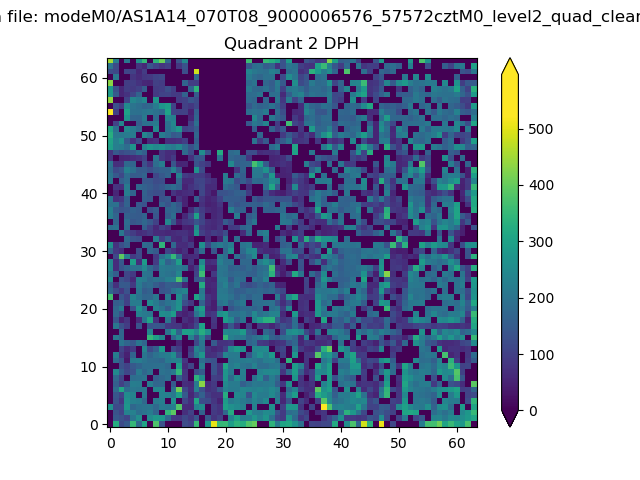 |
Quadrant C |
| Plot type | Count rate plots | Images |
|---|---|---|
| Comparison with Poisson distribution Blue bars denote a histogram of data divided into 1 sec bins. Red curve is a Poisson curve with rate = median count rate of data. |
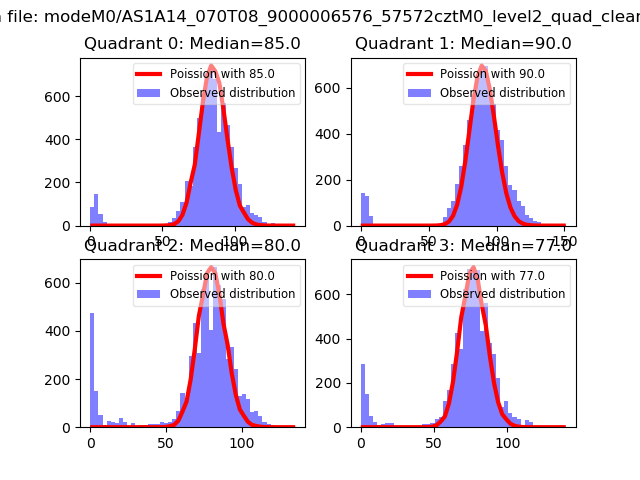 |
 |
| Quadrant-wise count rates Data is divided into 100 sec bins |
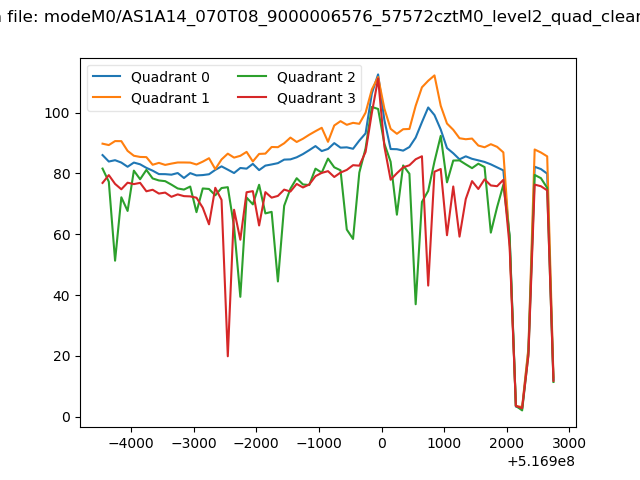 |
|
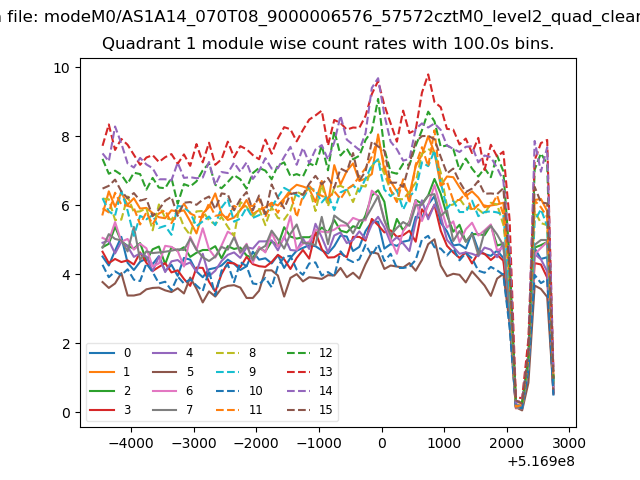
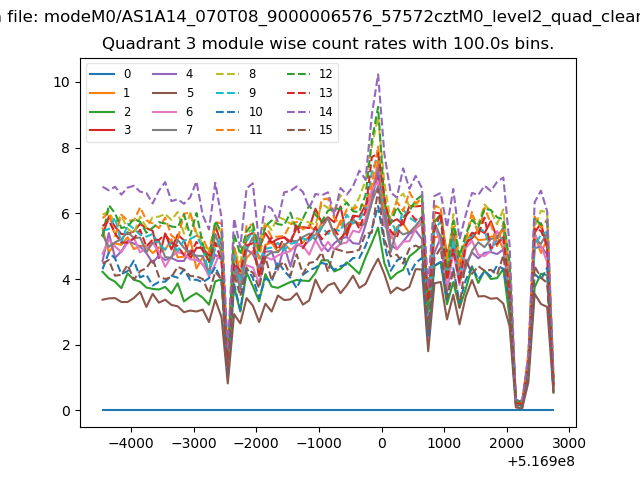
| Module-wise count rates for Quadrant A Data is divided into 100 sec bins |
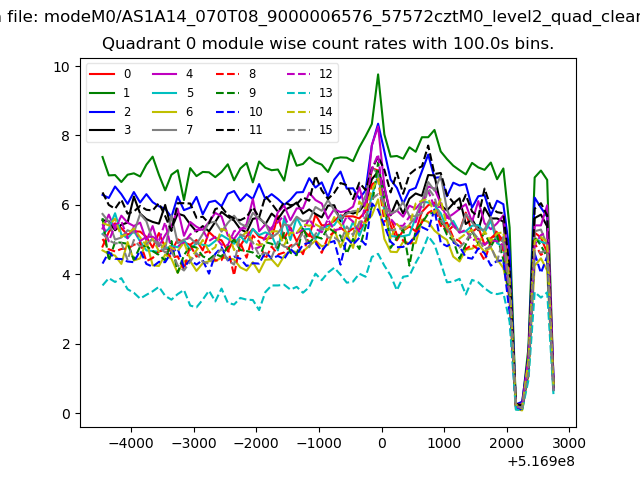 |
 |
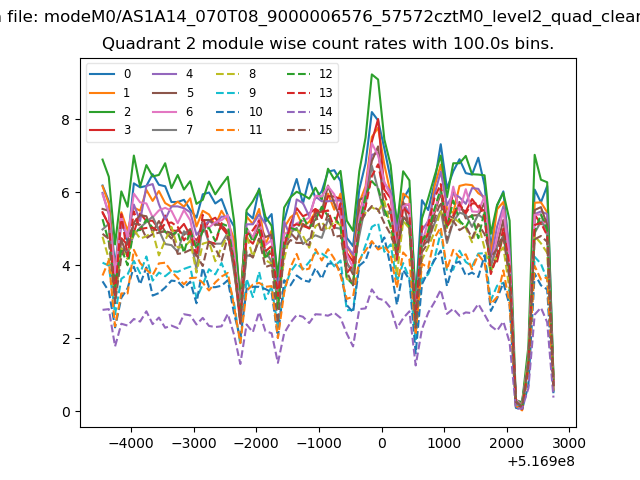
| Module-wise count rates for Quadrant B Data is divided into 100 sec bins |
 |
 |
| Module-wise count rates for Quadrant C Data is divided into 100 sec bins |
 |
 |
| Module-wise count rates for Quadrant D Data is divided into 100 sec bins |
 |
 |
| Parameter | Plot |
|---|---|
| CZT HV Monitor | 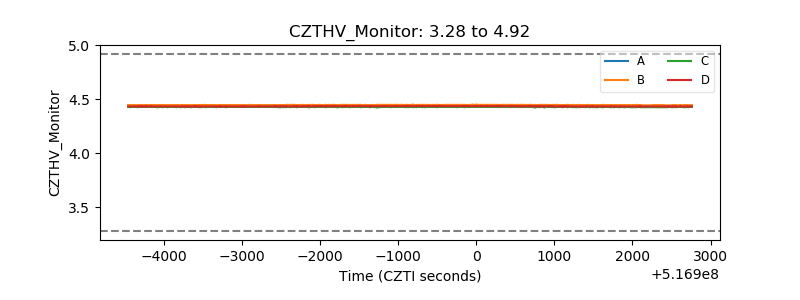 |
| D_VDD | 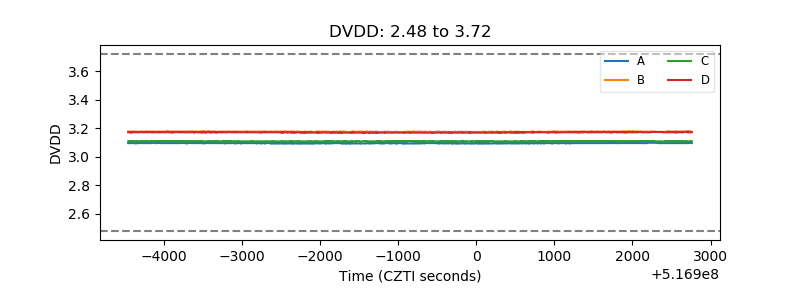 |
| Temperature 1 | 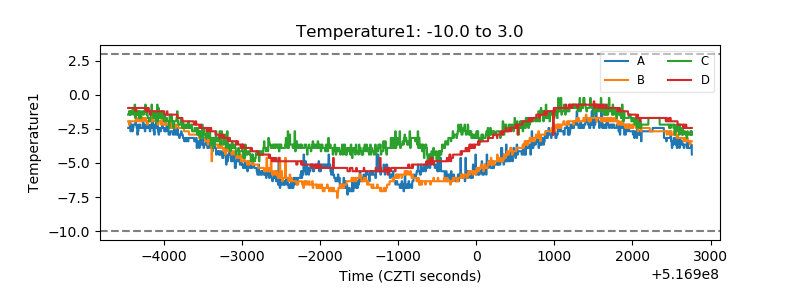 |
| Veto HV Monitor | 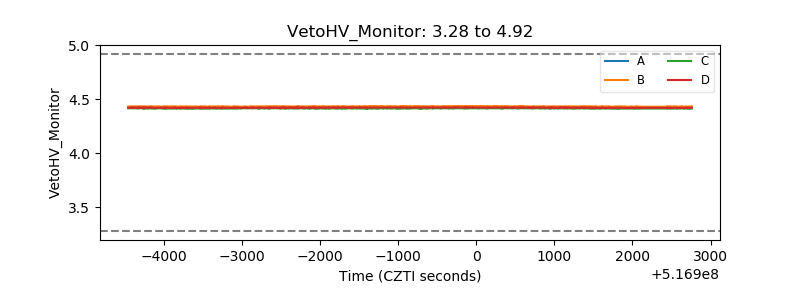 |
| Veto LLD | 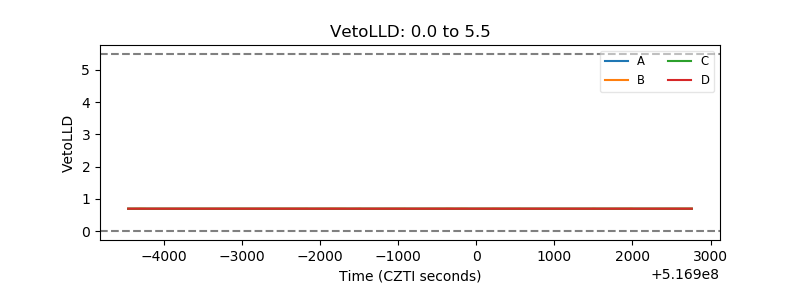 |
| Alpha Counter | 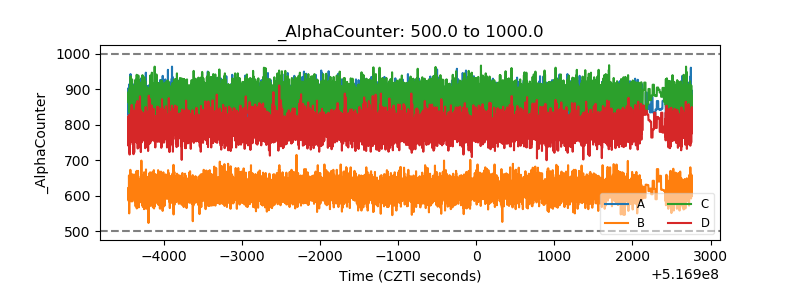 |
| _CPM_Rate | 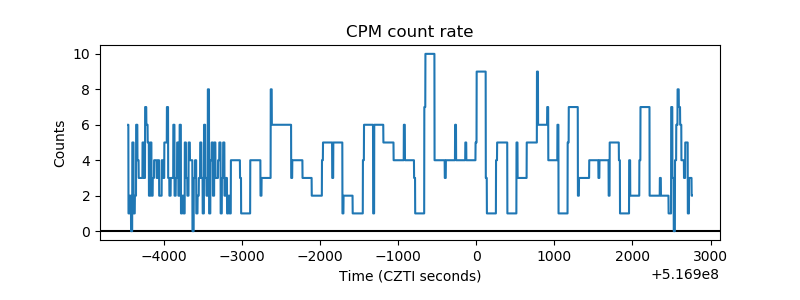 |
| CZT Counter | 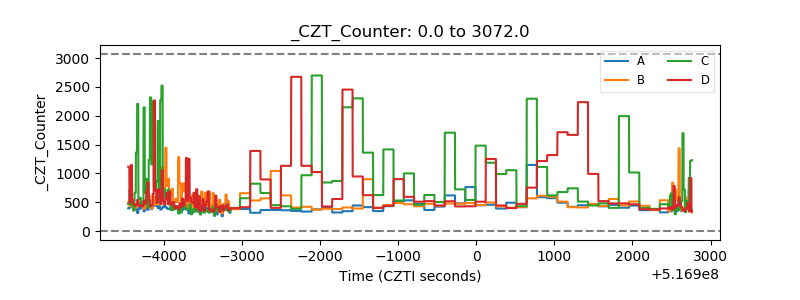 |
| +2.5 Volts monitor | 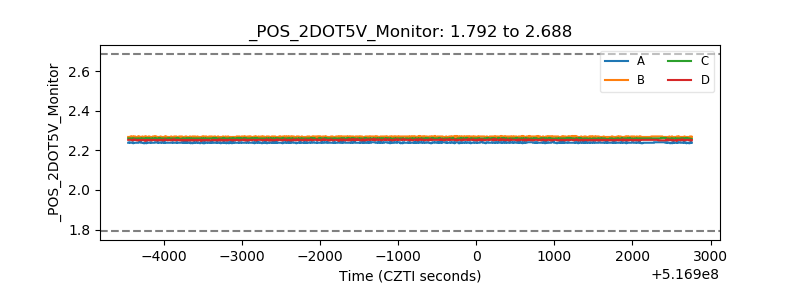 |
| +5 Volts monitor | 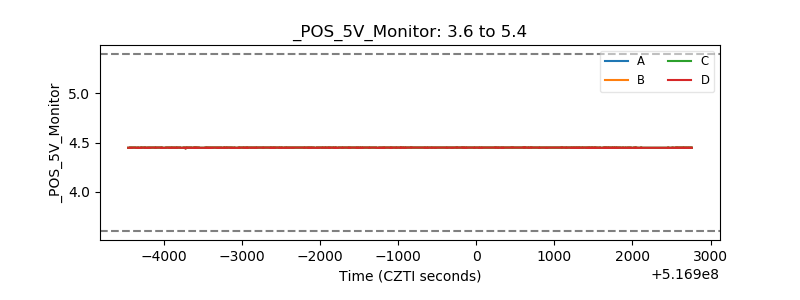 |
| _ROLL_ROT | 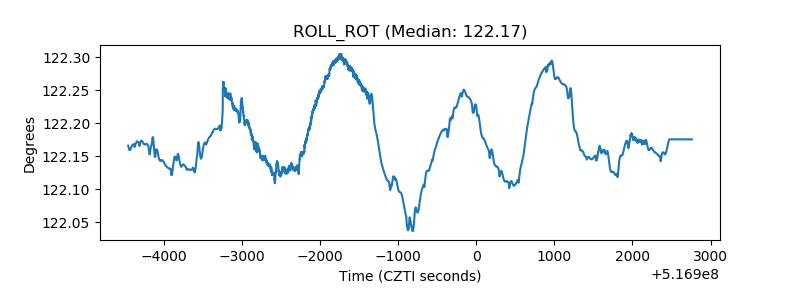 |
| _Roll_DEC | 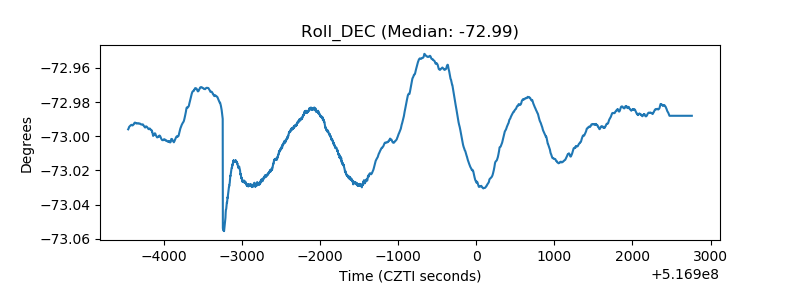 |
| _Roll_RA | 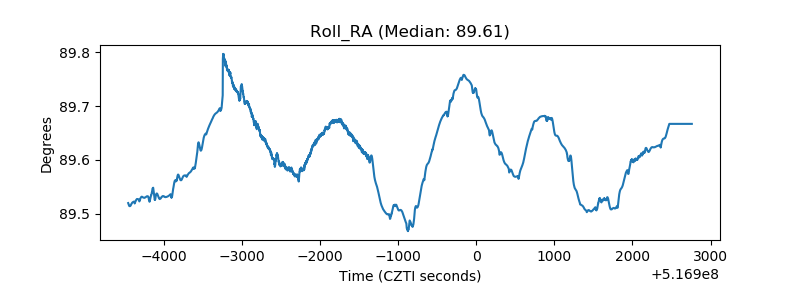 |
| Veto Counter | 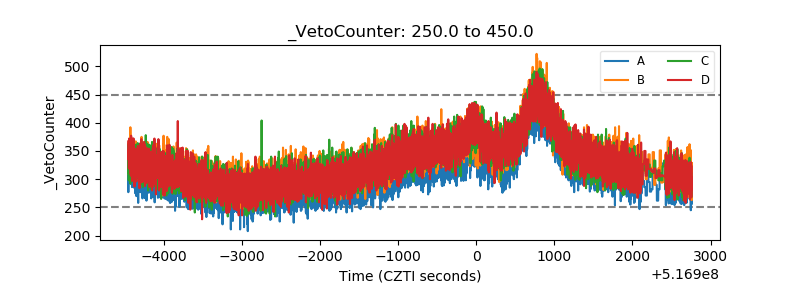 |