| Param | Original file | Final file |
|---|---|---|
| Filename | modeM0/AS1A14_070T08_9000006576_57573cztM0_level2.fits | modeM0/AS1A14_070T08_9000006576_57573cztM0_level2_quad_clean.evt |
| Size (bytes) | 517,777,920 | 88,053,120 |
| Size | 493.8 MB | 84.0 MB |
| Events in quadrant A | 3,114,204 | 571,920 |
| Events in quadrant B | 3,579,780 | 602,227 |
| Events in quadrant C | 7,622,768 | 465,373 |
| Events in quadrant D | 4,285,557 | 520,603 |
| Mode M0 | |||
|---|---|---|---|
| Quadrant | BADHDUFLAG | Total packets | Discarded packets |
| A | 0 | 14824 | 0 |
| B | 0 | 15837 | 0 |
| C | 0 | 27811 | 0 |
| D | 0 | 17878 | 0 |
| Mode SS | |||
|---|---|---|---|
| Quadrant | BADHDUFLAG | Total packets | Discarded packets |
| A | 0 | 146 | 0 |
| B | 0 | 146 | 0 |
| C | 0 | 146 | 0 |
| D | 0 | 146 | 0 |
| Quadrant | Total seconds | Saturated seconds | Saturation percentage |
|---|---|---|---|
| A | 7259 | 11 | 0.151536% |
| B | 7260 | 71 | 0.977961% |
| C | 7260 | 1260 | 17.355372% |
| D | 7259 | 138 | 1.901088% |
Noise dominated data is calculated using 1-second bins in cleaned event files. If a bin has >2000 counts, and if more than 50% of those come from <1% of pixels, then it is considered to be noise-dominated and hence unusable.
| Quadrant | # 1 sec bins | Bins with >0 counts | Bins with >2000 counts | High rate bins dominated by noise | Noise dominated (total time) | Noise dominated (detector-on time) | Marked lightcurve |
|---|---|---|---|---|---|---|---|
| A | 7549 | 7549 | 0 | 0 | 0.00% | 0.00% | 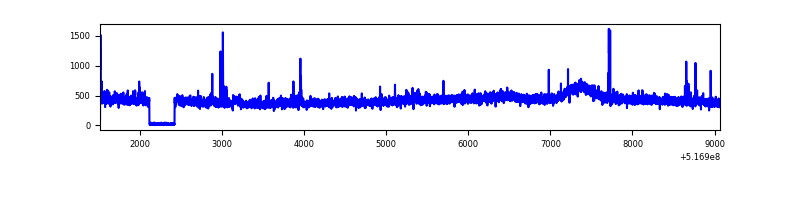 |
| B | 7550 | 7550 | 27 | 27 | 0.36% | 0.36% | 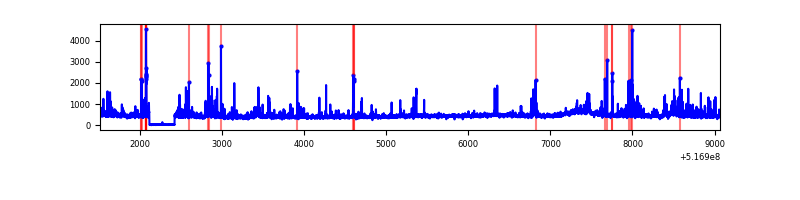 |
| C | 7550 | 7550 | 897 | 897 | 11.88% | 11.88% | 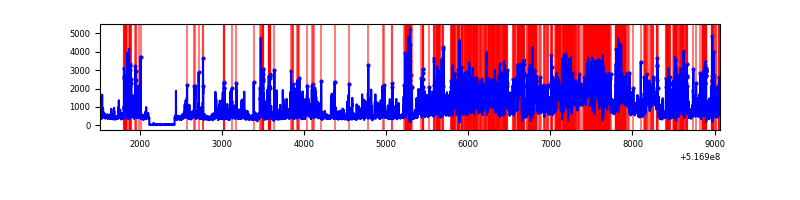 |
| D | 7549 | 7549 | 129 | 129 | 1.71% | 1.71% | 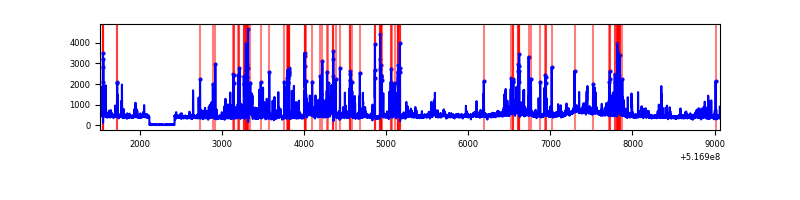 |
Top three noisy pixels from each quadrant. If the there are fewer than three noisy pixels in the level2.evt file, extra rows are filled as -1
| Pixel properties | Quadrant properties | ||||||
|---|---|---|---|---|---|---|---|
| Quadrant | DetID | PixID | Counts | Sigma | Mean | Median | Sigma |
| A | 10 | 251 | 30212 | 153.83 | 781 | 762 | 191.4 |
| A | 3 | 14 | 26341 | 133.61 | 781 | 762 | 191.4 |
| A | 3 | 245 | 18766 | 94.04 | 781 | 762 | 191.4 |
| B | 10 | 247 | 102122 | 618.62 | 765 | 734 | 163.9 |
| B | 0 | 245 | 83412 | 504.46 | 765 | 734 | 163.9 |
| B | 7 | 252 | 65108 | 392.78 | 765 | 734 | 163.9 |
| C | 12 | 254 | 2996019 | 15962.19 | 688 | 679 | 187.7 |
| C | 15 | 224 | 1234252 | 6573.72 | 688 | 679 | 187.7 |
| C | 14 | 254 | 443538 | 2360.0 | 688 | 679 | 187.7 |
| D | 2 | 249 | 644873 | 3027.39 | 747 | 712 | 212.8 |
| D | 3 | 12 | 169387 | 792.73 | 747 | 712 | 212.8 |
| D | 15 | 142 | 133442 | 623.8 | 747 | 712 | 212.8 |
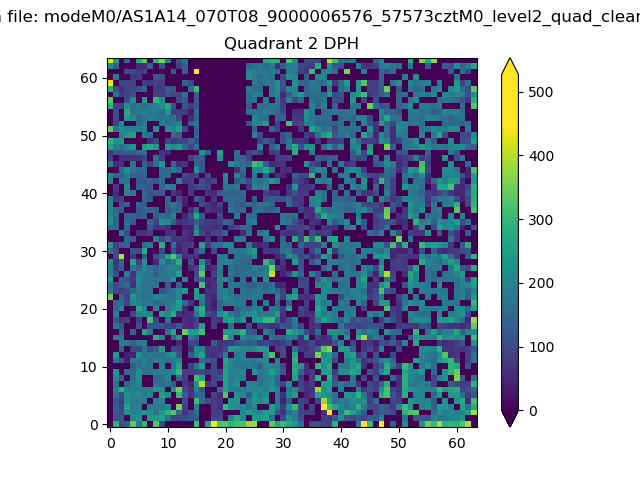
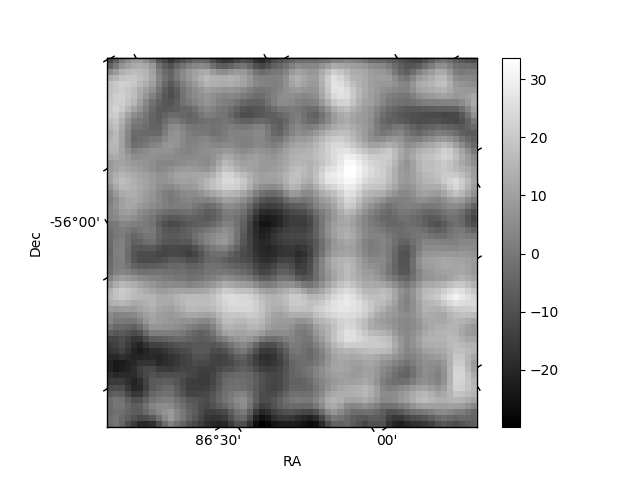
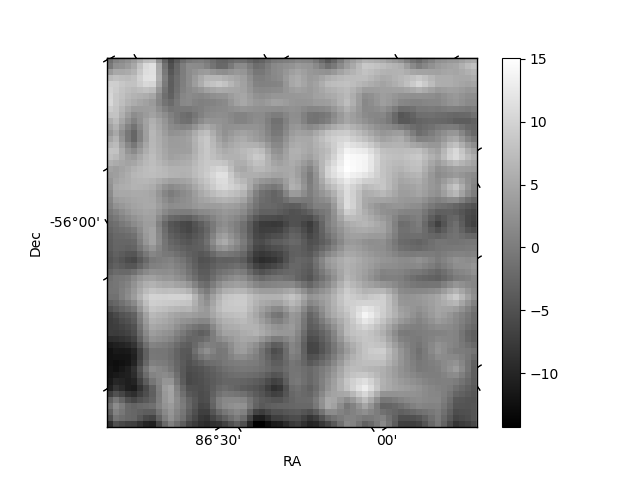
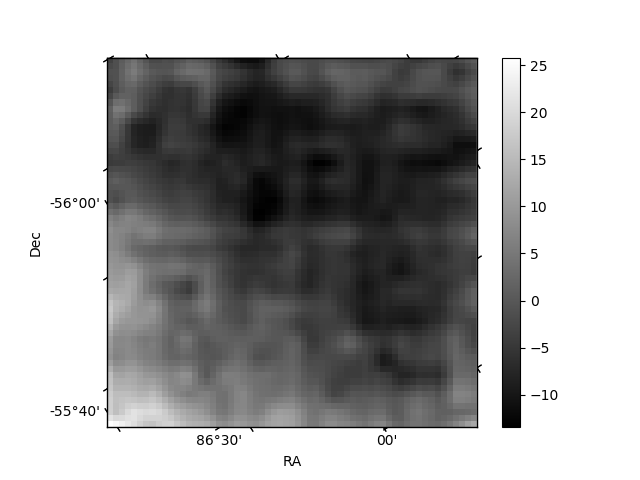
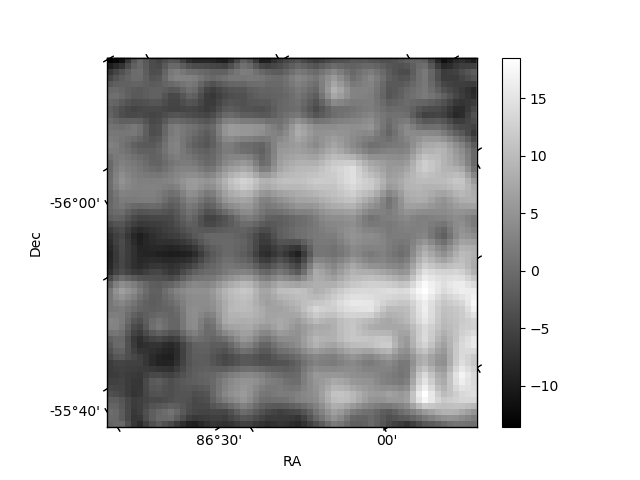
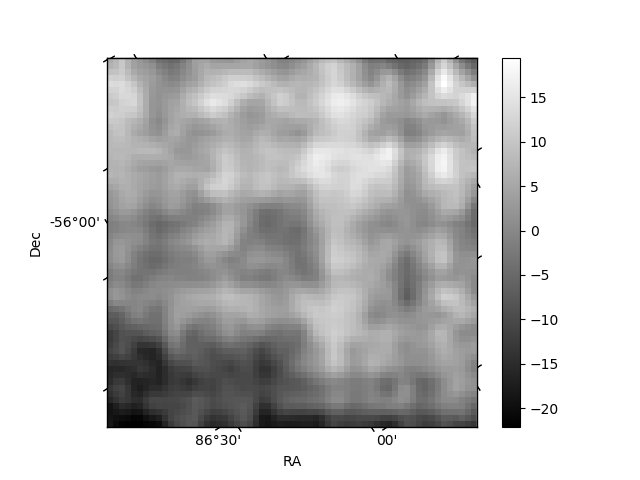
Histogram calculated using DETX and DETY for each event in the final _common_clean file
| Quadrant A | 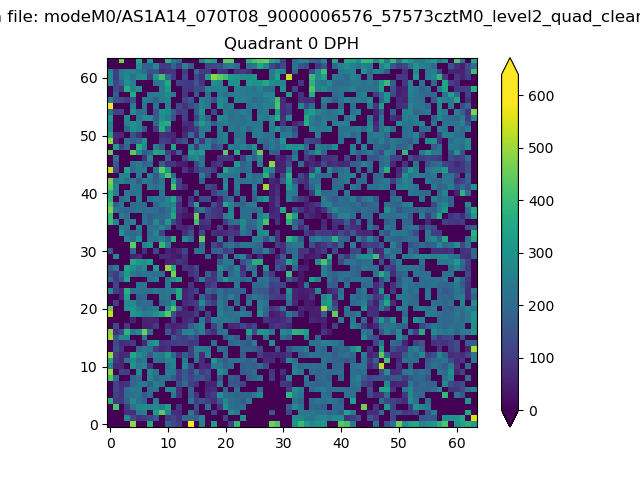 |
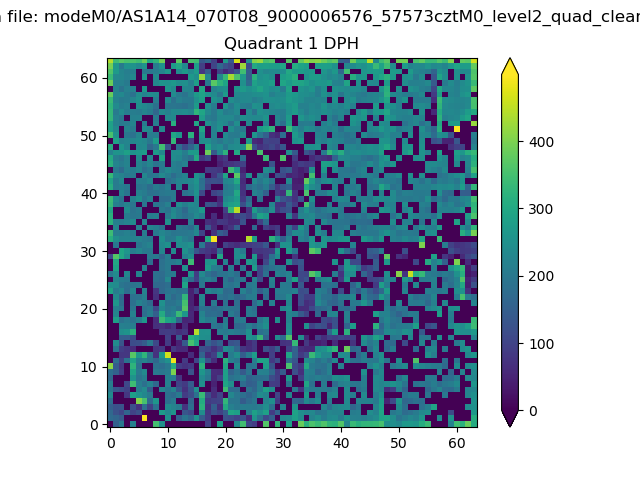 |
Quadrant B |
|---|---|---|---|
| Quadrant D | 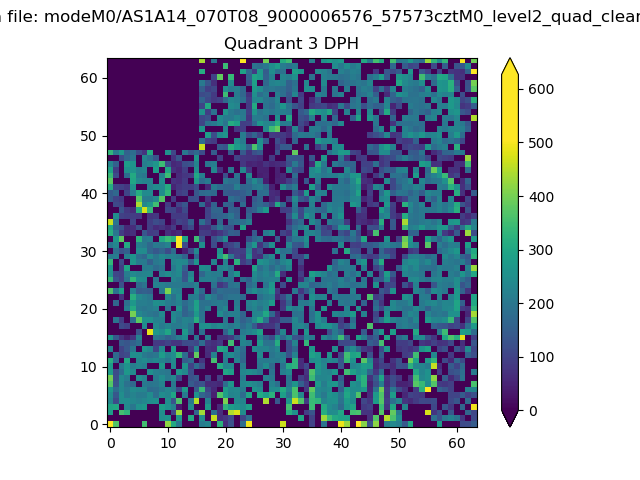 |
 |
Quadrant C |
| Plot type | Count rate plots | Images |
|---|---|---|
| Comparison with Poisson distribution Blue bars denote a histogram of data divided into 1 sec bins. Red curve is a Poisson curve with rate = median count rate of data. |
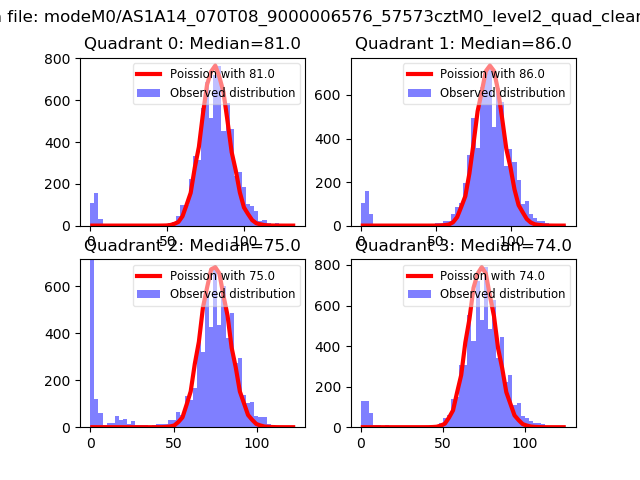 |
 |
| Quadrant-wise count rates Data is divided into 100 sec bins |
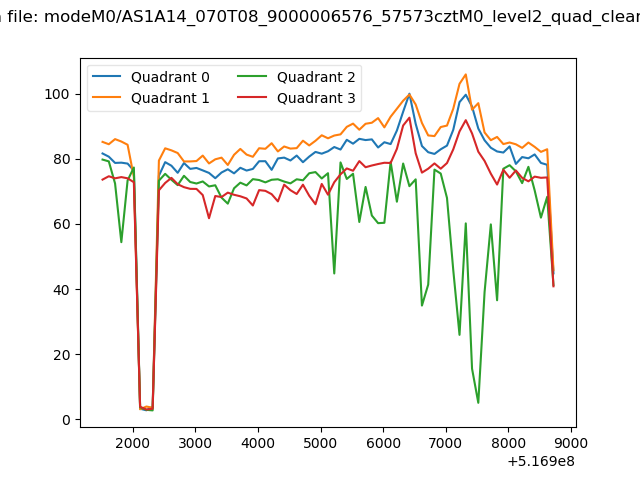 |
|
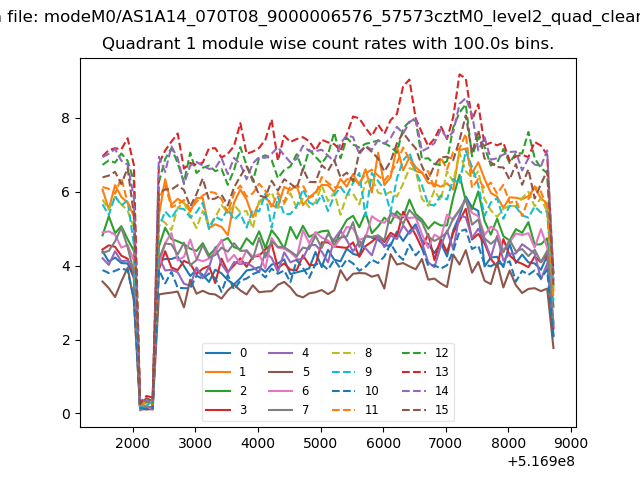
| Module-wise count rates for Quadrant A Data is divided into 100 sec bins |
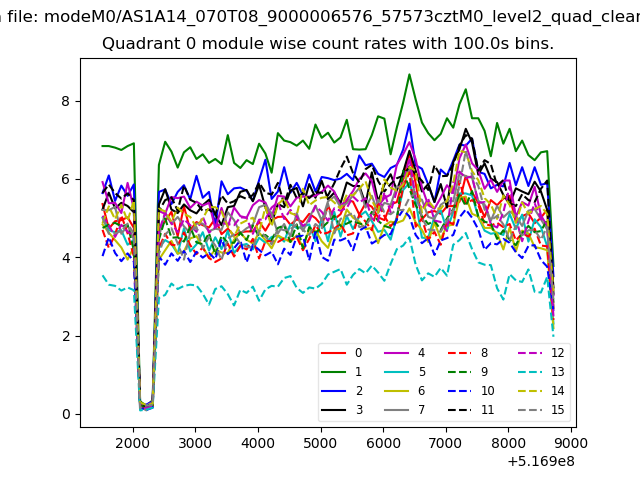 |
 |
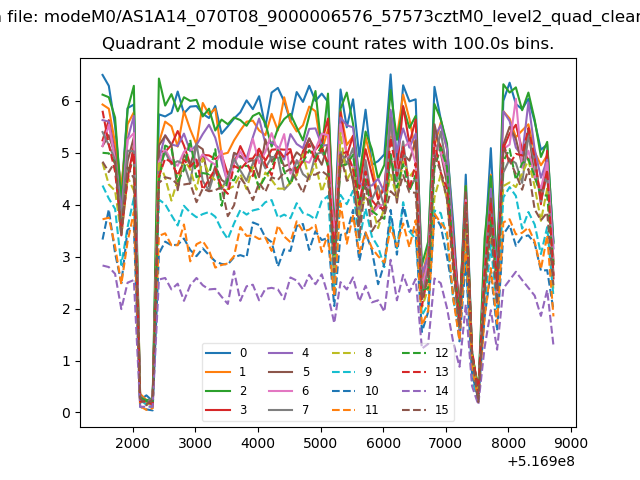
| Module-wise count rates for Quadrant B Data is divided into 100 sec bins |
 |
 |
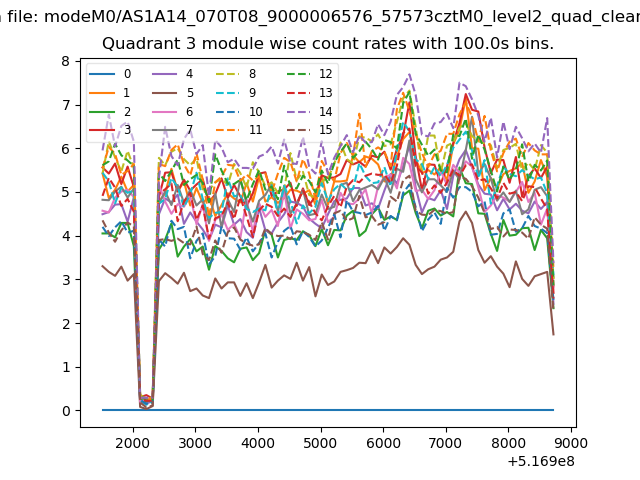
| Module-wise count rates for Quadrant C Data is divided into 100 sec bins |
 |
 |
| Module-wise count rates for Quadrant D Data is divided into 100 sec bins |
 |
 |
| Parameter | Plot |
|---|---|
| CZT HV Monitor | 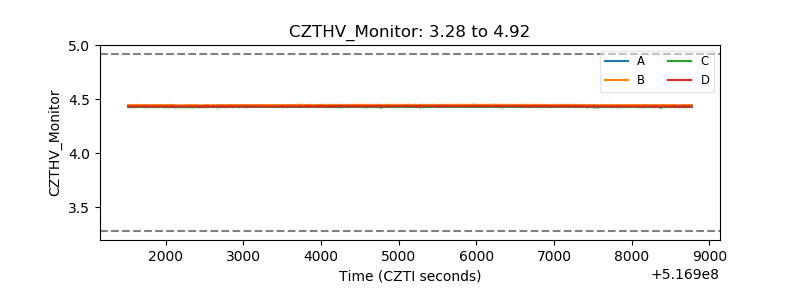 |
| D_VDD | 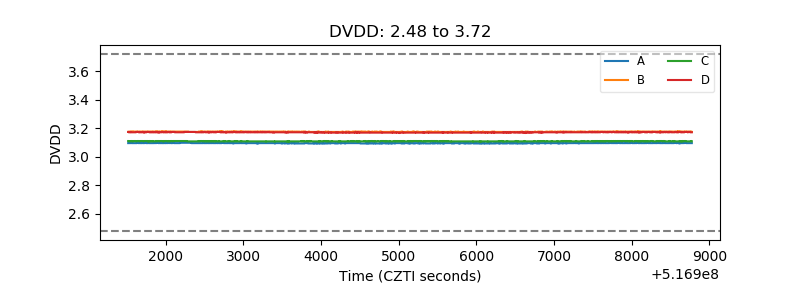 |
| Temperature 1 | 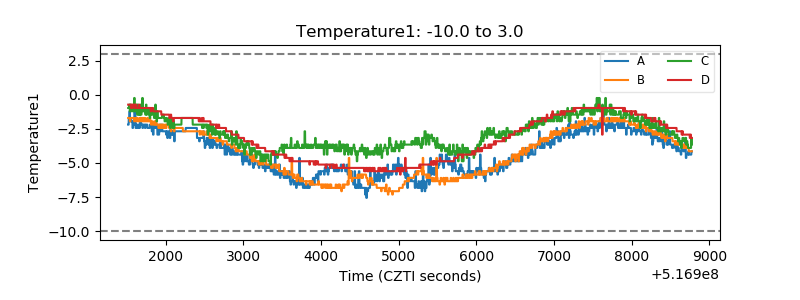 |
| Veto HV Monitor | 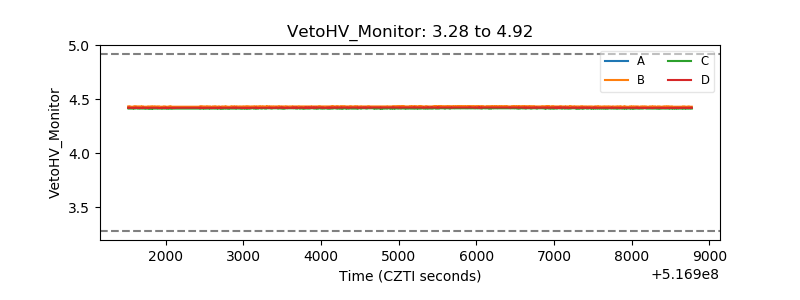 |
| Veto LLD | 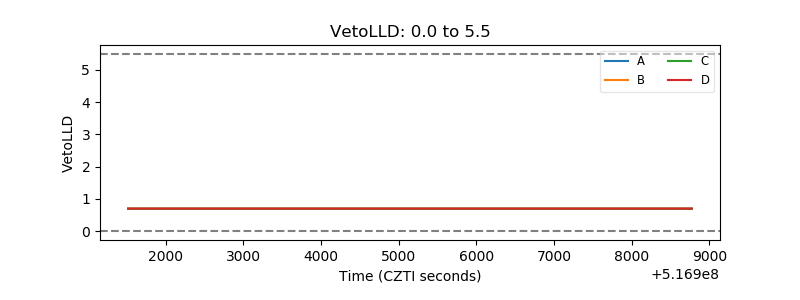 |
| Alpha Counter | 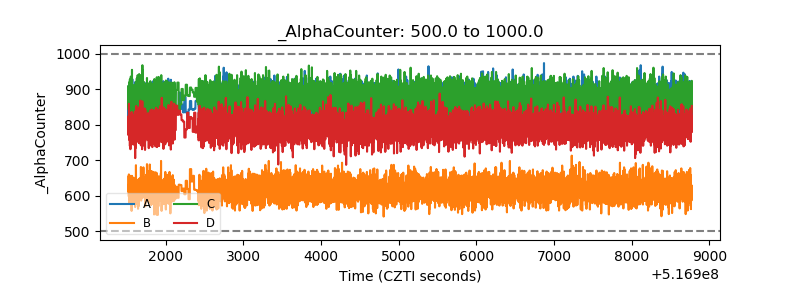 |
| _CPM_Rate | 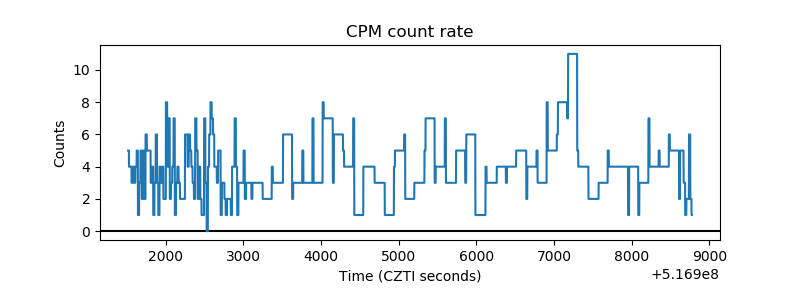 |
| CZT Counter | 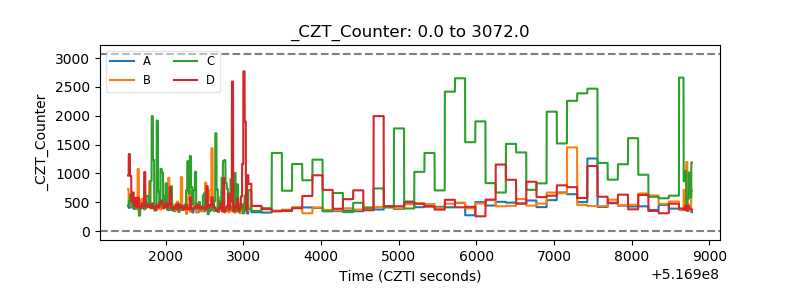 |
| +2.5 Volts monitor | 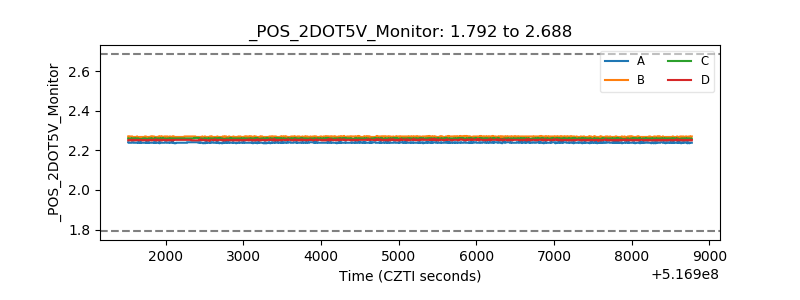 |
| +5 Volts monitor | 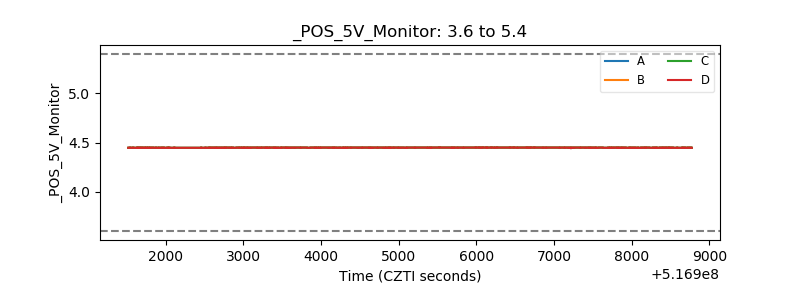 |
| _ROLL_ROT | 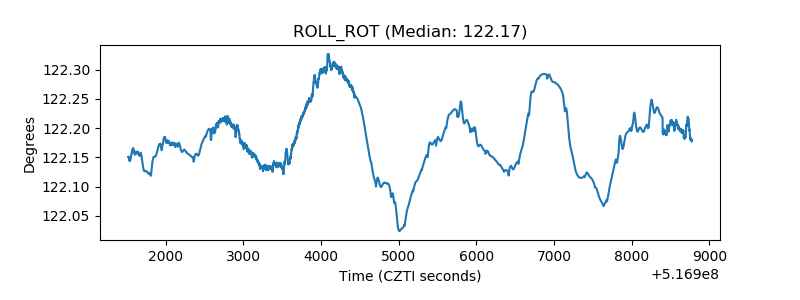 |
| _Roll_DEC | 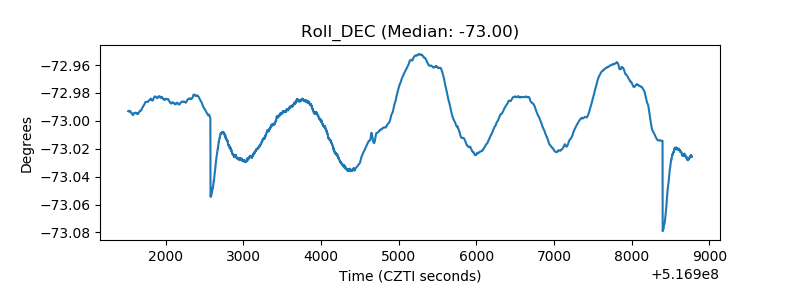 |
| _Roll_RA | 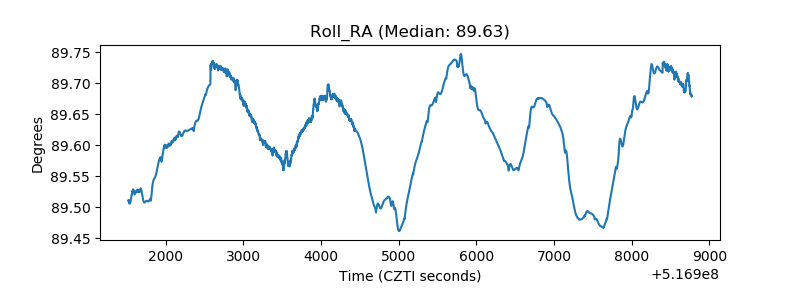 |
| Veto Counter | 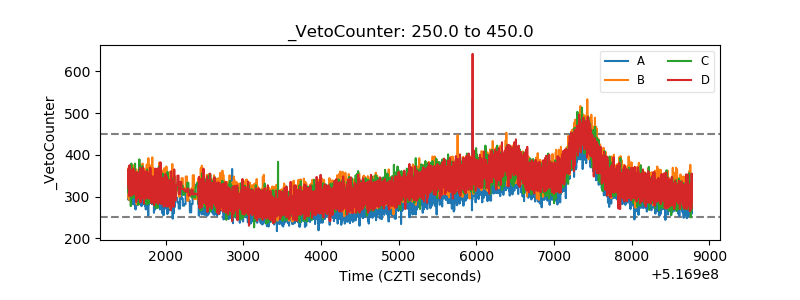 |