| Param | Original file | Final file |
|---|---|---|
| Filename | modeM0/AS1A14_070T08_9000006576_57576cztM0_level2.fits | modeM0/AS1A14_070T08_9000006576_57576cztM0_level2_quad_clean.evt |
| Size (bytes) | 1,191,435,840 | 221,135,040 |
| Size | 1.1 GB | 210.9 MB |
| Events in quadrant A | 6,704,935 | 1,502,952 |
| Events in quadrant B | 8,254,294 | 1,586,188 |
| Events in quadrant C | 15,072,312 | 1,244,265 |
| Events in quadrant D | 12,826,972 | 1,252,775 |
| Mode M0 | |||
|---|---|---|---|
| Quadrant | BADHDUFLAG | Total packets | Discarded packets |
| A | 0 | 32643 | 2 |
| B | 0 | 36257 | 2 |
| C | 0 | 55970 | 2 |
| D | 0 | 49365 | 2 |
| Mode M9 | |||
|---|---|---|---|
| Quadrant | BADHDUFLAG | Total packets | Discarded packets |
| A | 0 | 7 | 0 |
| B | 0 | 7 | 0 |
| C | 0 | 7 | 0 |
| D | 0 | 7 | 0 |
| Mode SS | |||
|---|---|---|---|
| Quadrant | BADHDUFLAG | Total packets | Discarded packets |
| A | 0 | 326 | 0 |
| B | 0 | 326 | 0 |
| C | 0 | 326 | 0 |
| D | 0 | 326 | 0 |
| Quadrant | Total seconds | Saturated seconds | Saturation percentage |
|---|---|---|---|
| A | 16078 | 131 | 0.814778% |
| B | 16079 | 322 | 2.002612% |
| C | 16079 | 2303 | 14.323030% |
| D | 16079 | 1355 | 8.427141% |
Noise dominated data is calculated using 1-second bins in cleaned event files. If a bin has >2000 counts, and if more than 50% of those come from <1% of pixels, then it is considered to be noise-dominated and hence unusable.
| Quadrant | # 1 sec bins | Bins with >0 counts | Bins with >2000 counts | High rate bins dominated by noise | Noise dominated (total time) | Noise dominated (detector-on time) | Marked lightcurve |
|---|---|---|---|---|---|---|---|
| A | 16648 | 16081 | 2 | 2 | 0.01% | 0.01% | 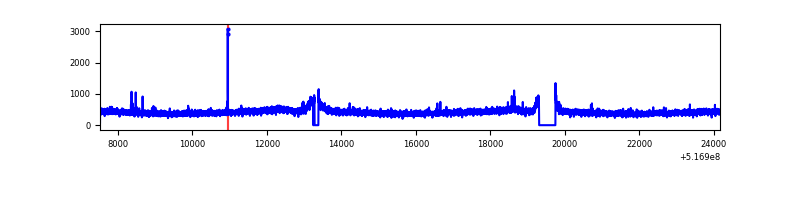 |
| B | 16649 | 16082 | 81 | 81 | 0.49% | 0.50% | 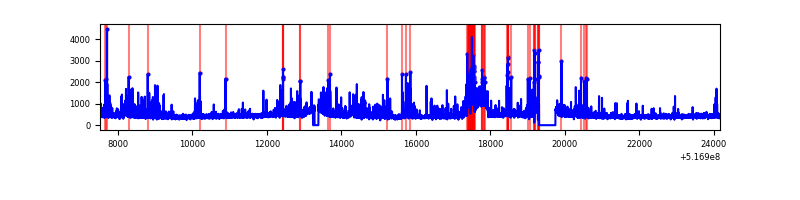 |
| C | 16649 | 16081 | 1587 | 1587 | 9.53% | 9.87% | 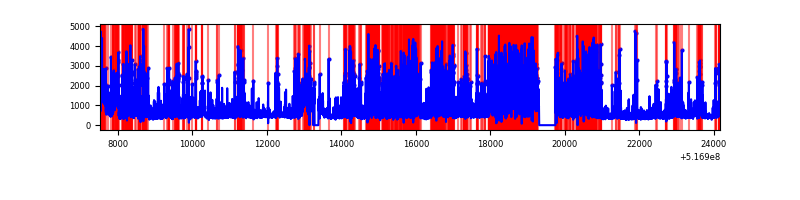 |
| D | 16649 | 16081 | 1043 | 1043 | 6.26% | 6.49% | 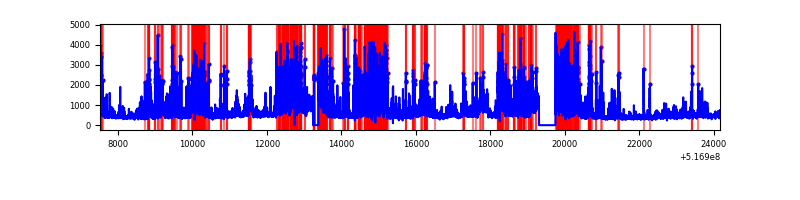 |
Top three noisy pixels from each quadrant. If the there are fewer than three noisy pixels in the level2.evt file, extra rows are filled as -1
| Pixel properties | Quadrant properties | ||||||
|---|---|---|---|---|---|---|---|
| Quadrant | DetID | PixID | Counts | Sigma | Mean | Median | Sigma |
| A | 3 | 128 | 28895 | 65.03 | 1712 | 1666 | 418.7 |
| A | 10 | 251 | 24347 | 54.17 | 1712 | 1666 | 418.7 |
| A | 3 | 137 | 21323 | 46.94 | 1712 | 1666 | 418.7 |
| B | 5 | 185 | 667095 | 1872.5 | 1680 | 1615 | 355.4 |
| B | 2 | 249 | 250262 | 699.63 | 1680 | 1615 | 355.4 |
| B | 10 | 247 | 151407 | 421.48 | 1680 | 1615 | 355.4 |
| C | 14 | 245 | 3316254 | 7923.8 | 1549 | 1532 | 418.3 |
| C | 12 | 254 | 3111887 | 7435.27 | 1549 | 1532 | 418.3 |
| C | 15 | 224 | 1711462 | 4087.57 | 1549 | 1532 | 418.3 |
| D | 2 | 249 | 3520604 | 7842.5 | 1596 | 1522 | 448.7 |
| D | 15 | 142 | 1188944 | 2646.25 | 1596 | 1522 | 448.7 |
| D | 3 | 12 | 454291 | 1009.02 | 1596 | 1522 | 448.7 |
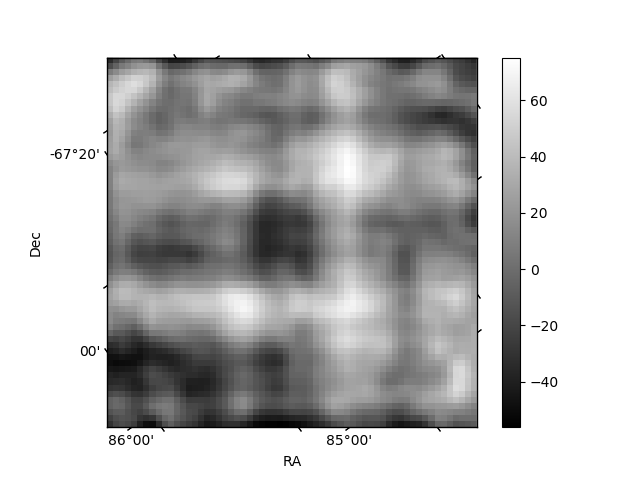
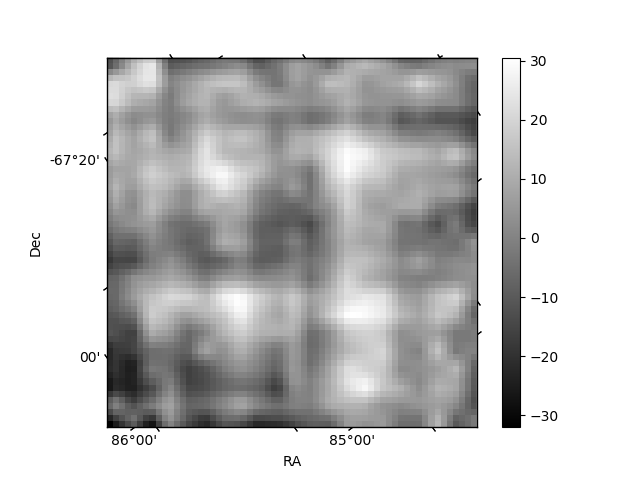
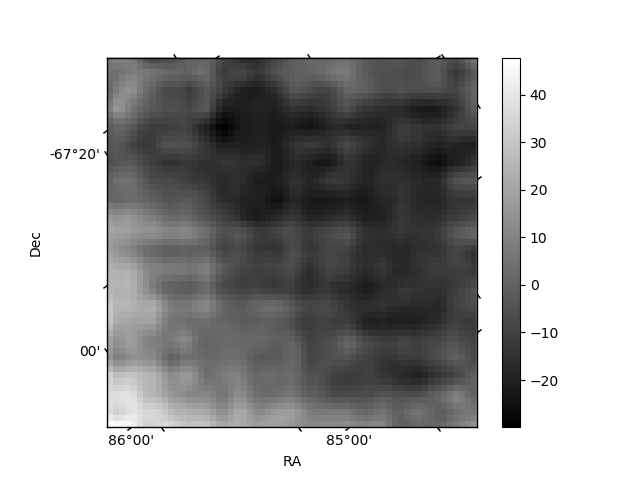
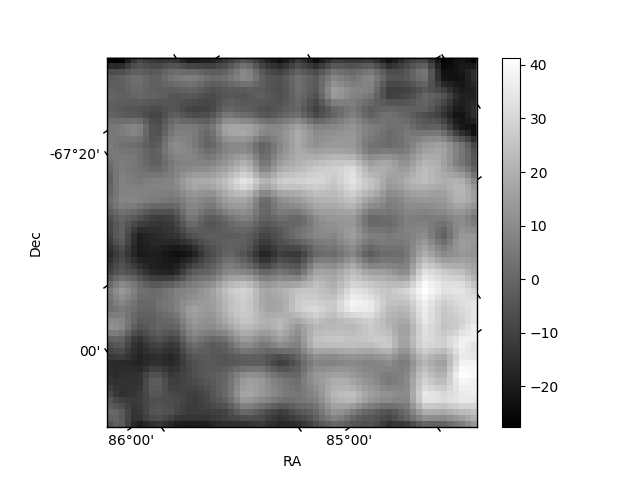
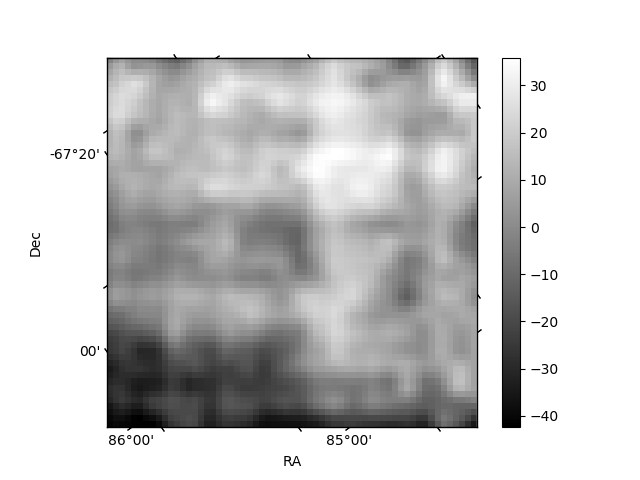
Histogram calculated using DETX and DETY for each event in the final _common_clean file
| Quadrant A | 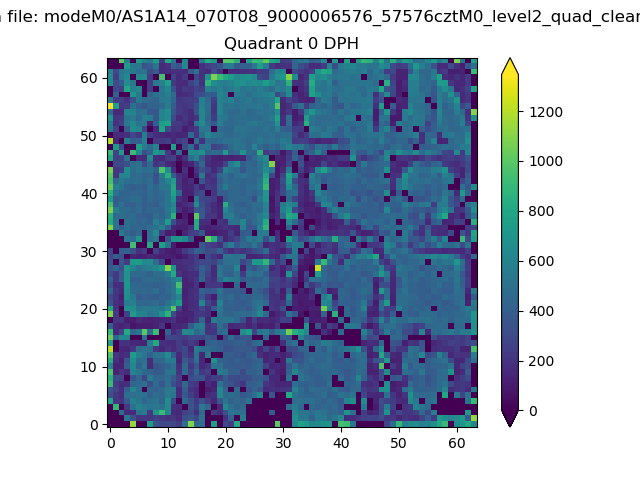 |
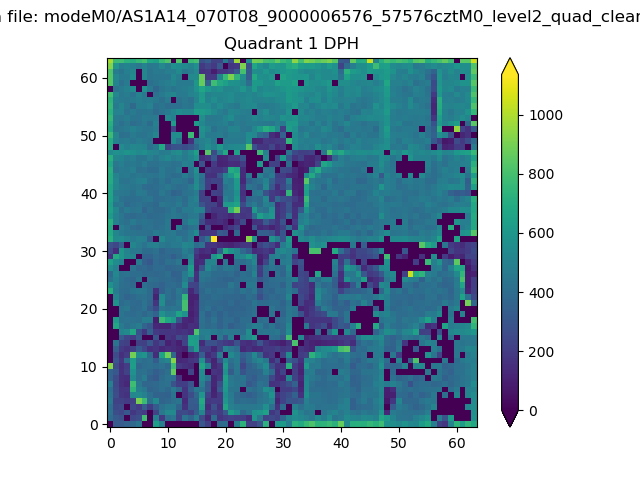 |
Quadrant B |
|---|---|---|---|
| Quadrant D | 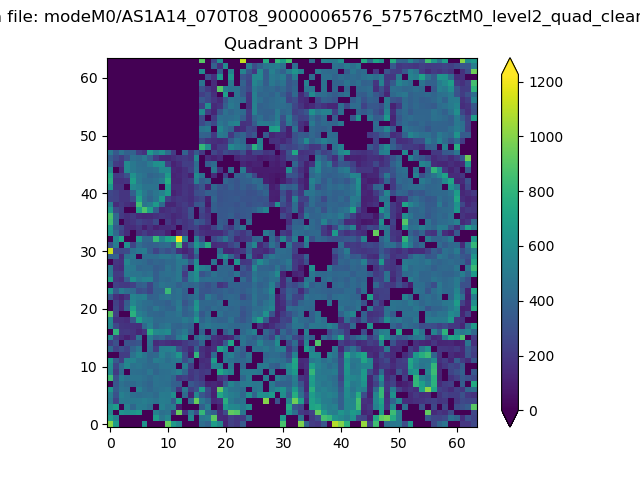 |
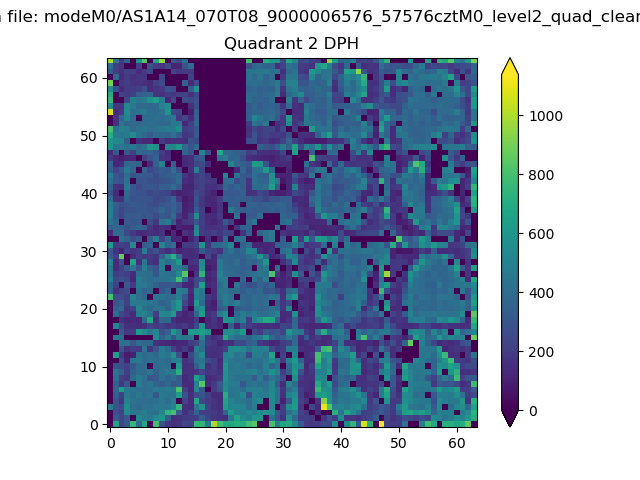 |
Quadrant C |
| Plot type | Count rate plots | Images |
|---|---|---|
| Comparison with Poisson distribution Blue bars denote a histogram of data divided into 1 sec bins. Red curve is a Poisson curve with rate = median count rate of data. |
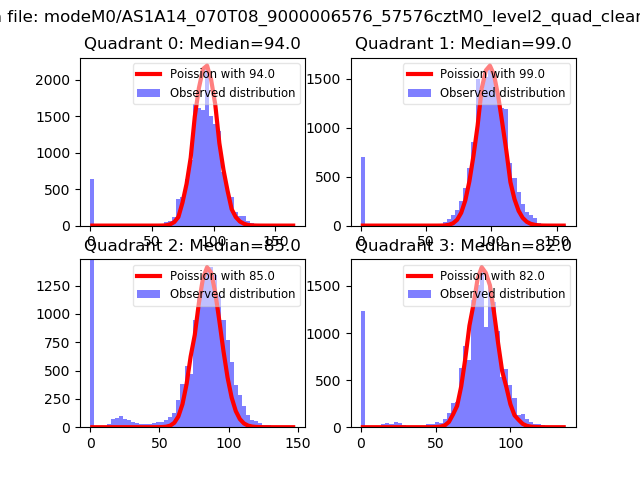 |
 |
| Quadrant-wise count rates Data is divided into 100 sec bins |
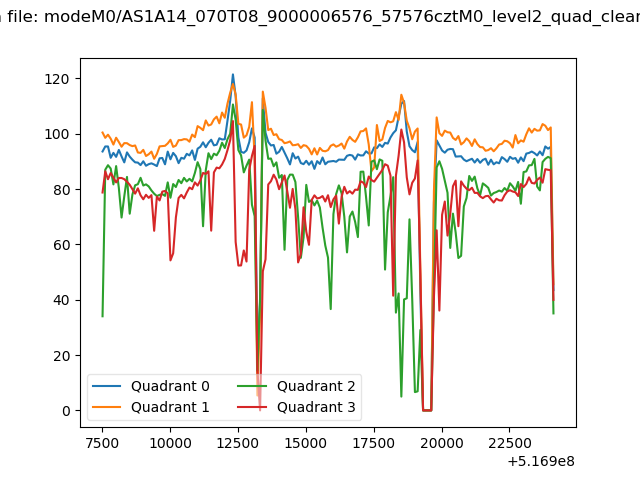 |
|
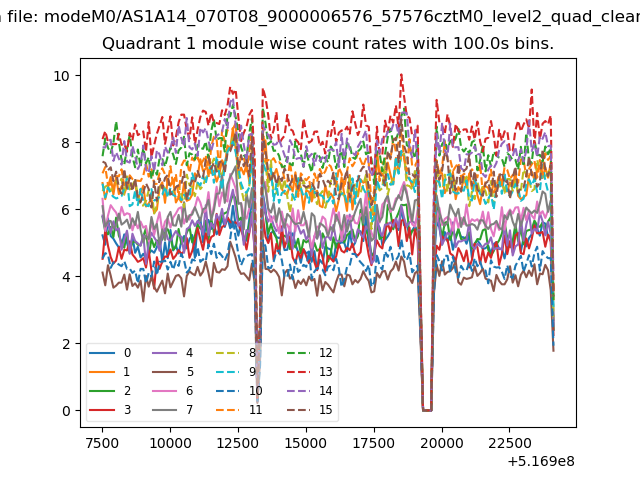
| Module-wise count rates for Quadrant A Data is divided into 100 sec bins |
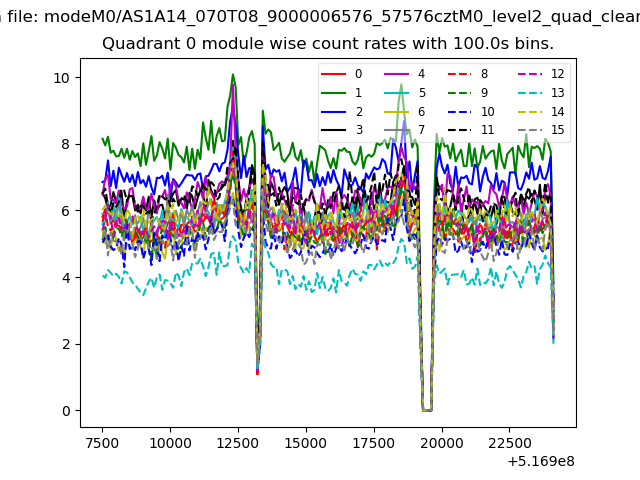 |
 |
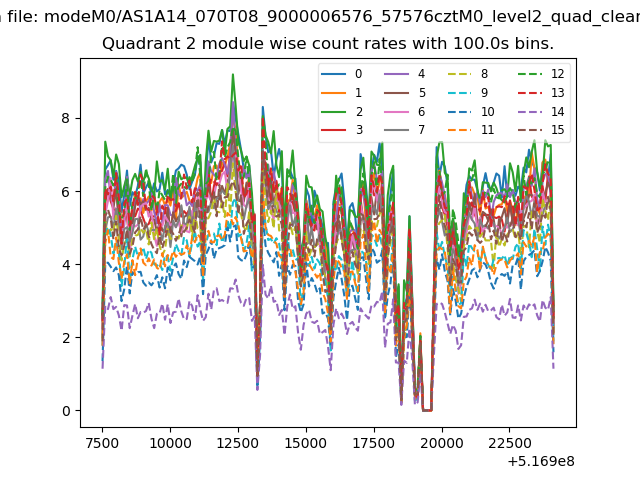
| Module-wise count rates for Quadrant B Data is divided into 100 sec bins |
 |
 |
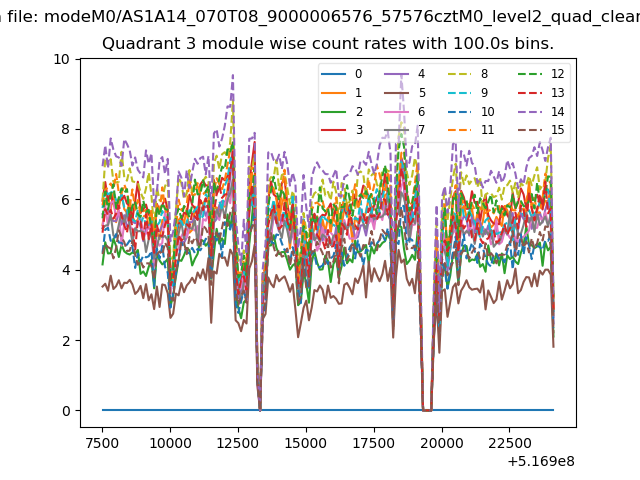
| Module-wise count rates for Quadrant C Data is divided into 100 sec bins |
 |
 |
| Module-wise count rates for Quadrant D Data is divided into 100 sec bins |
 |
 |
| Parameter | Plot |
|---|---|
| CZT HV Monitor | 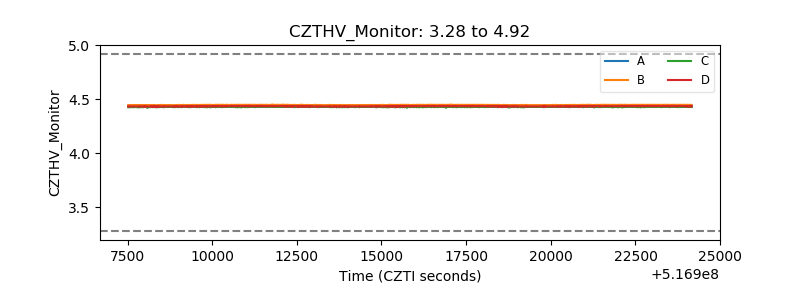 |
| D_VDD | 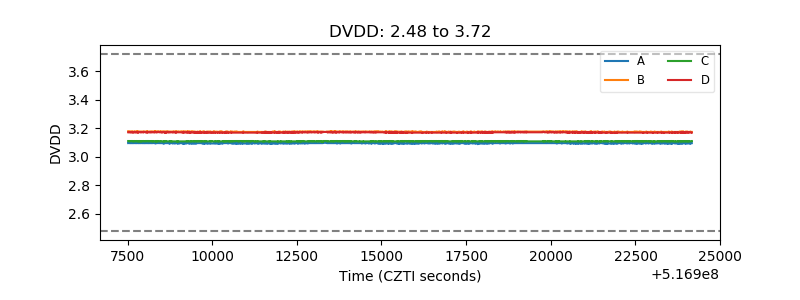 |
| Temperature 1 | 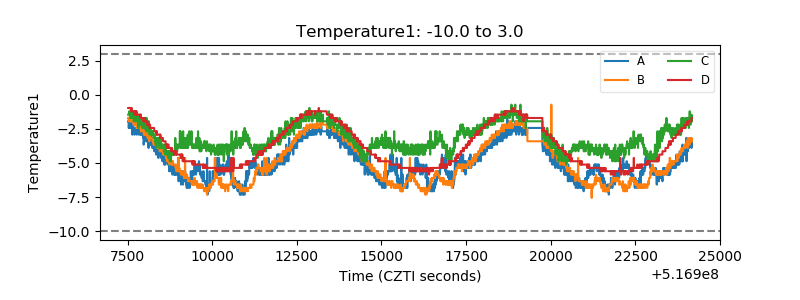 |
| Veto HV Monitor | 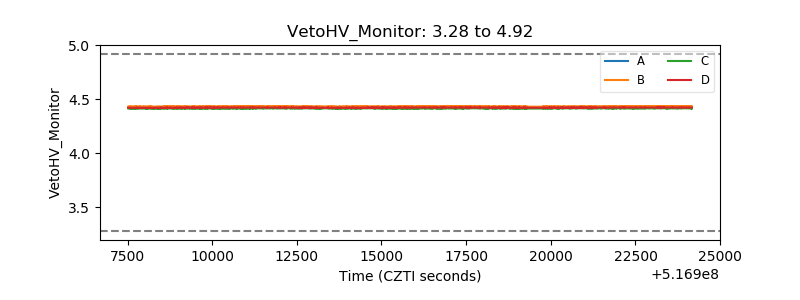 |
| Veto LLD | 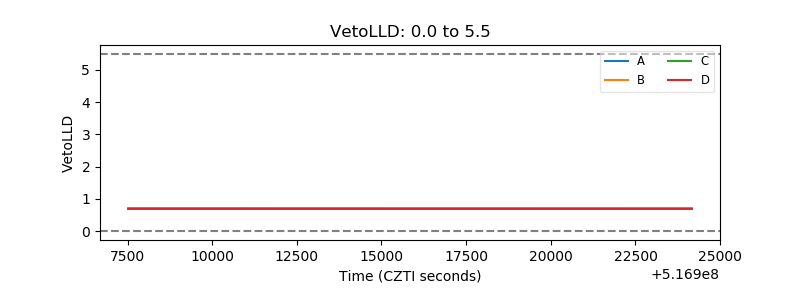 |
| Alpha Counter | 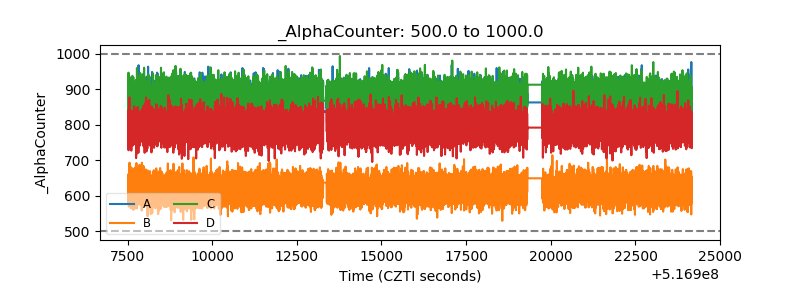 |
| _CPM_Rate | 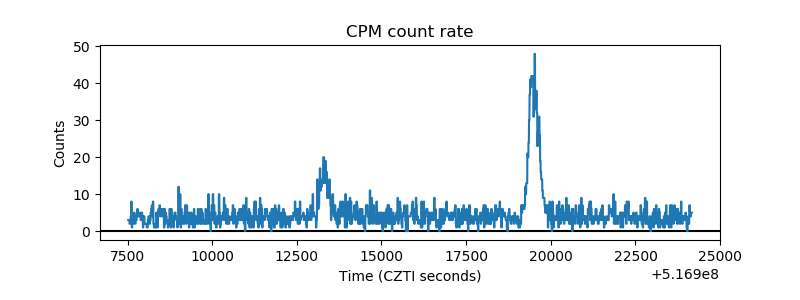 |
| CZT Counter | 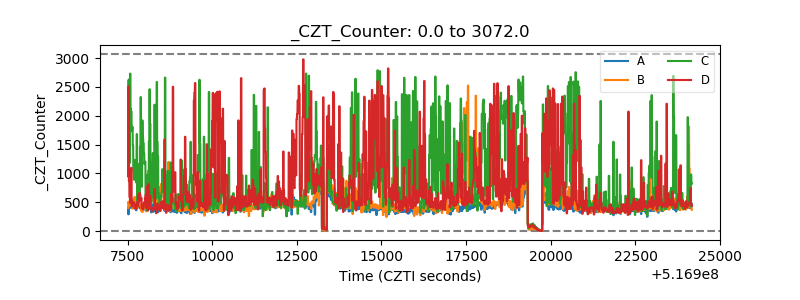 |
| +2.5 Volts monitor |  |
| +5 Volts monitor | 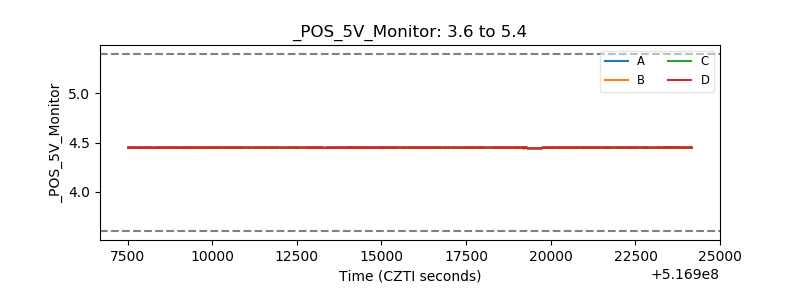 |
| _ROLL_ROT | 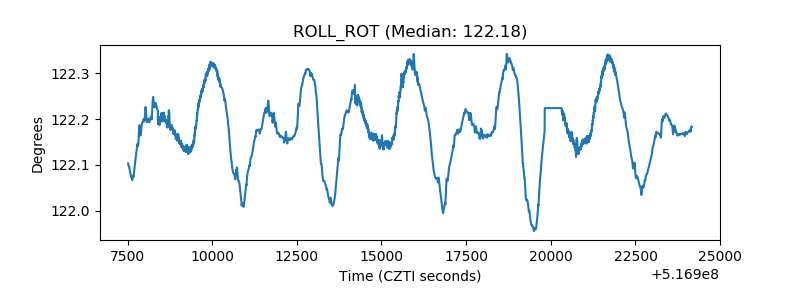 |
| _Roll_DEC | 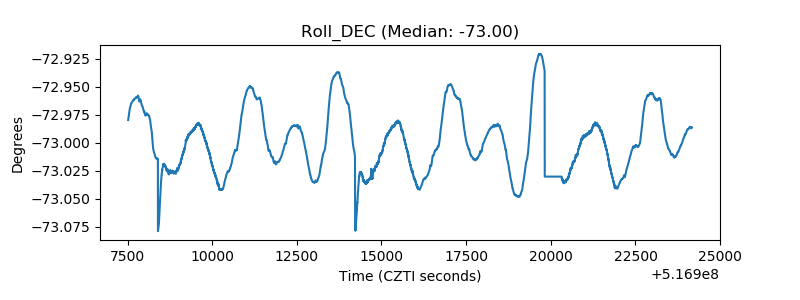 |
| _Roll_RA | 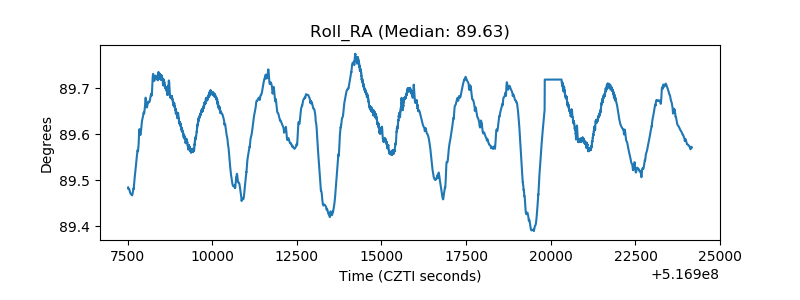 |
| Veto Counter | 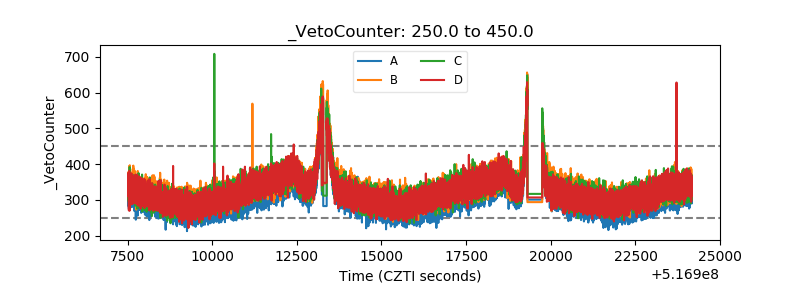 |