| Param | Original file | Final file |
|---|---|---|
| Filename | modeM0/AS1A14_070T08_9000006576_57578cztM0_level2.fits | modeM0/AS1A14_070T08_9000006576_57578cztM0_level2_quad_clean.evt |
| Size (bytes) | 513,097,920 | 107,282,880 |
| Size | 489.3 MB | 102.3 MB |
| Events in quadrant A | 3,217,330 | 724,753 |
| Events in quadrant B | 4,172,934 | 744,000 |
| Events in quadrant C | 5,386,050 | 647,525 |
| Events in quadrant D | 5,633,837 | 609,941 |
| Mode M0 | |||
|---|---|---|---|
| Quadrant | BADHDUFLAG | Total packets | Discarded packets |
| A | 0 | 15286 | 2 |
| B | 0 | 17757 | 2 |
| C | 0 | 21208 | 3 |
| D | 0 | 21910 | 2 |
| Mode M9 | |||
|---|---|---|---|
| Quadrant | BADHDUFLAG | Total packets | Discarded packets |
| A | 0 | 17 | 0 |
| B | 0 | 17 | 0 |
| C | 0 | 17 | 0 |
| D | 0 | 17 | 0 |
| Mode SS | |||
|---|---|---|---|
| Quadrant | BADHDUFLAG | Total packets | Discarded packets |
| A | 0 | 156 | 0 |
| B | 0 | 156 | 0 |
| C | 0 | 156 | 0 |
| D | 0 | 156 | 0 |
| Quadrant | Total seconds | Saturated seconds | Saturation percentage |
|---|---|---|---|
| A | 7499 | 71 | 0.946793% |
| B | 7500 | 420 | 5.600000% |
| C | 7499 | 562 | 7.494333% |
| D | 7499 | 567 | 7.561008% |
Noise dominated data is calculated using 1-second bins in cleaned event files. If a bin has >2000 counts, and if more than 50% of those come from <1% of pixels, then it is considered to be noise-dominated and hence unusable.
| Quadrant | # 1 sec bins | Bins with >0 counts | Bins with >2000 counts | High rate bins dominated by noise | Noise dominated (total time) | Noise dominated (detector-on time) | Marked lightcurve |
|---|---|---|---|---|---|---|---|
| A | 9269 | 7501 | 1 | 1 | 0.01% | 0.01% | 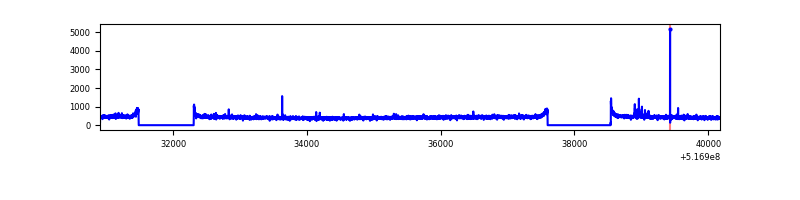 |
| B | 9270 | 7502 | 251 | 251 | 2.71% | 3.35% | 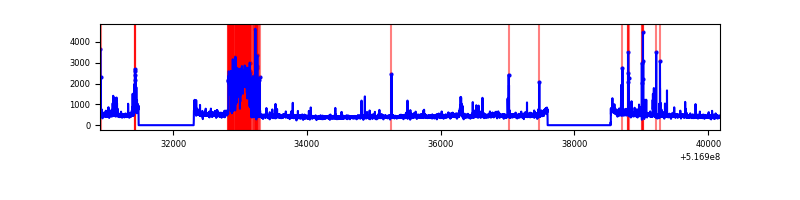 |
| C | 9269 | 7500 | 385 | 385 | 4.15% | 5.13% | 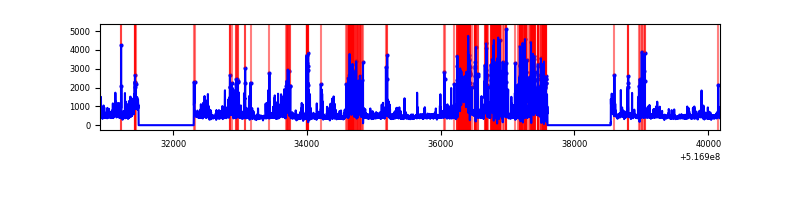 |
| D | 9269 | 7501 | 482 | 482 | 5.20% | 6.43% | 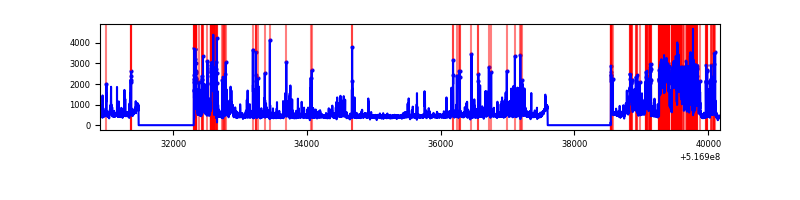 |
Top three noisy pixels from each quadrant. If the there are fewer than three noisy pixels in the level2.evt file, extra rows are filled as -1
| Pixel properties | Quadrant properties | ||||||
|---|---|---|---|---|---|---|---|
| Quadrant | DetID | PixID | Counts | Sigma | Mean | Median | Sigma |
| A | 3 | 245 | 24614 | 117.14 | 819 | 796 | 203.3 |
| A | 3 | 14 | 15297 | 71.32 | 819 | 796 | 203.3 |
| A | 4 | 3 | 10384 | 47.15 | 819 | 796 | 203.3 |
| B | 2 | 249 | 757543 | 4477.63 | 797 | 767 | 169.0 |
| B | 10 | 247 | 69881 | 408.93 | 797 | 767 | 169.0 |
| B | 0 | 63 | 61627 | 360.09 | 797 | 767 | 169.0 |
| C | 12 | 254 | 1107481 | 5299.89 | 764 | 757 | 208.8 |
| C | 15 | 224 | 857069 | 4100.71 | 764 | 757 | 208.8 |
| C | 14 | 245 | 232280 | 1108.72 | 764 | 757 | 208.8 |
| D | 15 | 142 | 1635220 | 7466.99 | 773 | 736 | 218.9 |
| D | 3 | 224 | 222413 | 1012.71 | 773 | 736 | 218.9 |
| D | 8 | 160 | 182118 | 828.63 | 773 | 736 | 218.9 |
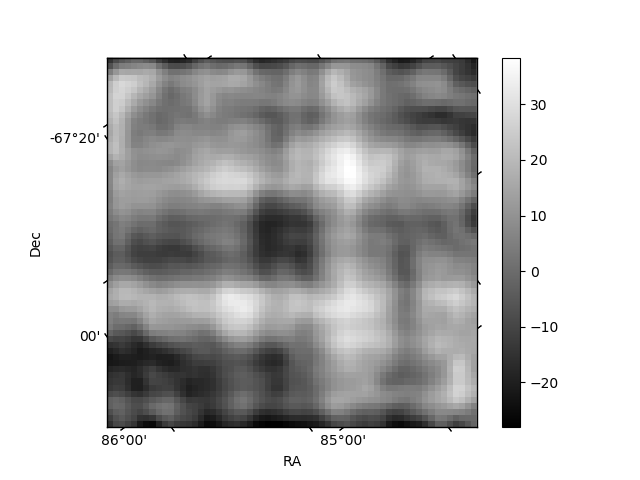
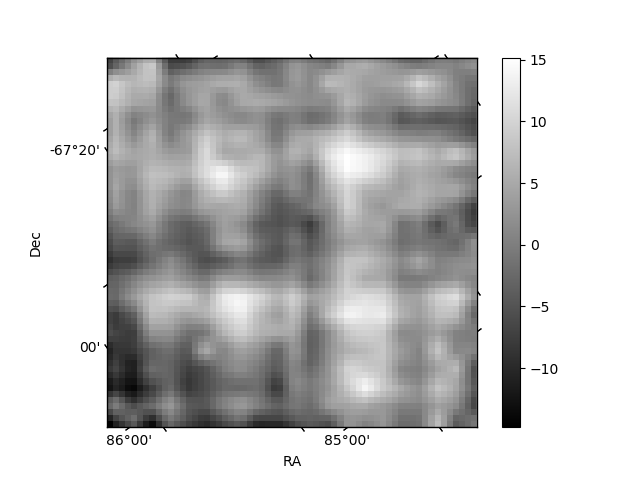
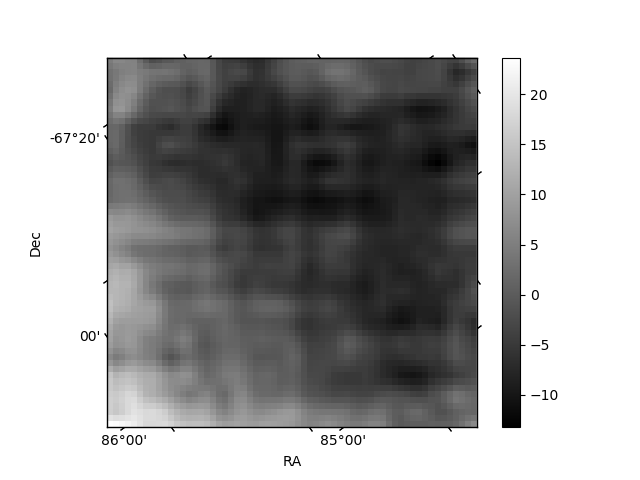
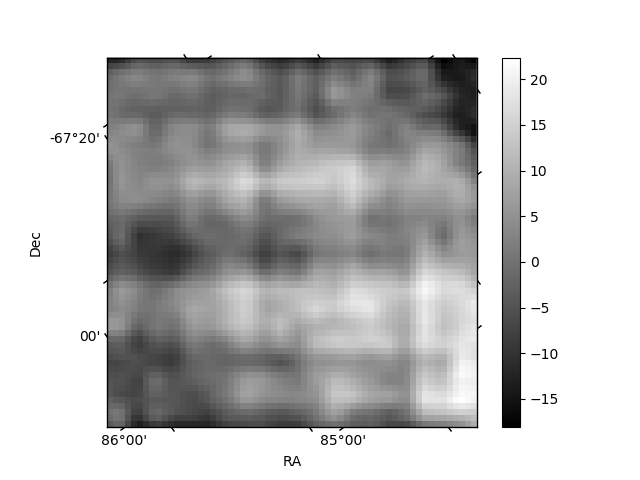
Histogram calculated using DETX and DETY for each event in the final _common_clean file
| Quadrant A | 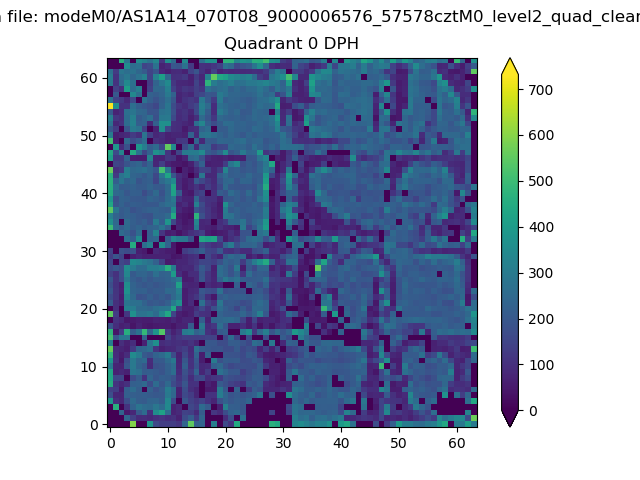 |
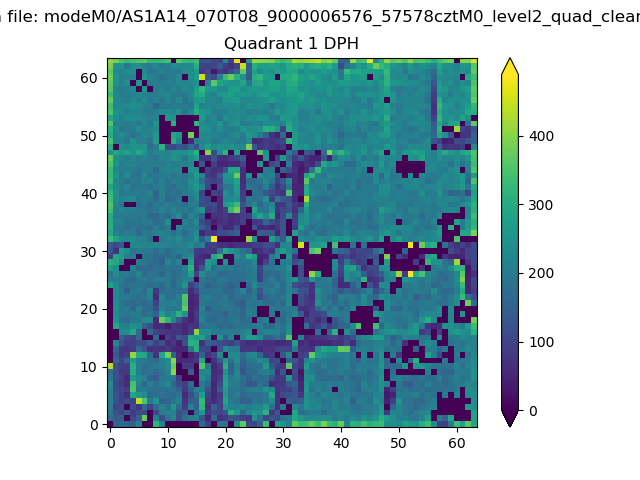 |
Quadrant B |
|---|---|---|---|
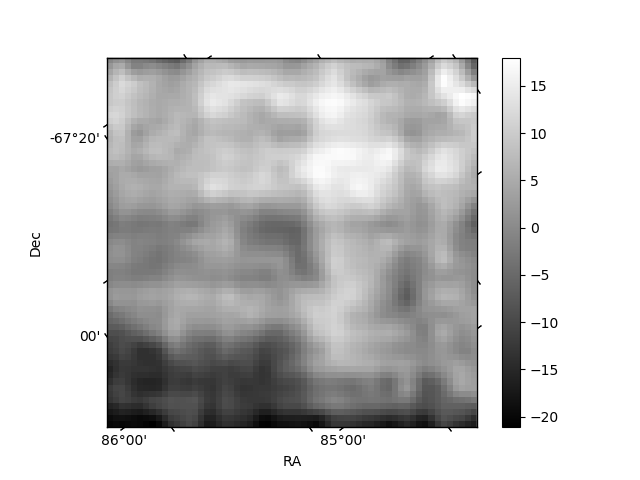
| Quadrant D | 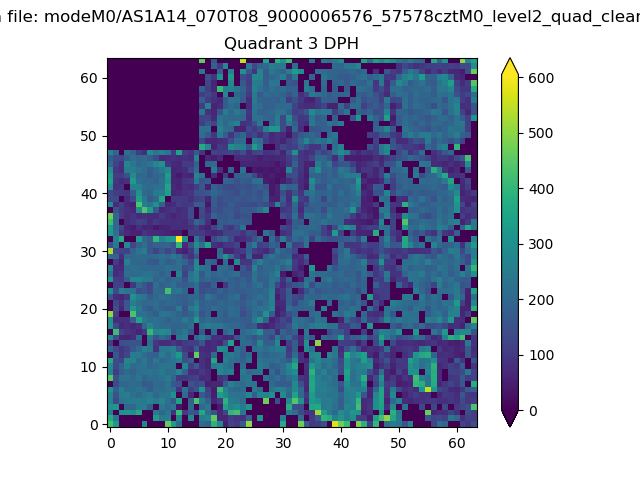 |
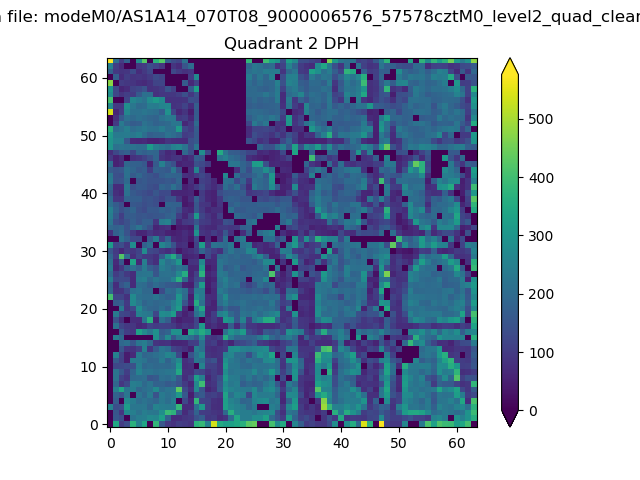 |
Quadrant C |
| Plot type | Count rate plots | Images |
|---|---|---|
| Comparison with Poisson distribution Blue bars denote a histogram of data divided into 1 sec bins. Red curve is a Poisson curve with rate = median count rate of data. |
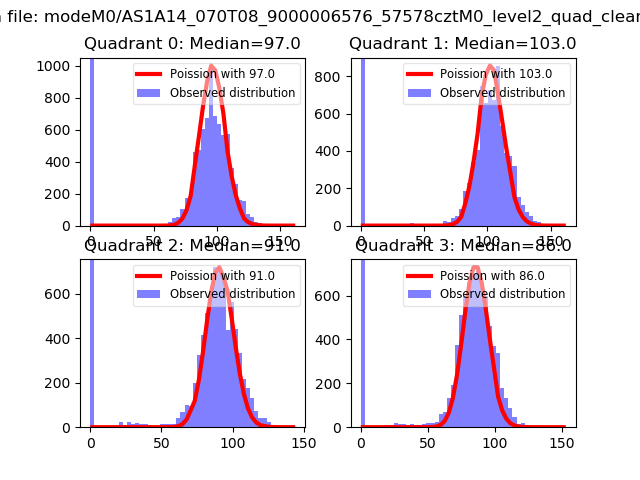 |
 |
| Quadrant-wise count rates Data is divided into 100 sec bins |
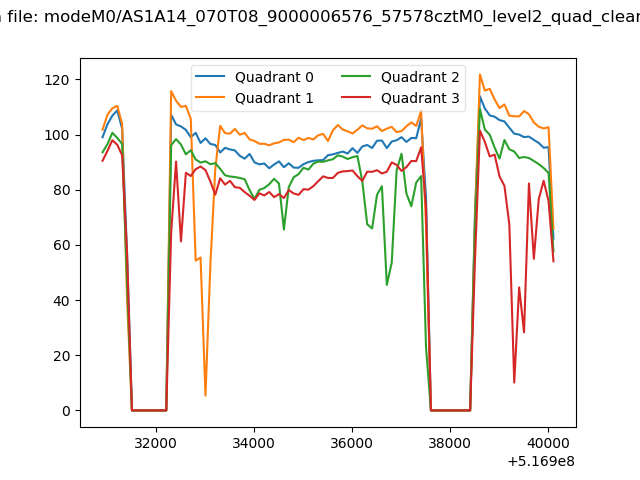 |
|
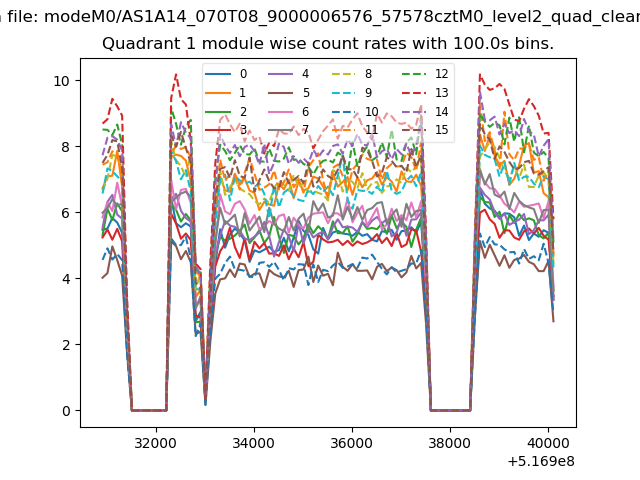
| Module-wise count rates for Quadrant A Data is divided into 100 sec bins |
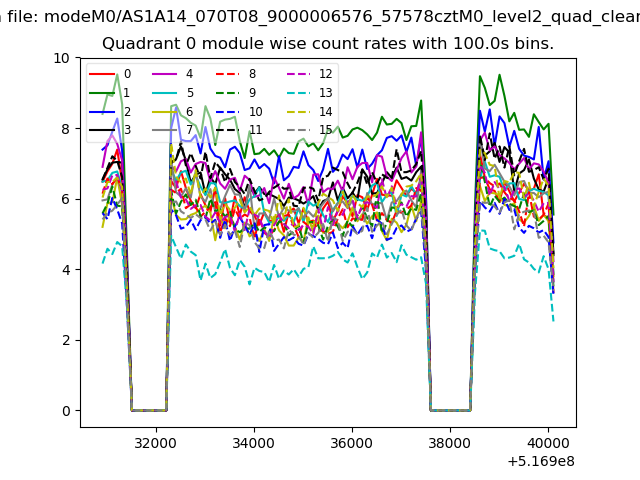 |
 |
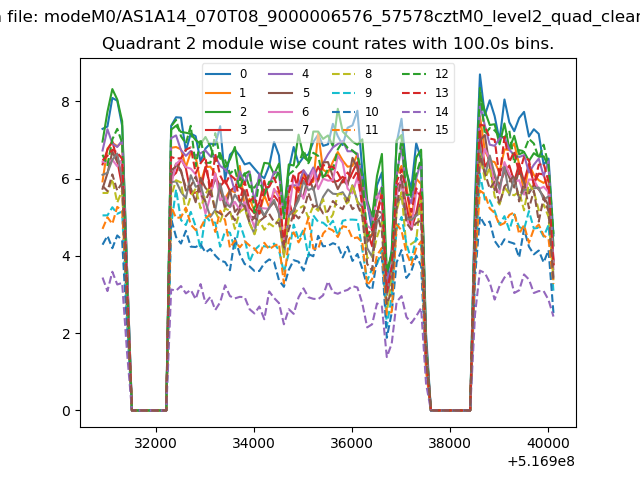
| Module-wise count rates for Quadrant B Data is divided into 100 sec bins |
 |
 |
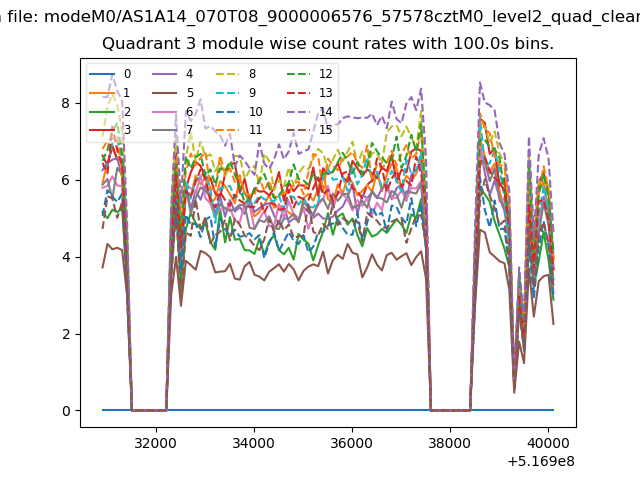
| Module-wise count rates for Quadrant C Data is divided into 100 sec bins |
 |
 |
| Module-wise count rates for Quadrant D Data is divided into 100 sec bins |
 |
 |
| Parameter | Plot |
|---|---|
| CZT HV Monitor | 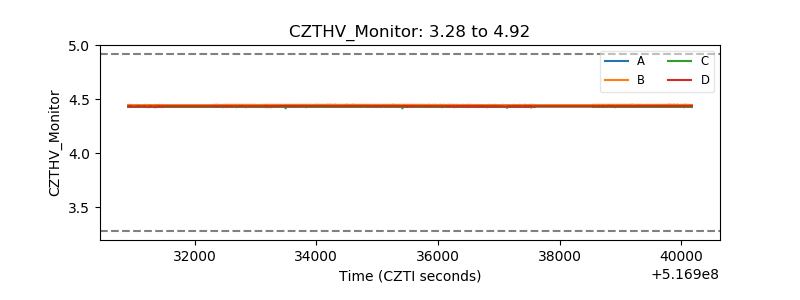 |
| D_VDD | 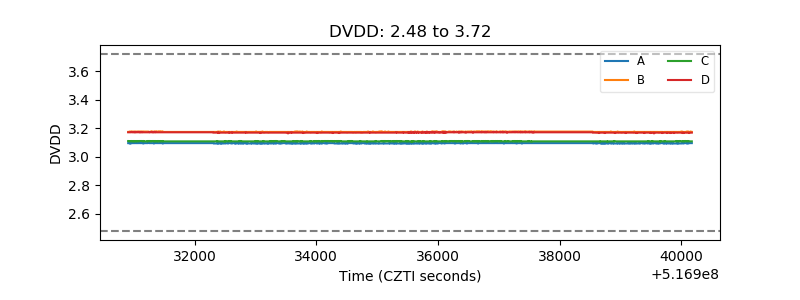 |
| Temperature 1 | 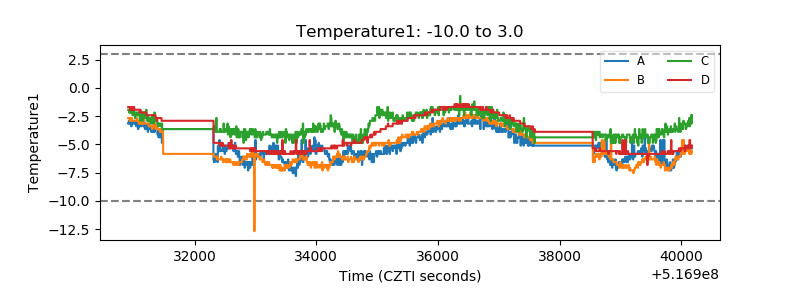 |
| Veto HV Monitor |  |
| Veto LLD | 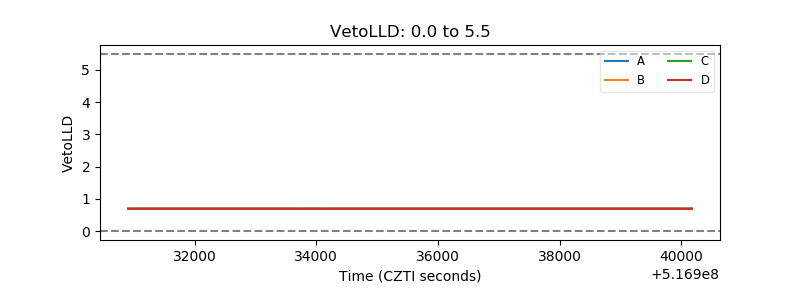 |
| Alpha Counter | 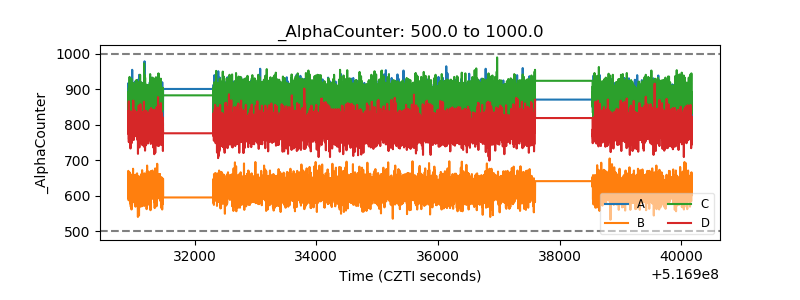 |
| _CPM_Rate | 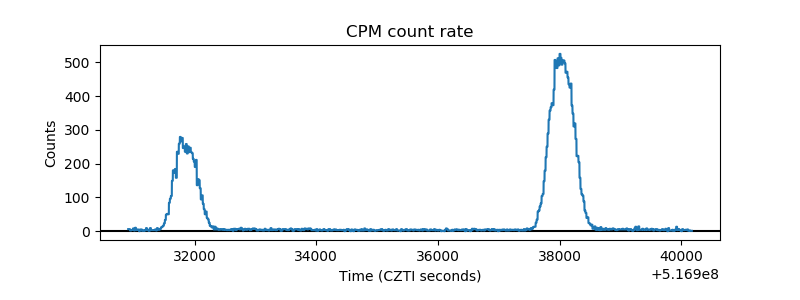 |
| CZT Counter | 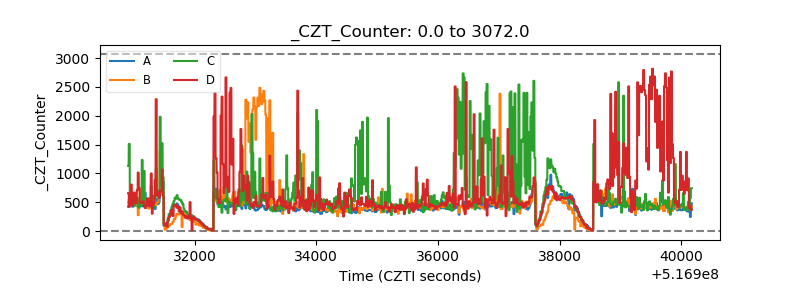 |
| +2.5 Volts monitor | 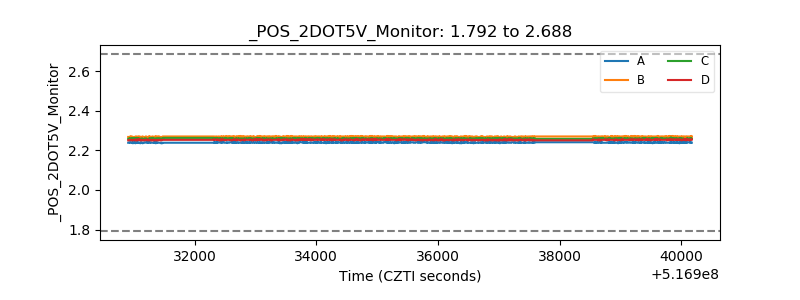 |
| +5 Volts monitor | 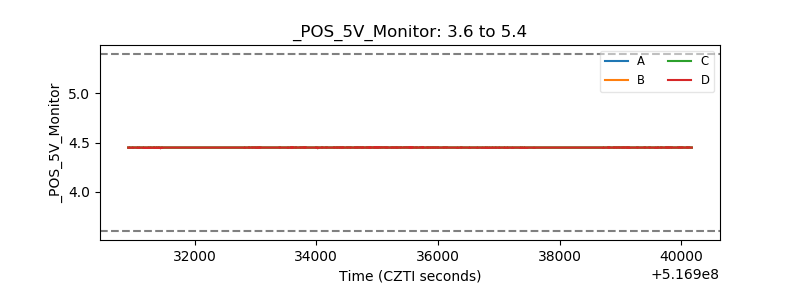 |
| _ROLL_ROT | 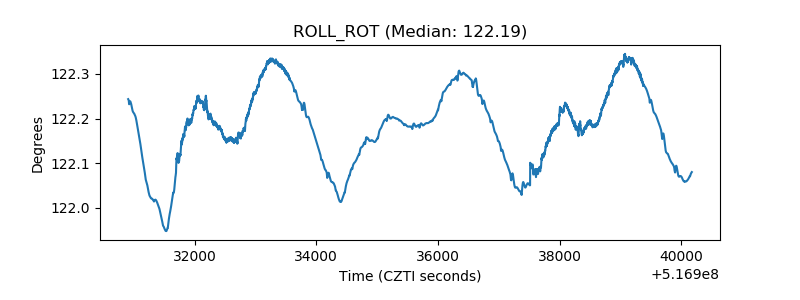 |
| _Roll_DEC | 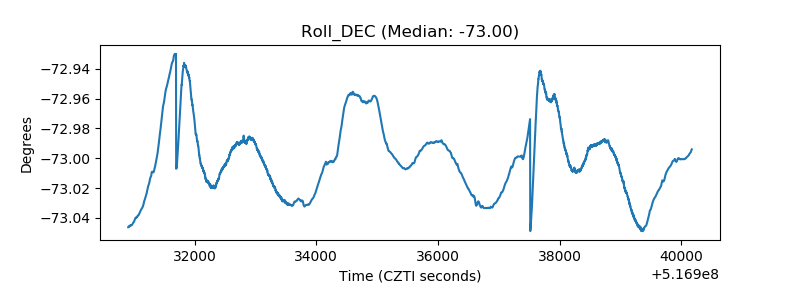 |
| _Roll_RA | 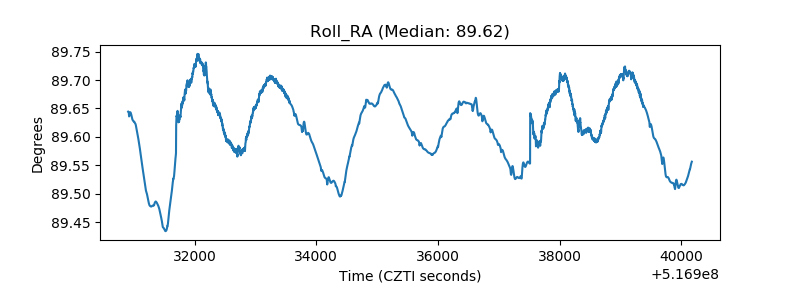 |
| Veto Counter | 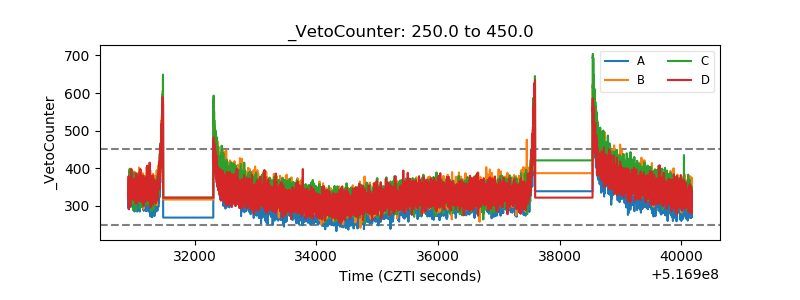 |