| Param | Original file | Final file |
|---|---|---|
| Filename | modeM0/AS1A14_070T08_9000006576_57580cztM0_level2.fits | modeM0/AS1A14_070T08_9000006576_57580cztM0_level2_quad_clean.evt |
| Size (bytes) | 447,333,120 | 82,486,080 |
| Size | 426.6 MB | 78.7 MB |
| Events in quadrant A | 2,537,357 | 576,363 |
| Events in quadrant B | 2,812,489 | 611,680 |
| Events in quadrant C | 5,943,479 | 431,848 |
| Events in quadrant D | 4,808,539 | 468,060 |
| Mode M0 | |||
|---|---|---|---|
| Quadrant | BADHDUFLAG | Total packets | Discarded packets |
| A | 0 | 11966 | 1 |
| B | 0 | 12650 | 1 |
| C | 0 | 21745 | 1 |
| D | 0 | 18315 | 1 |
| Mode M9 | |||
|---|---|---|---|
| Quadrant | BADHDUFLAG | Total packets | Discarded packets |
| A | 0 | 11 | 0 |
| B | 0 | 11 | 0 |
| C | 0 | 11 | 0 |
| D | 0 | 11 | 0 |
| Mode SS | |||
|---|---|---|---|
| Quadrant | BADHDUFLAG | Total packets | Discarded packets |
| A | 0 | 118 | 0 |
| B | 0 | 118 | 0 |
| C | 0 | 118 | 0 |
| D | 0 | 118 | 0 |
| Quadrant | Total seconds | Saturated seconds | Saturation percentage |
|---|---|---|---|
| A | 5864 | 42 | 0.716235% |
| B | 5864 | 132 | 2.251023% |
| C | 5865 | 1374 | 23.427110% |
| D | 5865 | 649 | 11.065644% |
Noise dominated data is calculated using 1-second bins in cleaned event files. If a bin has >2000 counts, and if more than 50% of those come from <1% of pixels, then it is considered to be noise-dominated and hence unusable.
| Quadrant | # 1 sec bins | Bins with >0 counts | Bins with >2000 counts | High rate bins dominated by noise | Noise dominated (total time) | Noise dominated (detector-on time) | Marked lightcurve |
|---|---|---|---|---|---|---|---|
| A | 6929 | 5865 | 1 | 1 | 0.01% | 0.02% | 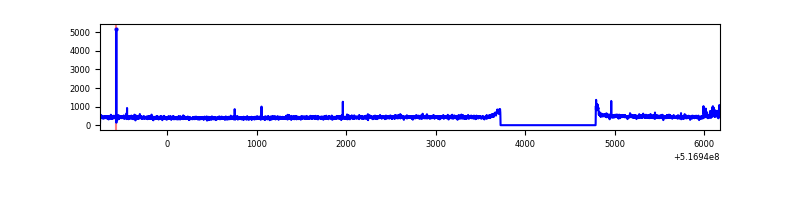 |
| B | 6930 | 5866 | 71 | 71 | 1.02% | 1.21% | 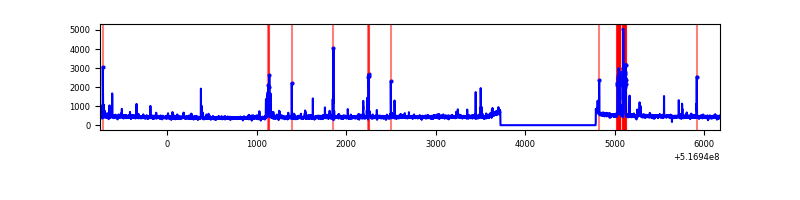 |
| C | 6930 | 5865 | 852 | 852 | 12.29% | 14.53% | 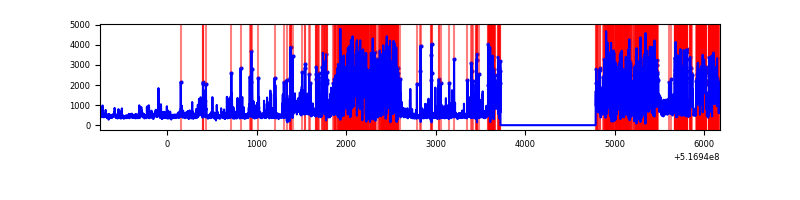 |
| D | 6930 | 5866 | 591 | 591 | 8.53% | 10.08% | 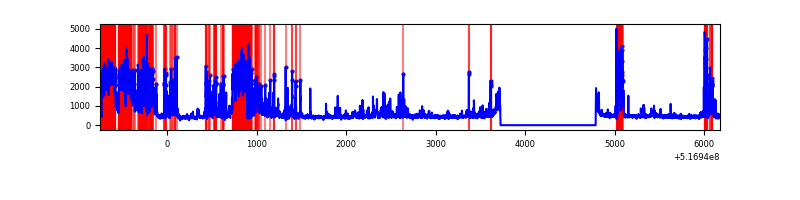 |
Top three noisy pixels from each quadrant. If the there are fewer than three noisy pixels in the level2.evt file, extra rows are filled as -1
| Pixel properties | Quadrant properties | ||||||
|---|---|---|---|---|---|---|---|
| Quadrant | DetID | PixID | Counts | Sigma | Mean | Median | Sigma |
| A | 3 | 250 | 34715 | 215.38 | 636 | 619 | 158.3 |
| A | 3 | 128 | 11384 | 68.0 | 636 | 619 | 158.3 |
| A | 3 | 14 | 10814 | 64.4 | 636 | 619 | 158.3 |
| B | 2 | 249 | 169626 | 1278.61 | 623 | 600 | 132.2 |
| B | 0 | 171 | 54390 | 406.9 | 623 | 600 | 132.2 |
| B | 10 | 247 | 24299 | 179.27 | 623 | 600 | 132.2 |
| C | 12 | 254 | 3046305 | 20599.36 | 542 | 536 | 147.9 |
| C | 15 | 224 | 577038 | 3899.04 | 542 | 536 | 147.9 |
| C | 12 | 252 | 61034 | 409.16 | 542 | 536 | 147.9 |
| D | 15 | 142 | 1938141 | 11548.23 | 597 | 570 | 167.8 |
| D | 11 | 247 | 109283 | 647.95 | 597 | 570 | 167.8 |
| D | 2 | 249 | 66354 | 392.08 | 597 | 570 | 167.8 |
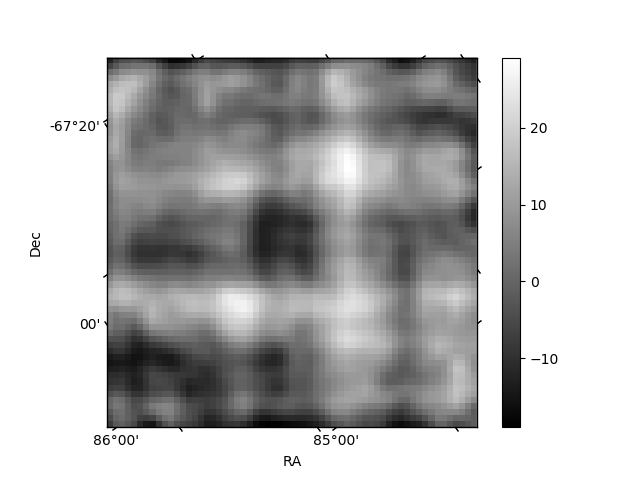
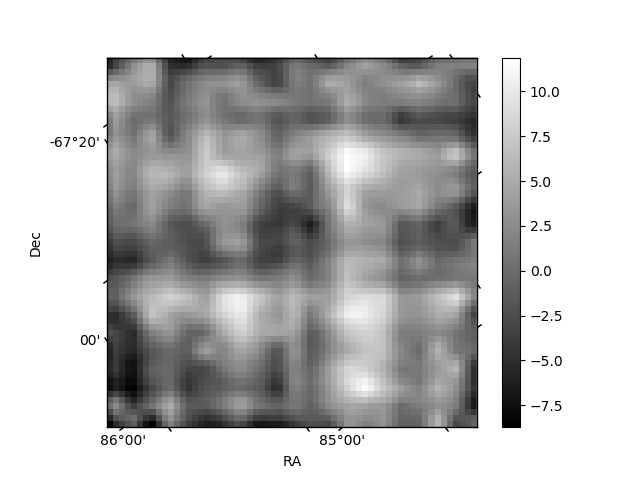
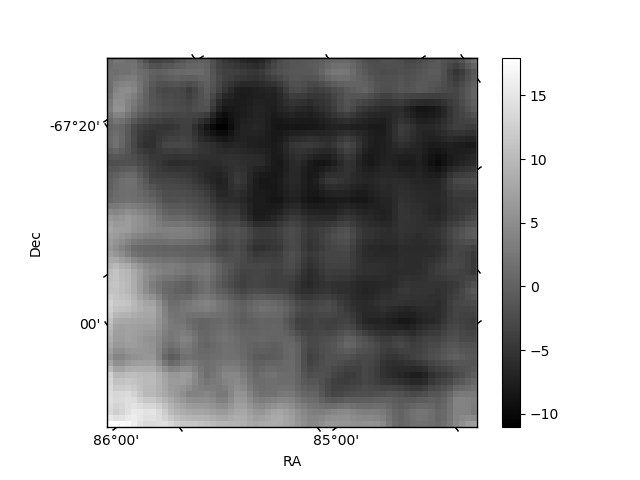
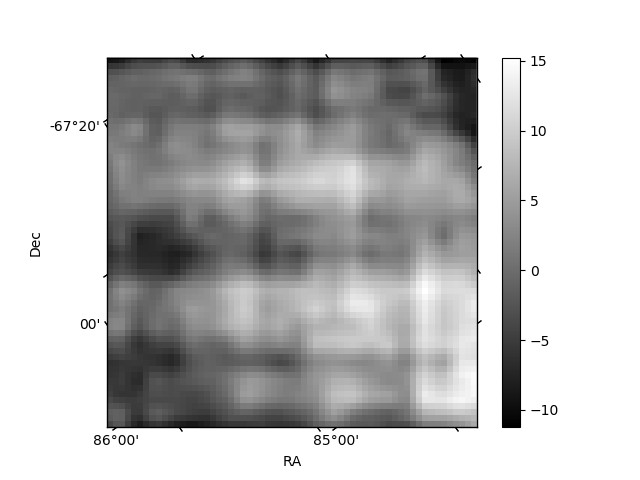
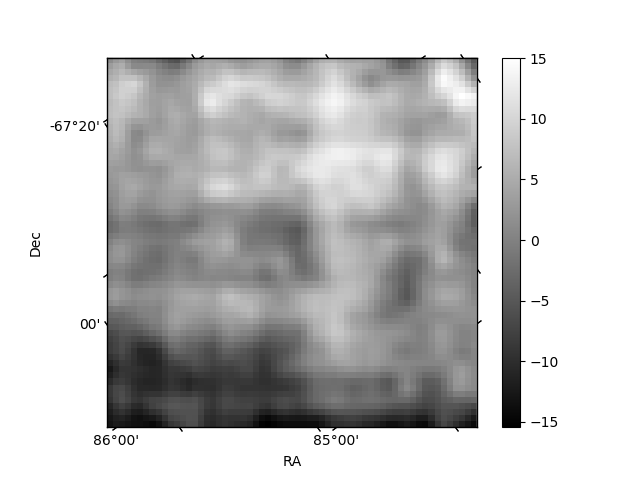
Histogram calculated using DETX and DETY for each event in the final _common_clean file
| Quadrant A | 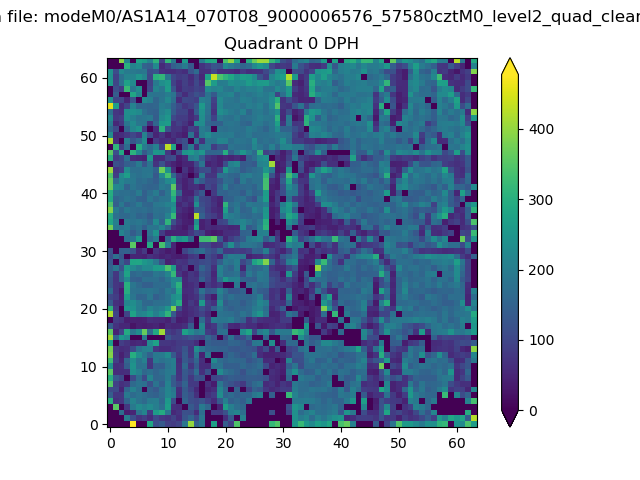 |
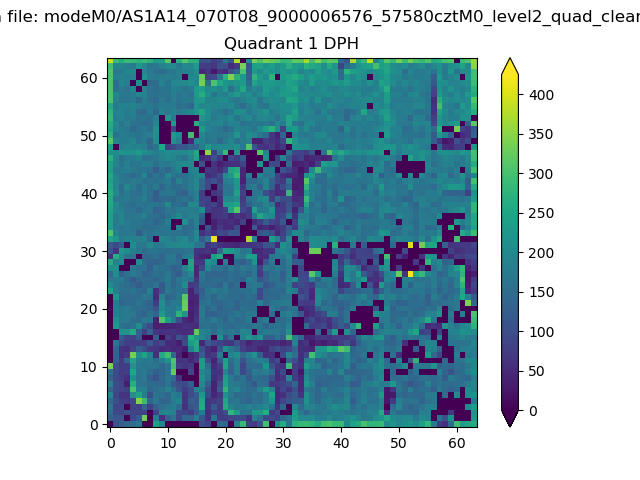 |
Quadrant B |
|---|---|---|---|
| Quadrant D | 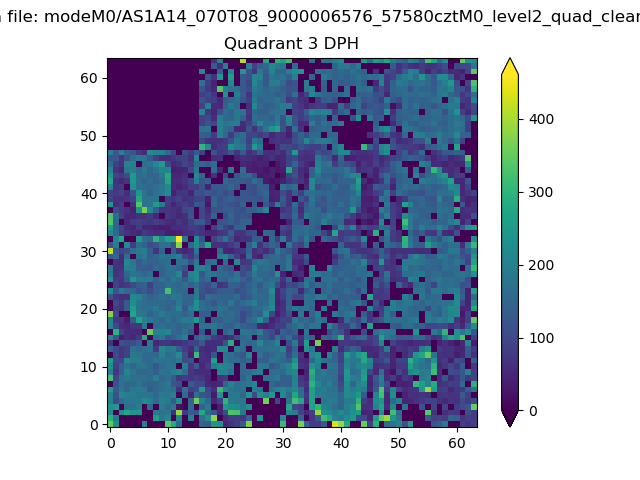 |
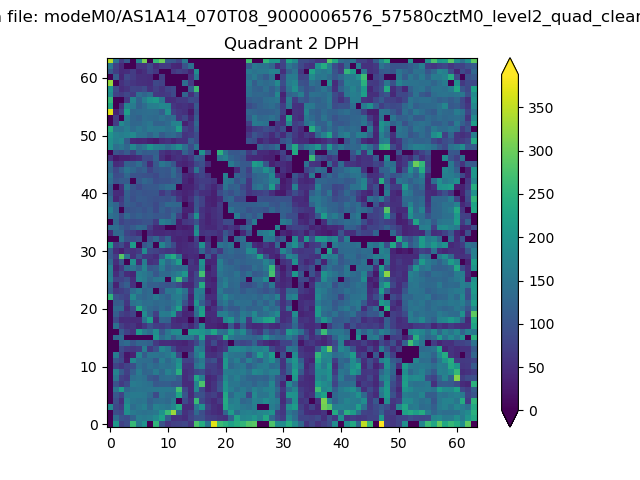 |
Quadrant C |
| Plot type | Count rate plots | Images |
|---|---|---|
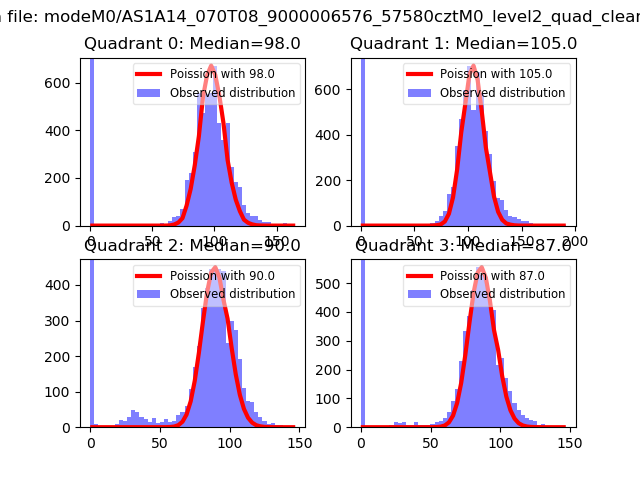
| Comparison with Poisson distribution Blue bars denote a histogram of data divided into 1 sec bins. Red curve is a Poisson curve with rate = median count rate of data. |
 |
 |
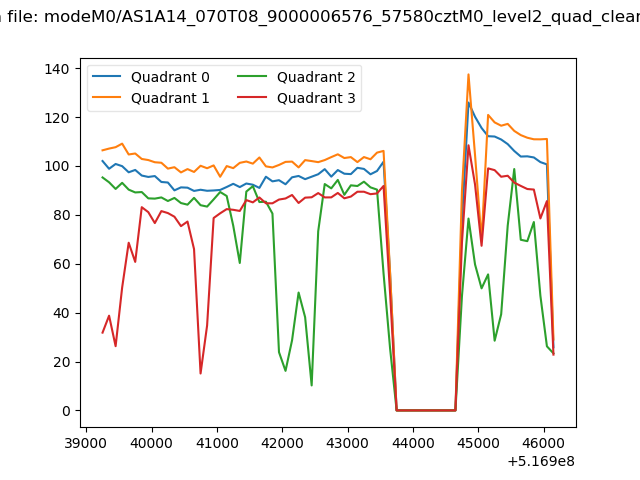
| Quadrant-wise count rates Data is divided into 100 sec bins |
 |
|
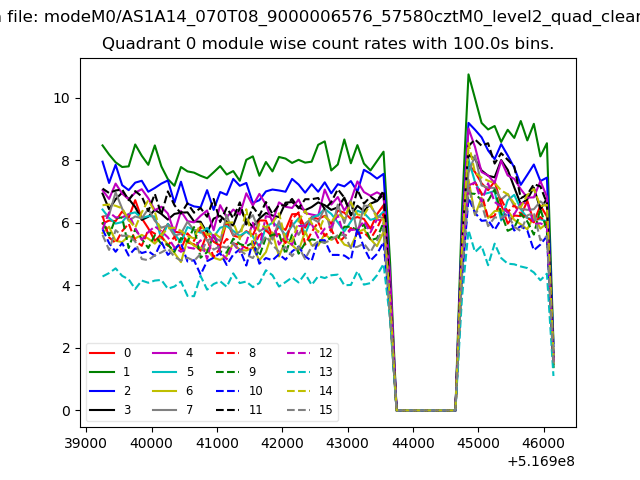
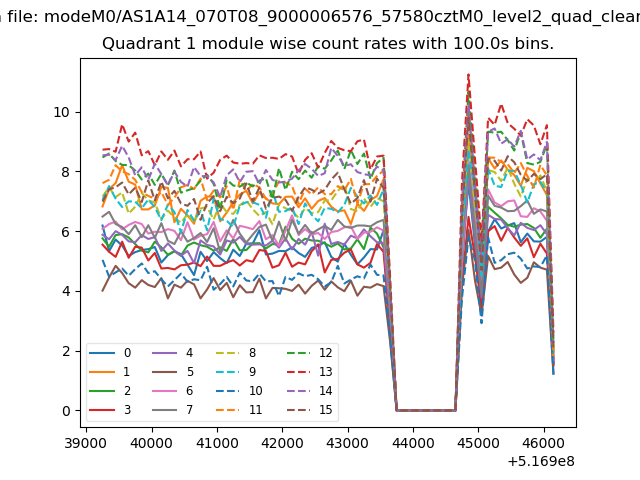
| Module-wise count rates for Quadrant A Data is divided into 100 sec bins |
 |
 |
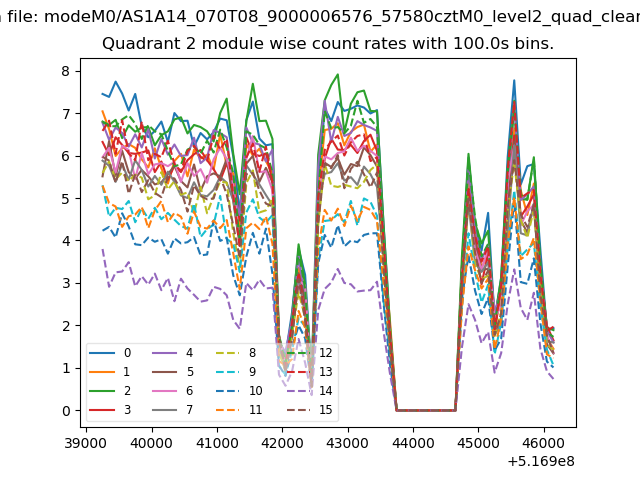
| Module-wise count rates for Quadrant B Data is divided into 100 sec bins |
 |
 |
| Module-wise count rates for Quadrant C Data is divided into 100 sec bins |
 |
 |
| Module-wise count rates for Quadrant D Data is divided into 100 sec bins |
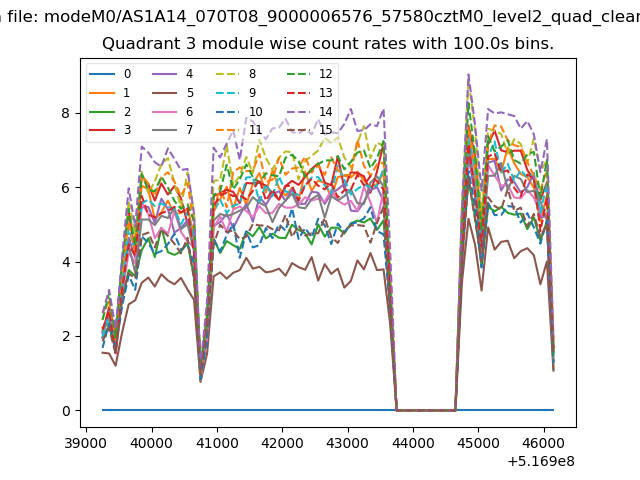 |
 |
| Parameter | Plot |
|---|---|
| CZT HV Monitor | 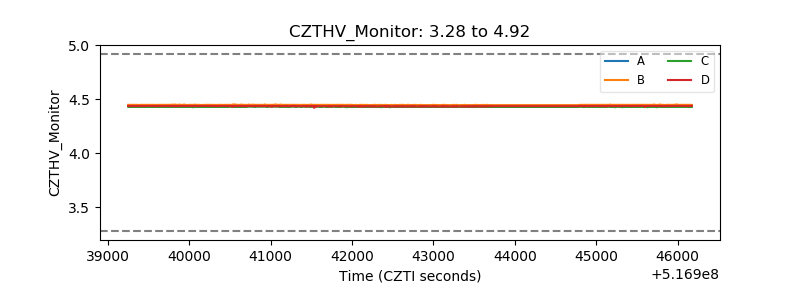 |
| D_VDD | 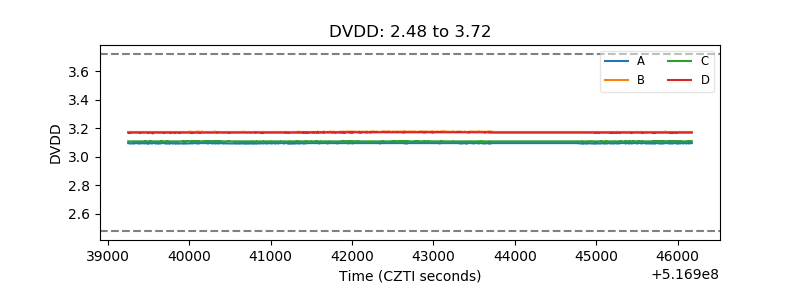 |
| Temperature 1 | 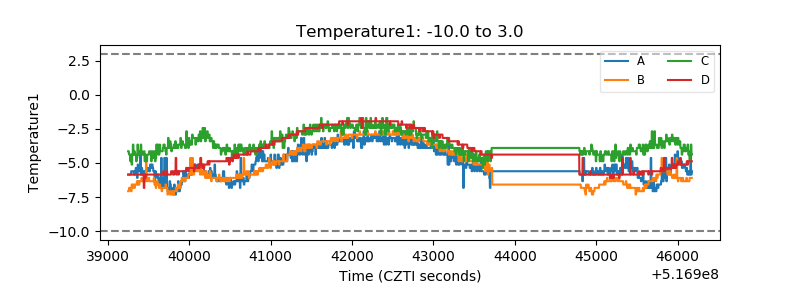 |
| Veto HV Monitor | 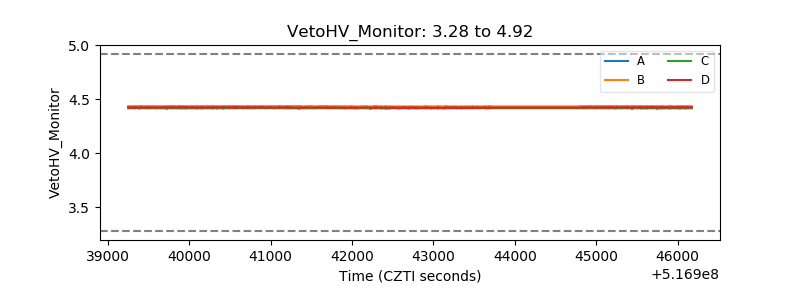 |
| Veto LLD | 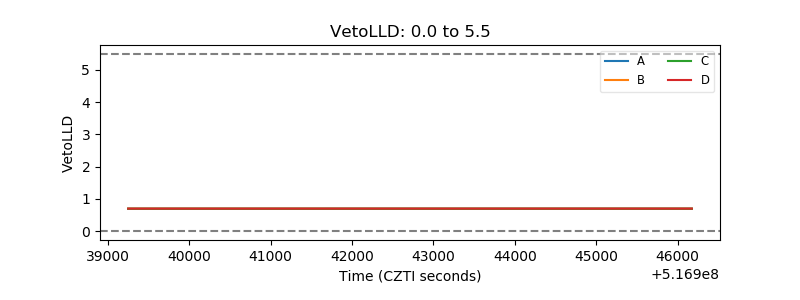 |
| Alpha Counter | 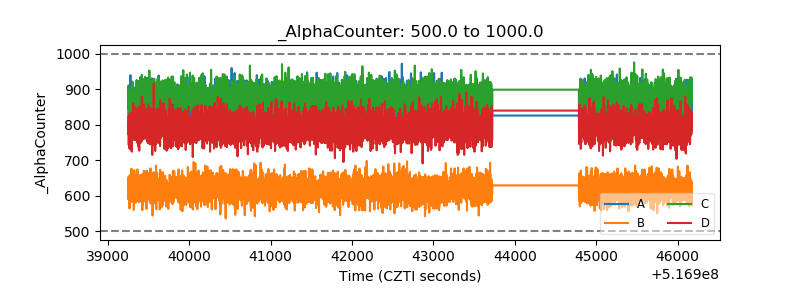 |
| _CPM_Rate | 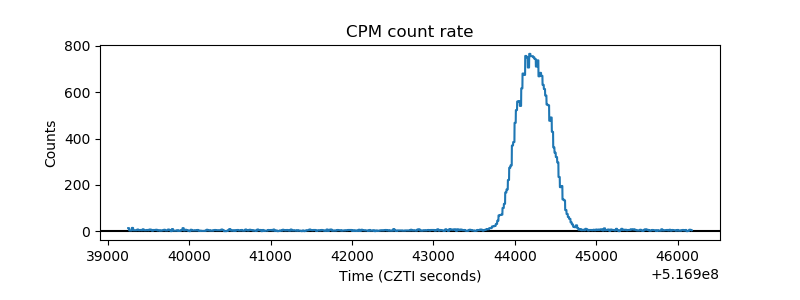 |
| CZT Counter | 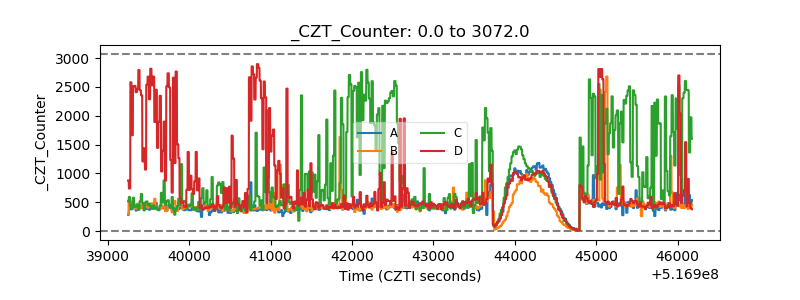 |
| +2.5 Volts monitor | 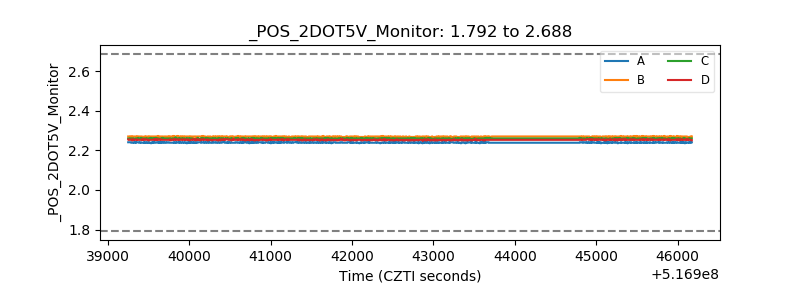 |
| +5 Volts monitor |  |
| _ROLL_ROT | 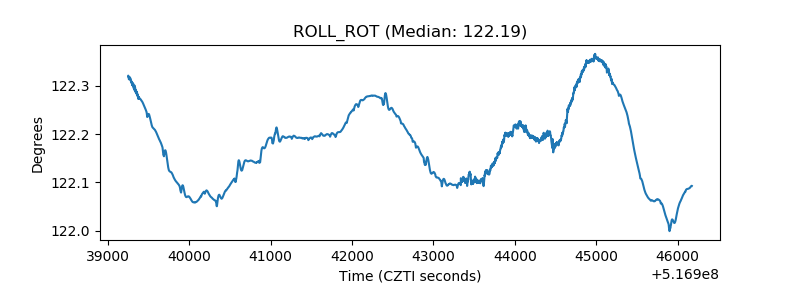 |
| _Roll_DEC | 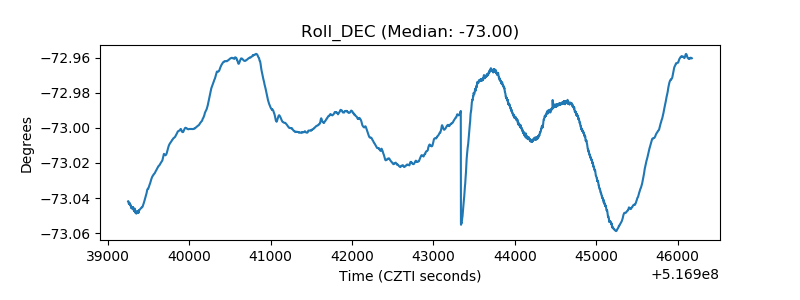 |
| _Roll_RA | 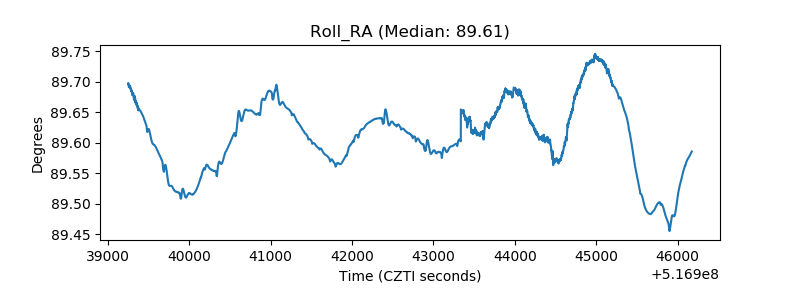 |
| Veto Counter | 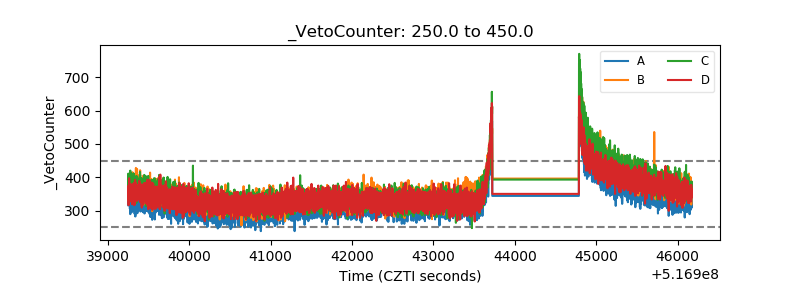 |