| Param | Original file | Final file |
|---|---|---|
| Filename | modeM0/AS1A14_070T08_9000006576_57581cztM0_level2.fits | modeM0/AS1A14_070T08_9000006576_57581cztM0_level2_quad_clean.evt |
| Size (bytes) | 599,567,040 | 90,089,280 |
| Size | 571.8 MB | 85.9 MB |
| Events in quadrant A | 2,936,368 | 667,226 |
| Events in quadrant B | 3,683,058 | 699,076 |
| Events in quadrant C | 10,692,756 | 333,961 |
| Events in quadrant D | 4,375,120 | 573,373 |
| Mode M0 | |||
|---|---|---|---|
| Quadrant | BADHDUFLAG | Total packets | Discarded packets |
| A | 0 | 13407 | 2 |
| B | 0 | 15425 | 2 |
| C | 0 | 36260 | 2 |
| D | 0 | 17502 | 2 |
| Mode M9 | |||
|---|---|---|---|
| Quadrant | BADHDUFLAG | Total packets | Discarded packets |
| A | 0 | 20 | 0 |
| B | 0 | 20 | 0 |
| C | 0 | 21 | 0 |
| D | 0 | 21 | 0 |
| Mode SS | |||
|---|---|---|---|
| Quadrant | BADHDUFLAG | Total packets | Discarded packets |
| A | 0 | 132 | 0 |
| B | 0 | 132 | 0 |
| C | 0 | 132 | 0 |
| D | 0 | 132 | 0 |
| Quadrant | Total seconds | Saturated seconds | Saturation percentage |
|---|---|---|---|
| A | 6512 | 64 | 0.982801% |
| B | 6511 | 307 | 4.715098% |
| C | 6512 | 3459 | 53.117322% |
| D | 6512 | 359 | 5.512899% |
Noise dominated data is calculated using 1-second bins in cleaned event files. If a bin has >2000 counts, and if more than 50% of those come from <1% of pixels, then it is considered to be noise-dominated and hence unusable.
| Quadrant | # 1 sec bins | Bins with >0 counts | Bins with >2000 counts | High rate bins dominated by noise | Noise dominated (total time) | Noise dominated (detector-on time) | Marked lightcurve |
|---|---|---|---|---|---|---|---|
| A | 7632 | 6513 | 0 | 0 | 0.00% | 0.00% | 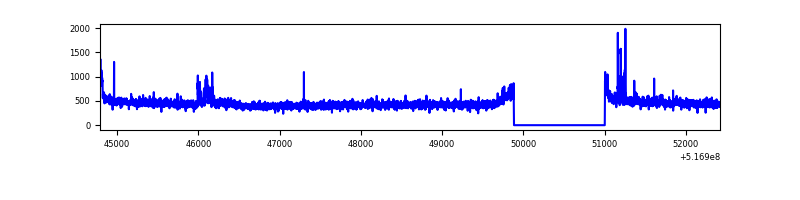 |
| B | 7632 | 6513 | 176 | 176 | 2.31% | 2.70% | 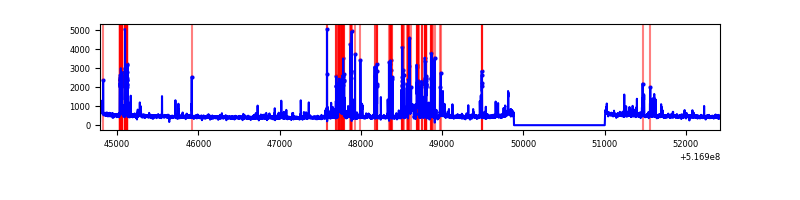 |
| C | 7632 | 6512 | 2444 | 2444 | 32.02% | 37.53% | 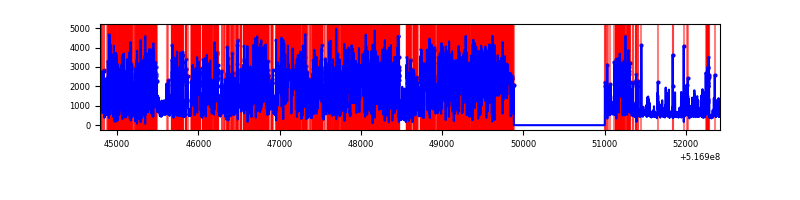 |
| D | 7632 | 6513 | 269 | 269 | 3.52% | 4.13% | 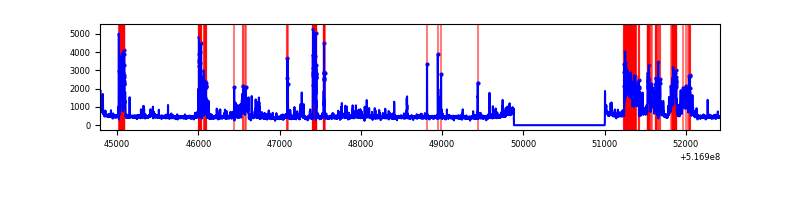 |
Top three noisy pixels from each quadrant. If the there are fewer than three noisy pixels in the level2.evt file, extra rows are filled as -1
| Pixel properties | Quadrant properties | ||||||
|---|---|---|---|---|---|---|---|
| Quadrant | DetID | PixID | Counts | Sigma | Mean | Median | Sigma |
| A | 3 | 250 | 49651 | 272.38 | 731 | 712 | 179.7 |
| A | 3 | 14 | 24845 | 134.32 | 731 | 712 | 179.7 |
| A | 4 | 249 | 19337 | 103.66 | 731 | 712 | 179.7 |
| B | 2 | 249 | 666616 | 4435.25 | 713 | 685 | 150.1 |
| B | 7 | 252 | 43874 | 287.65 | 713 | 685 | 150.1 |
| B | 4 | 201 | 35335 | 230.78 | 713 | 685 | 150.1 |
| C | 12 | 254 | 7484756 | 54901.15 | 503 | 497 | 136.3 |
| C | 15 | 224 | 973751 | 7139.35 | 503 | 497 | 136.3 |
| C | 14 | 254 | 102231 | 746.27 | 503 | 497 | 136.3 |
| D | 15 | 142 | 921207 | 4691.27 | 698 | 666 | 196.2 |
| D | 11 | 247 | 225884 | 1147.76 | 698 | 666 | 196.2 |
| D | 2 | 252 | 150769 | 764.96 | 698 | 666 | 196.2 |
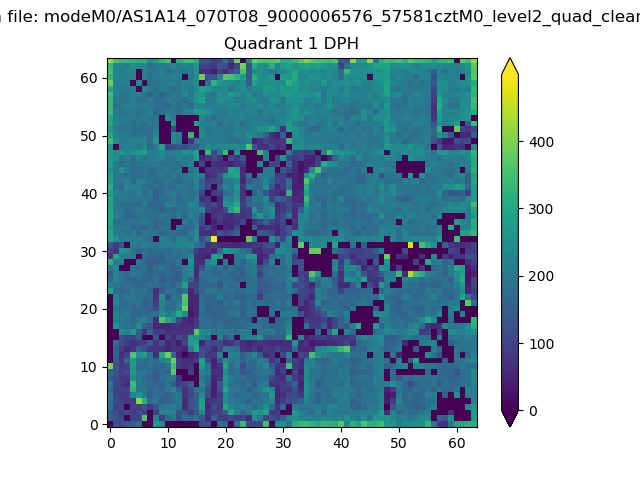
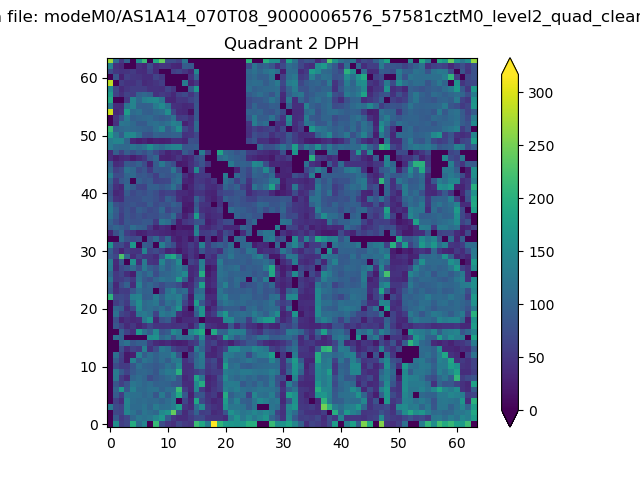
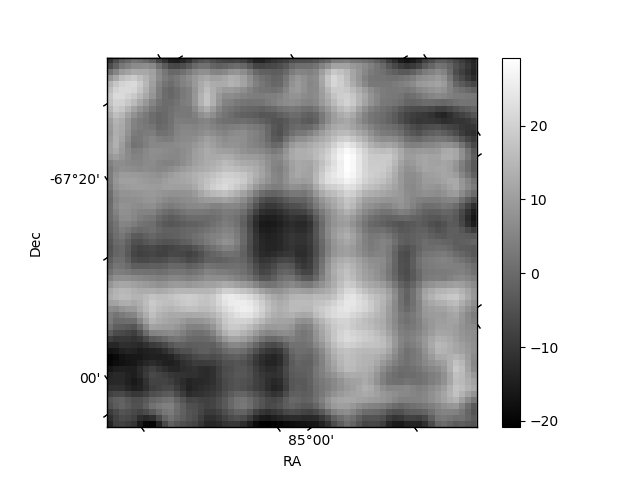
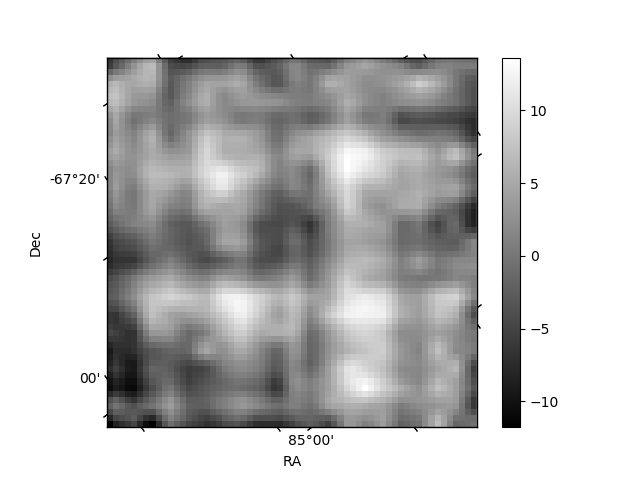
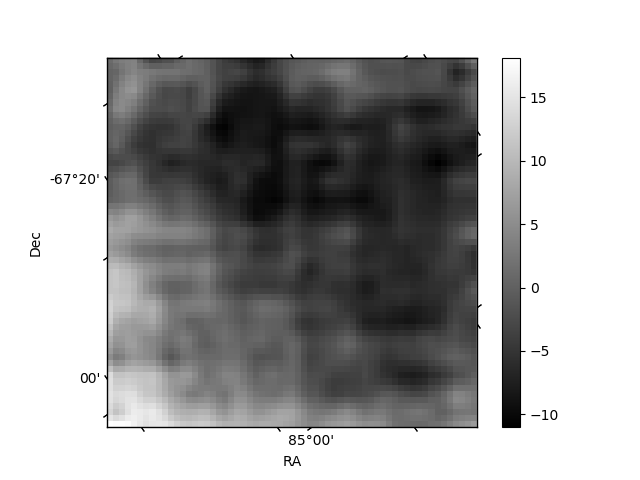
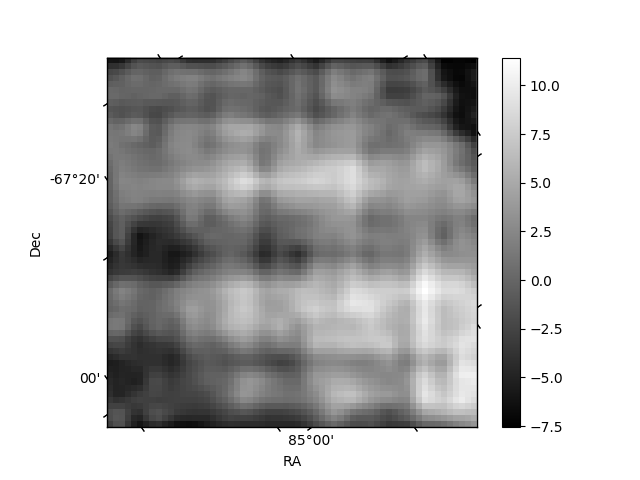
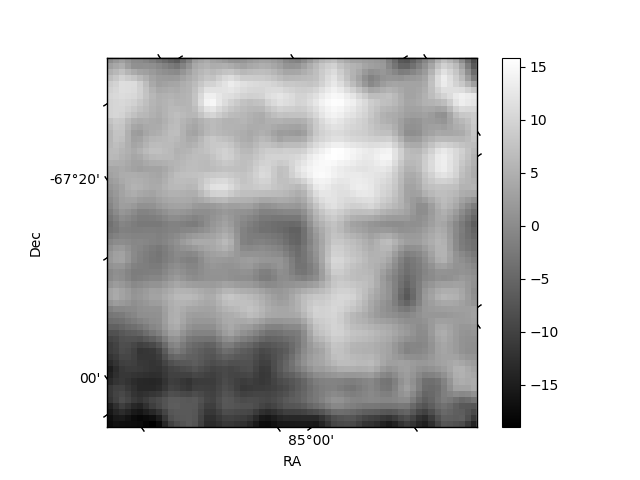
Histogram calculated using DETX and DETY for each event in the final _common_clean file
| Quadrant A | 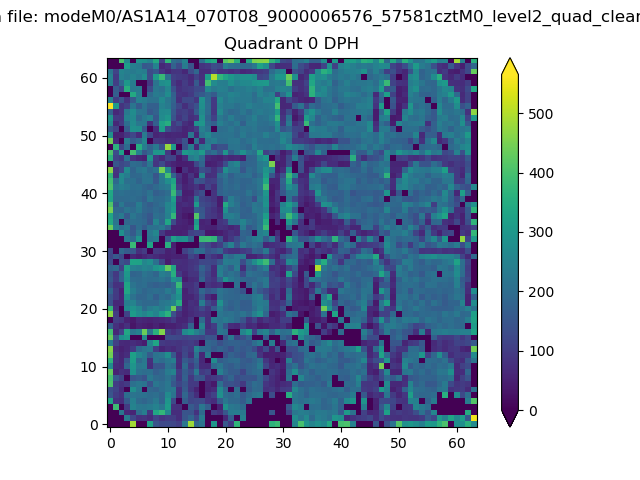 |
 |
Quadrant B |
|---|---|---|---|
| Quadrant D | 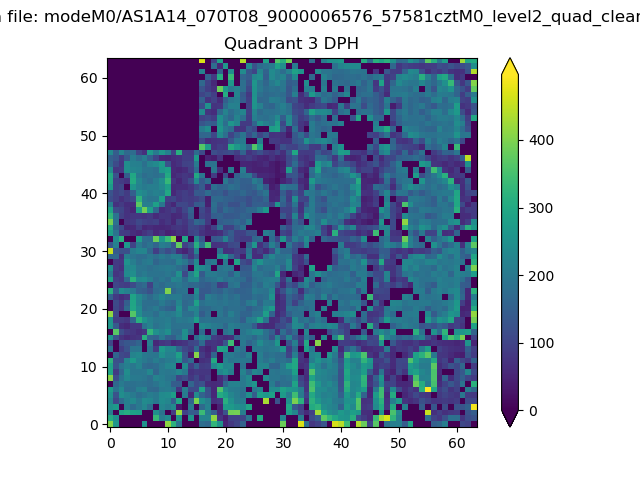 |
 |
Quadrant C |
| Plot type | Count rate plots | Images |
|---|---|---|
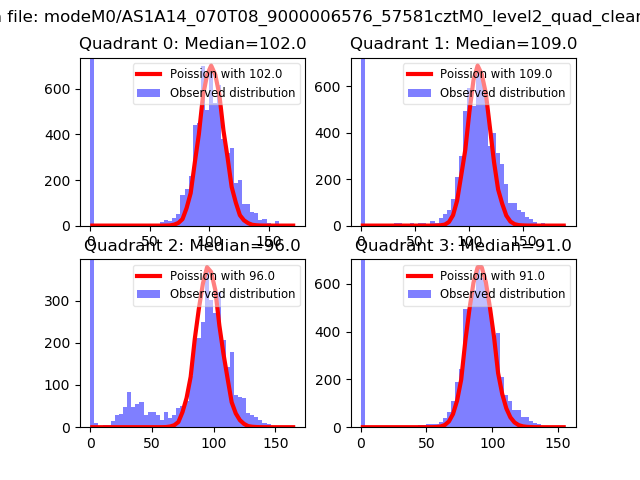
| Comparison with Poisson distribution Blue bars denote a histogram of data divided into 1 sec bins. Red curve is a Poisson curve with rate = median count rate of data. |
 |
 |
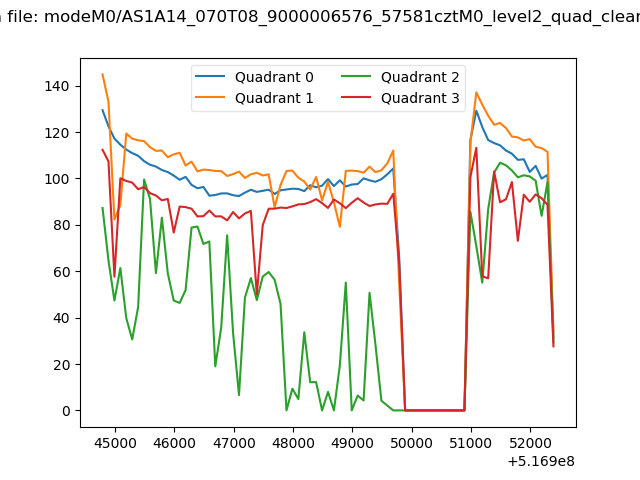
| Quadrant-wise count rates Data is divided into 100 sec bins |
 |
|
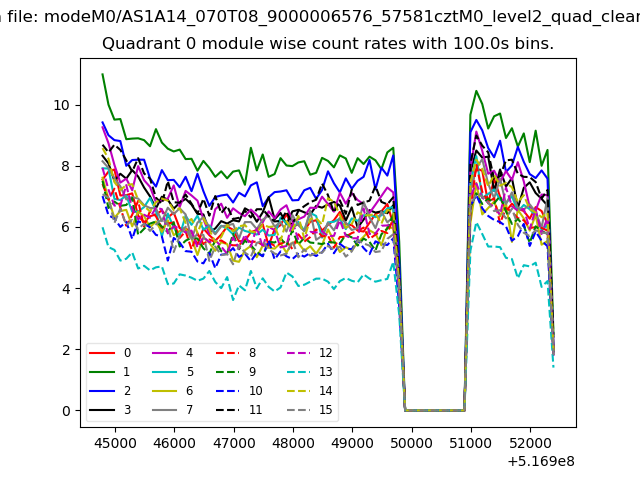
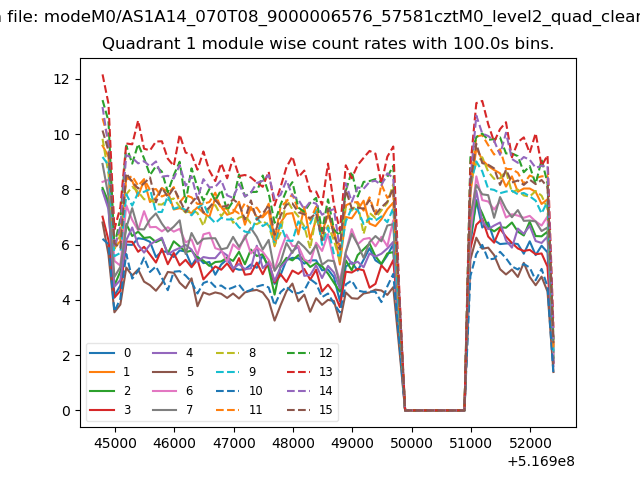
| Module-wise count rates for Quadrant A Data is divided into 100 sec bins |
 |
 |
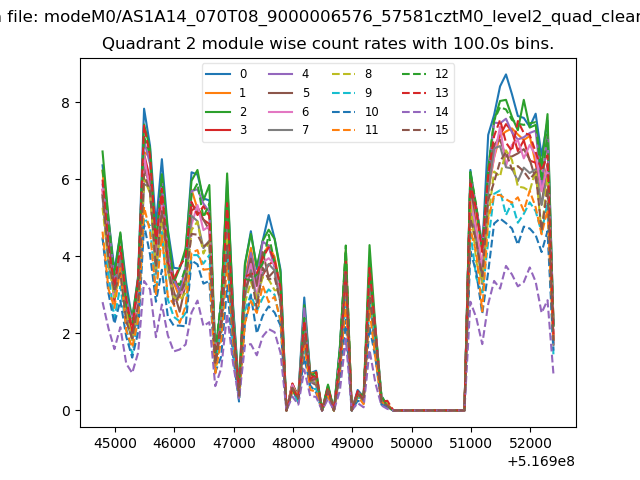
| Module-wise count rates for Quadrant B Data is divided into 100 sec bins |
 |
 |
| Module-wise count rates for Quadrant C Data is divided into 100 sec bins |
 |
 |
| Module-wise count rates for Quadrant D Data is divided into 100 sec bins |
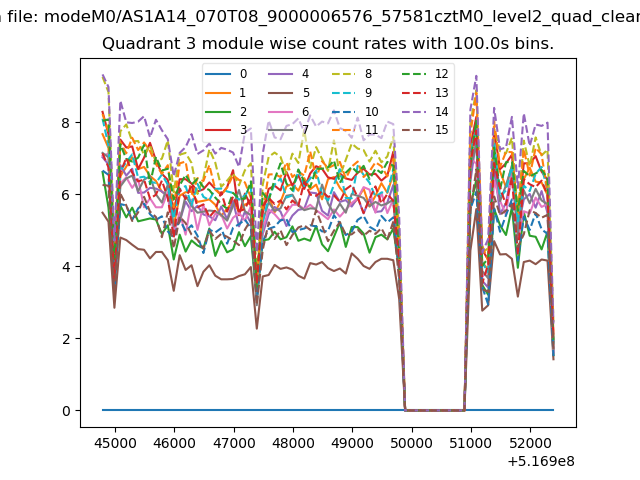 |
 |
| Parameter | Plot |
|---|---|
| CZT HV Monitor | 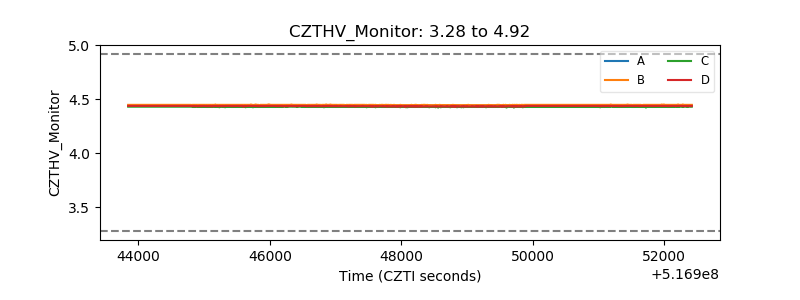 |
| D_VDD | 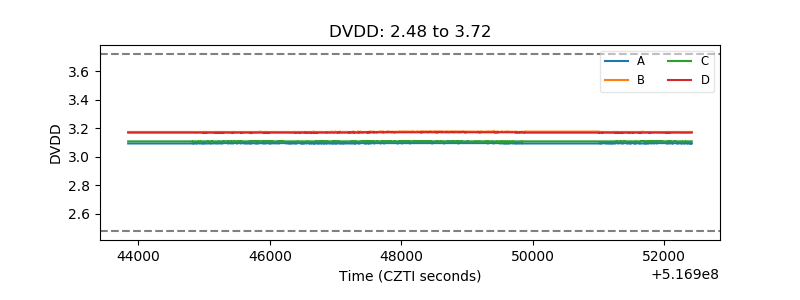 |
| Temperature 1 | 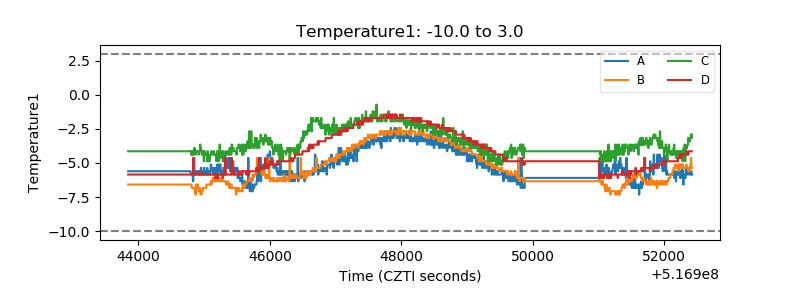 |
| Veto HV Monitor | 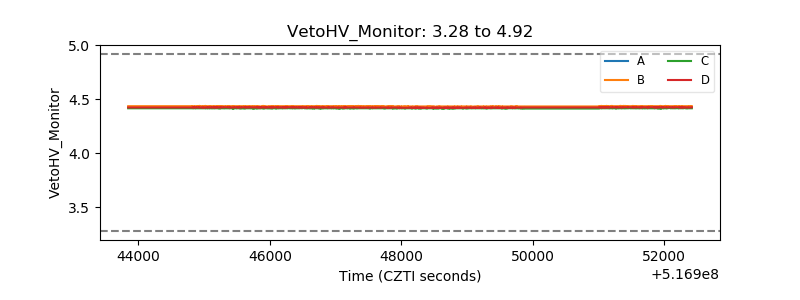 |
| Veto LLD | 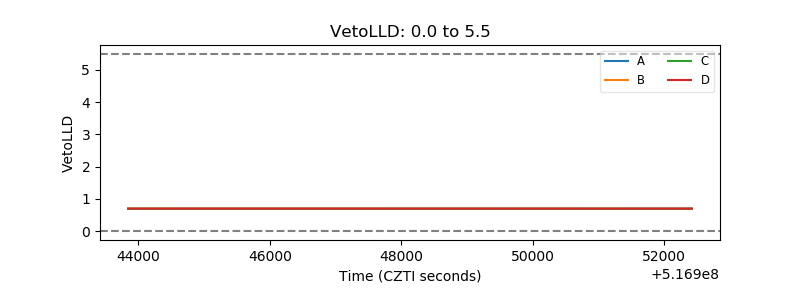 |
| Alpha Counter | 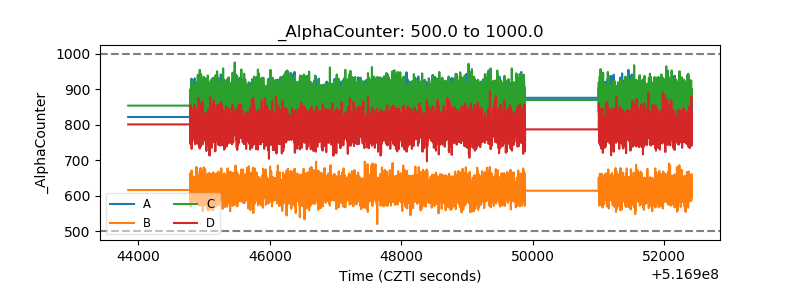 |
| _CPM_Rate | 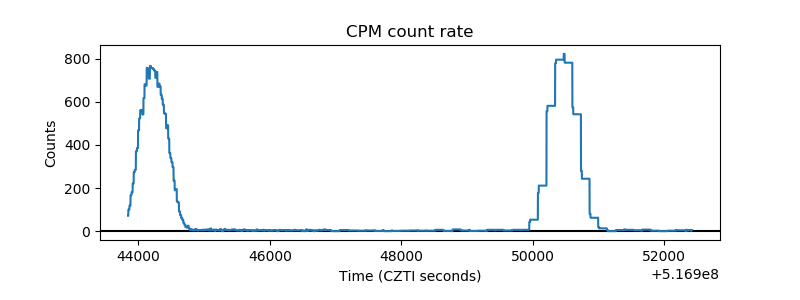 |
| CZT Counter | 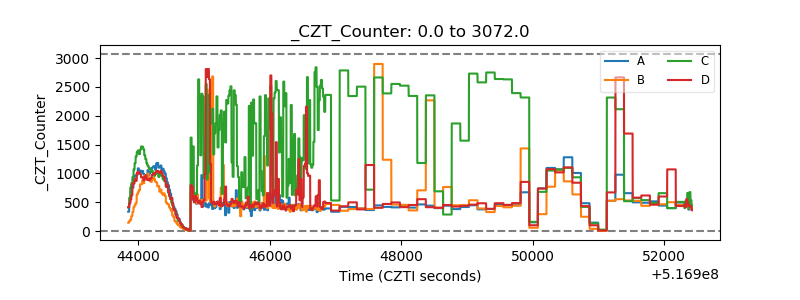 |
| +2.5 Volts monitor |  |
| +5 Volts monitor | 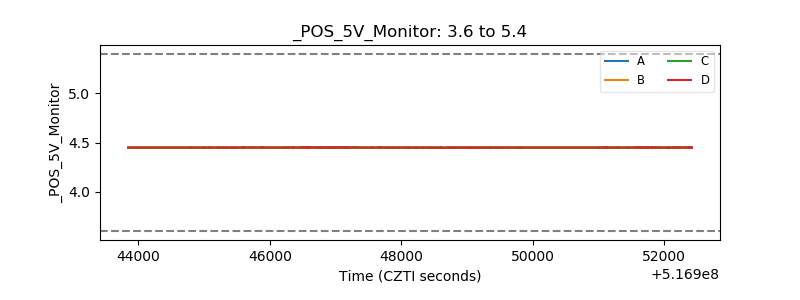 |
| _ROLL_ROT | 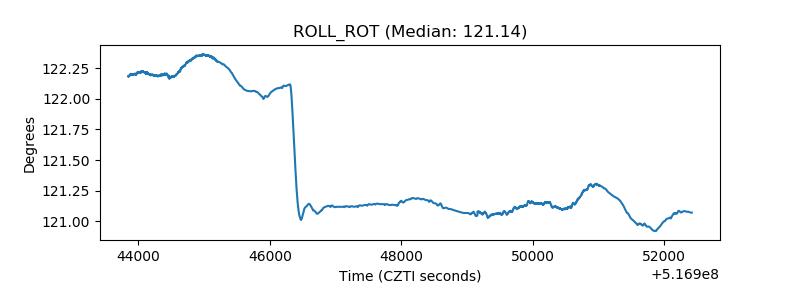 |
| _Roll_DEC | 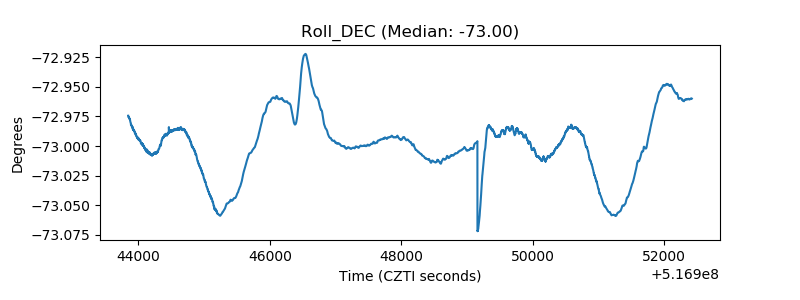 |
| _Roll_RA | 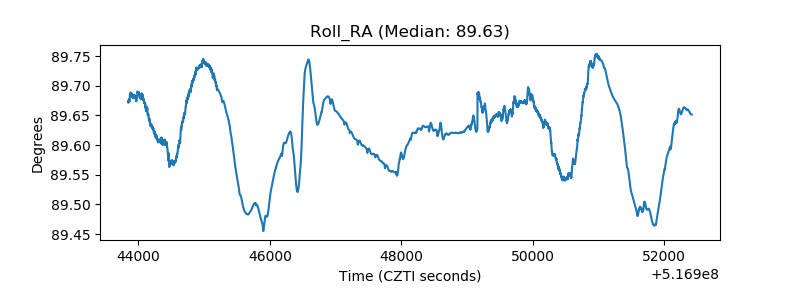 |
| Veto Counter | 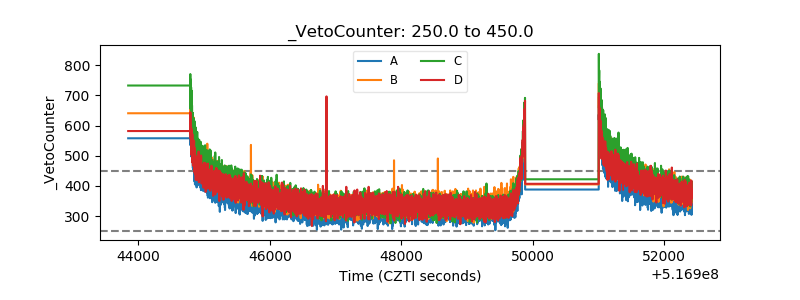 |