| Param | Original file | Final file |
|---|---|---|
| Filename | modeM0/AS1A14_070T08_9000006576_57583cztM0_level2.fits | modeM0/AS1A14_070T08_9000006576_57583cztM0_level2_quad_clean.evt |
| Size (bytes) | 420,733,440 | 92,859,840 |
| Size | 401.2 MB | 88.6 MB |
| Events in quadrant A | 2,687,764 | 626,140 |
| Events in quadrant B | 3,467,805 | 664,437 |
| Events in quadrant C | 4,493,574 | 567,586 |
| Events in quadrant D | 4,442,598 | 520,897 |
| Mode M0 | |||
|---|---|---|---|
| Quadrant | BADHDUFLAG | Total packets | Discarded packets |
| A | 0 | 12607 | 1 |
| B | 0 | 14480 | 1 |
| C | 0 | 17653 | 1 |
| D | 0 | 17466 | 1 |
| Mode M9 | |||
|---|---|---|---|
| Quadrant | BADHDUFLAG | Total packets | Discarded packets |
| A | 0 | 11 | 0 |
| B | 0 | 11 | 0 |
| C | 0 | 11 | 0 |
| D | 0 | 11 | 0 |
| Mode SS | |||
|---|---|---|---|
| Quadrant | BADHDUFLAG | Total packets | Discarded packets |
| A | 0 | 126 | 0 |
| B | 0 | 126 | 0 |
| C | 0 | 126 | 0 |
| D | 0 | 126 | 0 |
| Quadrant | Total seconds | Saturated seconds | Saturation percentage |
|---|---|---|---|
| A | 6199 | 56 | 0.903372% |
| B | 6199 | 188 | 3.032747% |
| C | 6199 | 416 | 6.710760% |
| D | 6199 | 529 | 8.533634% |
Noise dominated data is calculated using 1-second bins in cleaned event files. If a bin has >2000 counts, and if more than 50% of those come from <1% of pixels, then it is considered to be noise-dominated and hence unusable.
| Quadrant | # 1 sec bins | Bins with >0 counts | Bins with >2000 counts | High rate bins dominated by noise | Noise dominated (total time) | Noise dominated (detector-on time) | Marked lightcurve |
|---|---|---|---|---|---|---|---|
| A | 7315 | 6200 | 2 | 2 | 0.03% | 0.03% | 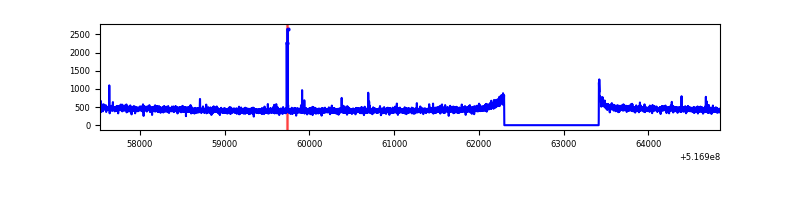 |
| B | 7315 | 6200 | 76 | 76 | 1.04% | 1.23% | 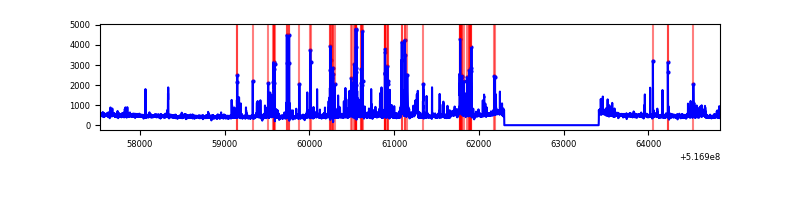 |
| C | 7315 | 6200 | 235 | 235 | 3.21% | 3.79% | 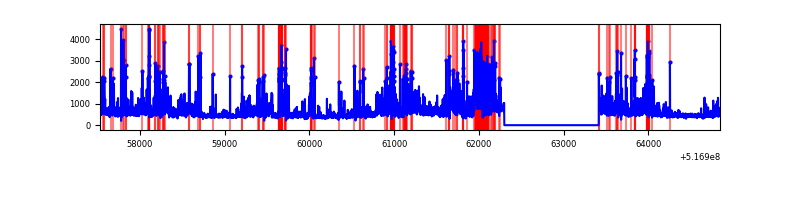 |
| D | 7315 | 6200 | 385 | 385 | 5.26% | 6.21% | 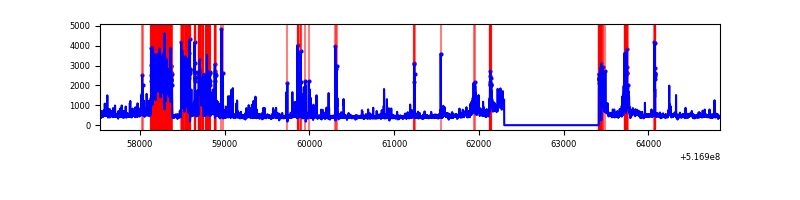 |
Top three noisy pixels from each quadrant. If the there are fewer than three noisy pixels in the level2.evt file, extra rows are filled as -1
| Pixel properties | Quadrant properties | ||||||
|---|---|---|---|---|---|---|---|
| Quadrant | DetID | PixID | Counts | Sigma | Mean | Median | Sigma |
| A | 4 | 13 | 12693 | 71.37 | 687 | 670 | 168.4 |
| A | 3 | 137 | 7960 | 43.28 | 687 | 670 | 168.4 |
| A | 3 | 14 | 7747 | 42.01 | 687 | 670 | 168.4 |
| B | 2 | 249 | 545437 | 3867.23 | 669 | 645 | 140.9 |
| B | 4 | 201 | 54770 | 384.21 | 669 | 645 | 140.9 |
| B | 0 | 245 | 32704 | 227.57 | 669 | 645 | 140.9 |
| C | 12 | 254 | 824692 | 4639.58 | 650 | 644 | 177.6 |
| C | 15 | 224 | 708287 | 3984.19 | 650 | 644 | 177.6 |
| C | 14 | 254 | 286001 | 1606.63 | 650 | 644 | 177.6 |
| D | 15 | 142 | 989109 | 5426.68 | 643 | 615 | 182.2 |
| D | 8 | 160 | 462112 | 2533.55 | 643 | 615 | 182.2 |
| D | 2 | 31 | 118110 | 645.03 | 643 | 615 | 182.2 |
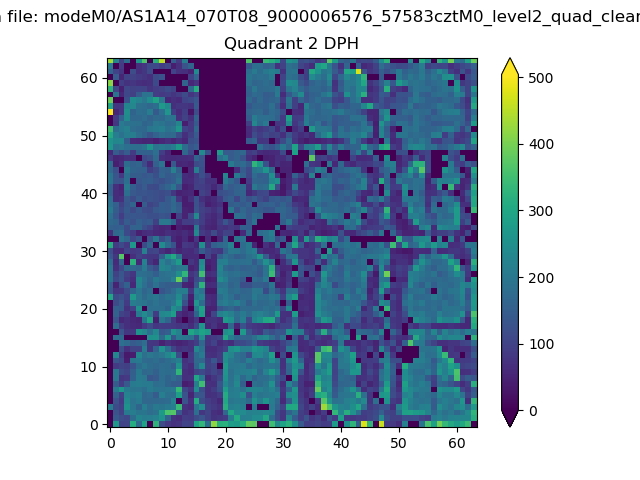
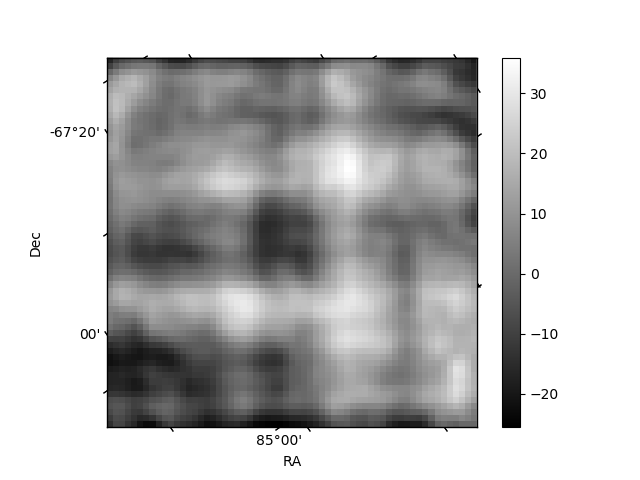
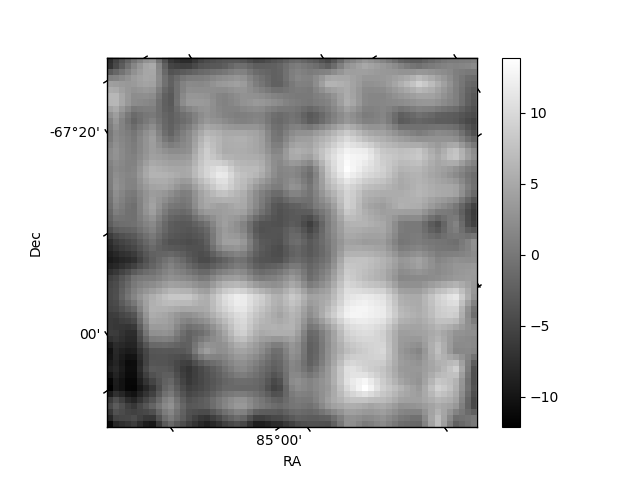
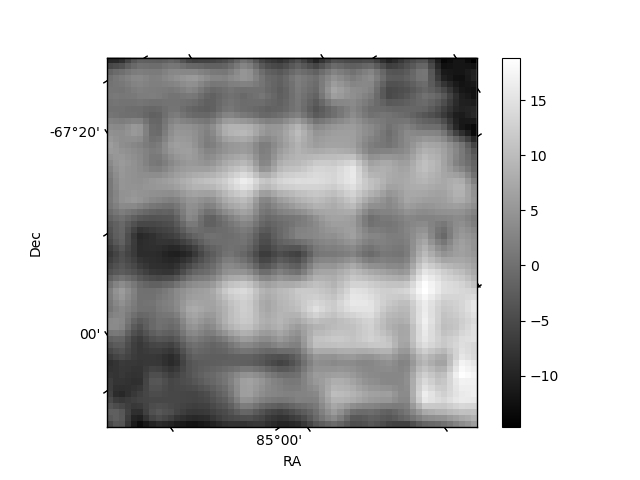
Histogram calculated using DETX and DETY for each event in the final _common_clean file
| Quadrant A | 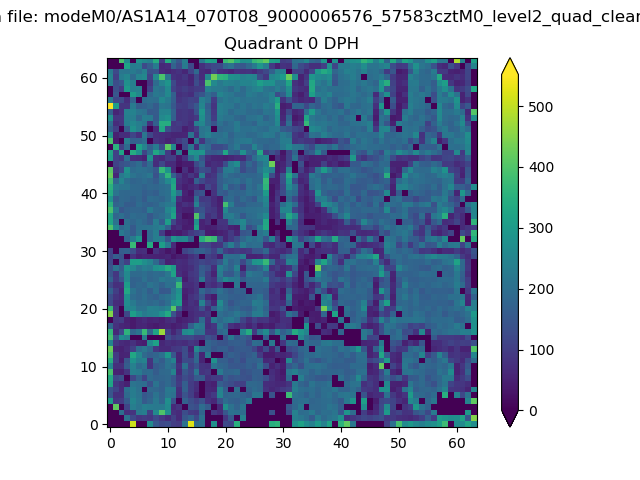 |
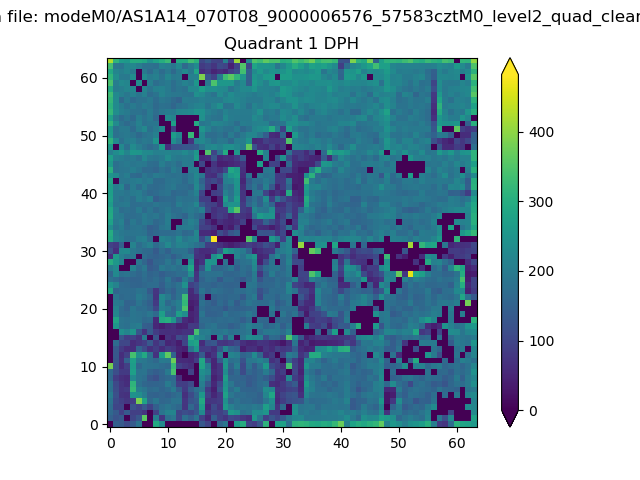 |
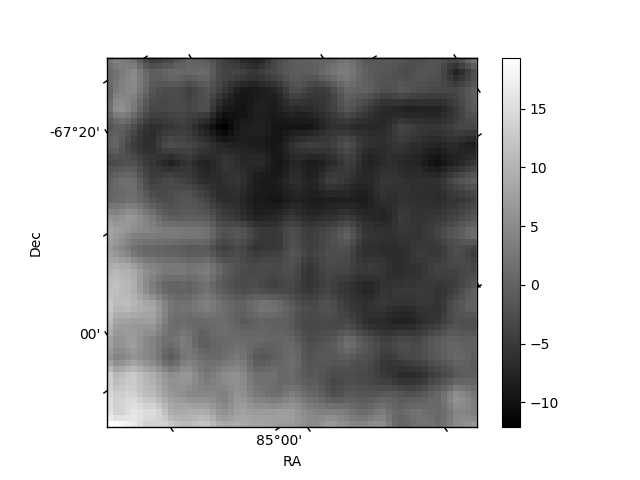
Quadrant B |
|---|---|---|---|
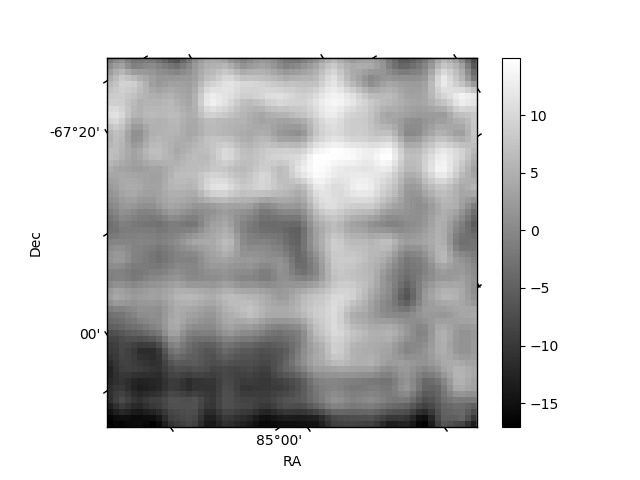
| Quadrant D | 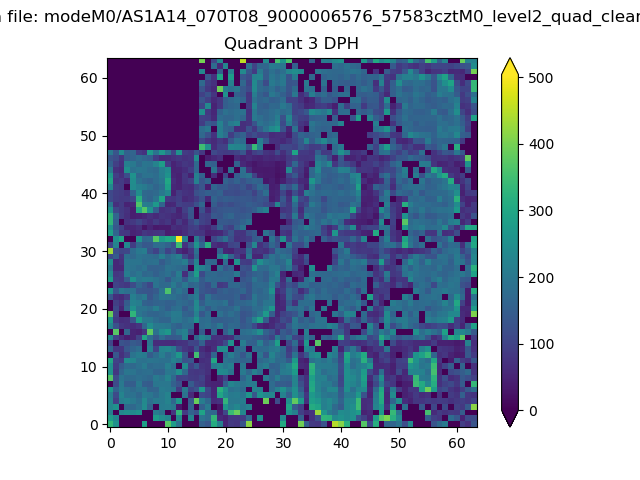 |
 |
Quadrant C |
| Plot type | Count rate plots | Images |
|---|---|---|
| Comparison with Poisson distribution Blue bars denote a histogram of data divided into 1 sec bins. Red curve is a Poisson curve with rate = median count rate of data. |
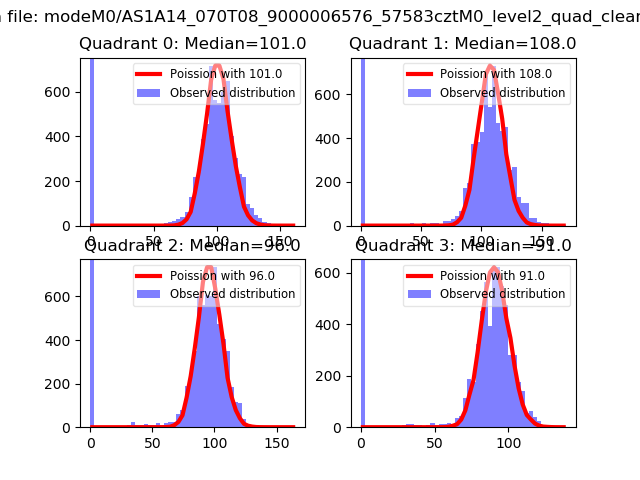 |
 |
| Quadrant-wise count rates Data is divided into 100 sec bins |
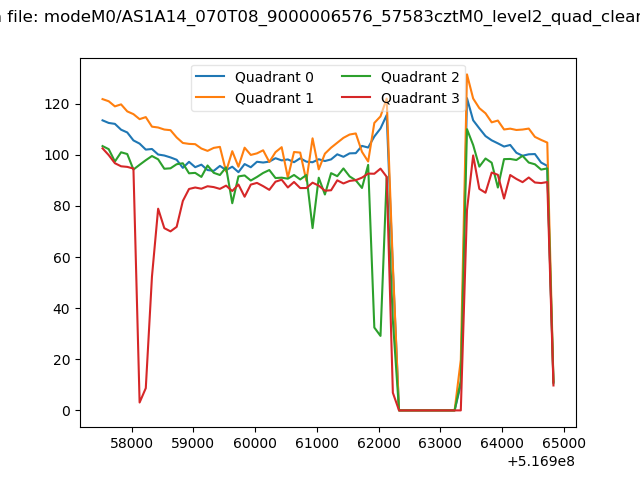 |
|
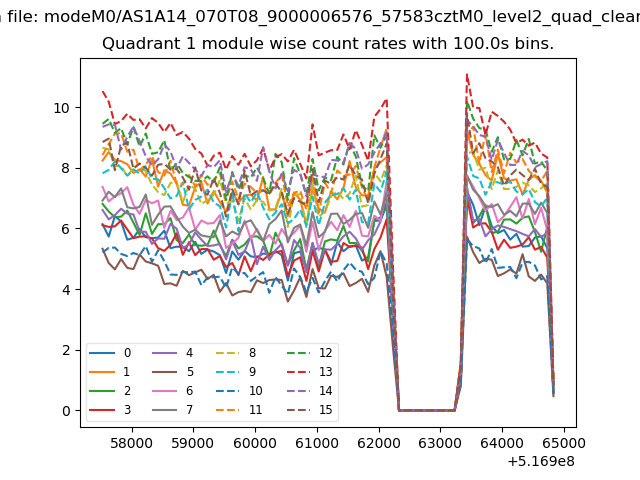
| Module-wise count rates for Quadrant A Data is divided into 100 sec bins |
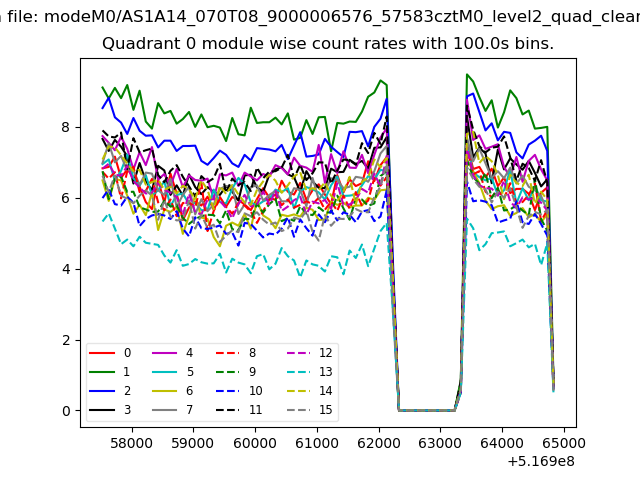 |
 |
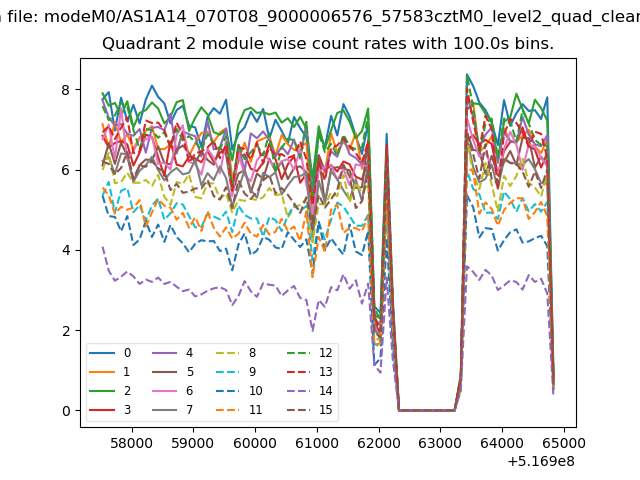
| Module-wise count rates for Quadrant B Data is divided into 100 sec bins |
 |
 |
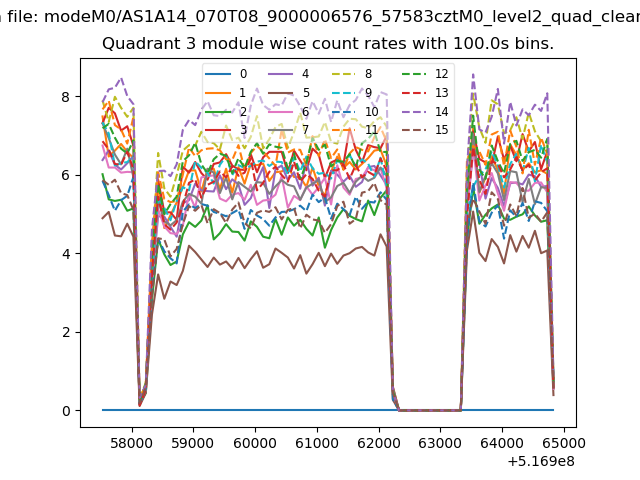
| Module-wise count rates for Quadrant C Data is divided into 100 sec bins |
 |
 |
| Module-wise count rates for Quadrant D Data is divided into 100 sec bins |
 |
 |
| Parameter | Plot |
|---|---|
| CZT HV Monitor | 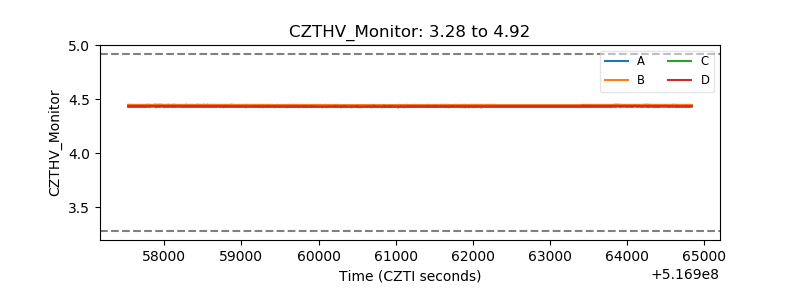 |
| D_VDD | 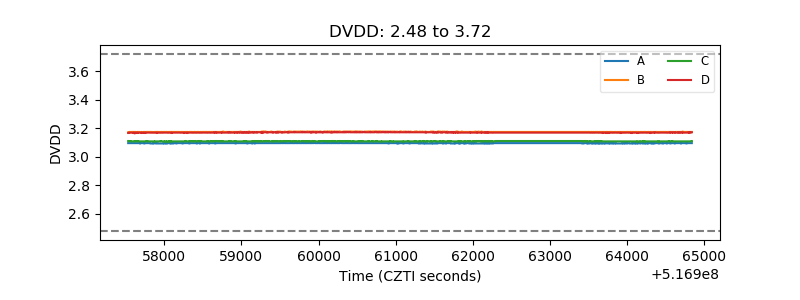 |
| Temperature 1 | 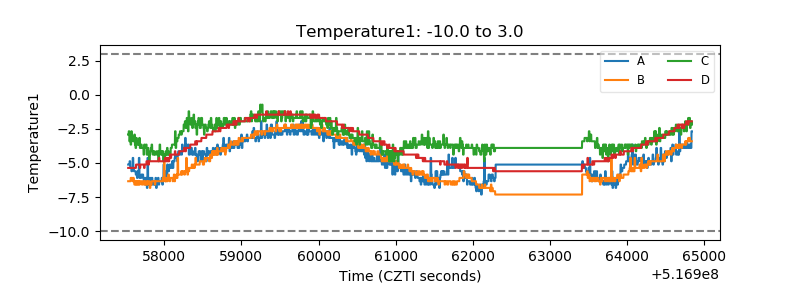 |
| Veto HV Monitor | 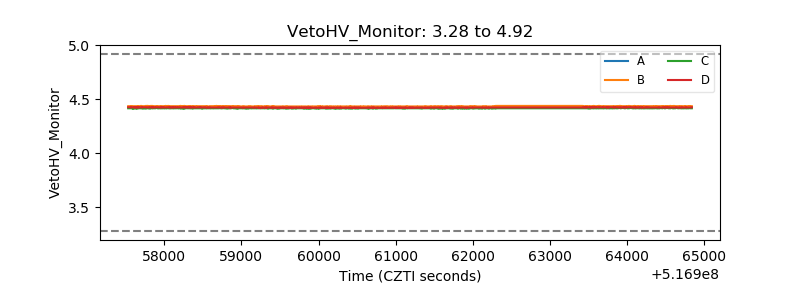 |
| Veto LLD | 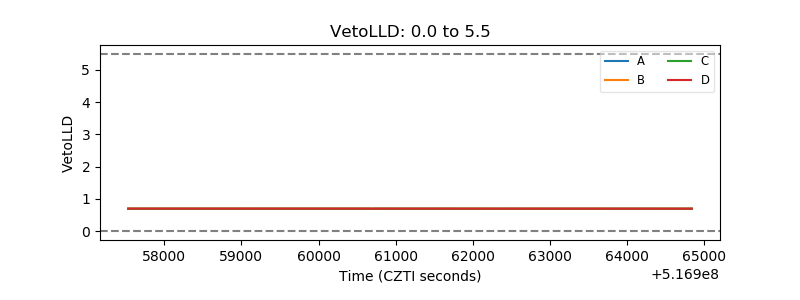 |
| Alpha Counter | 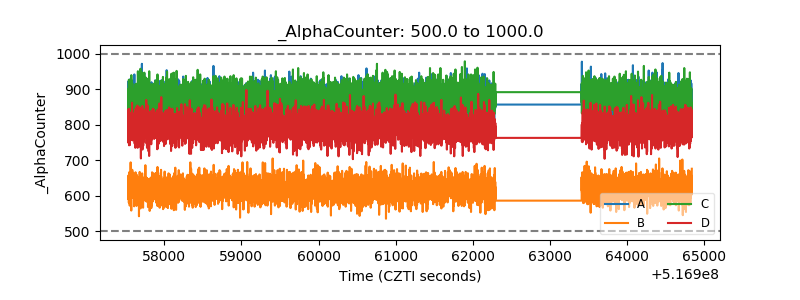 |
| _CPM_Rate | 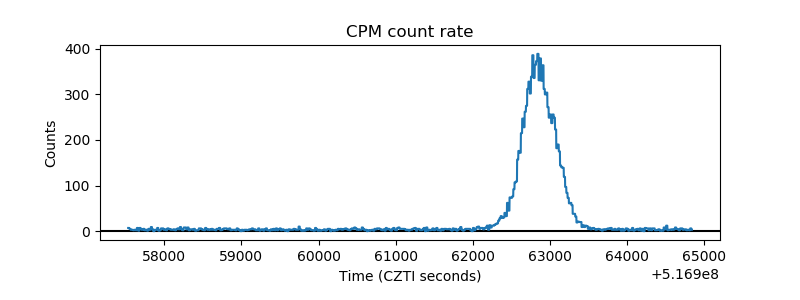 |
| CZT Counter | 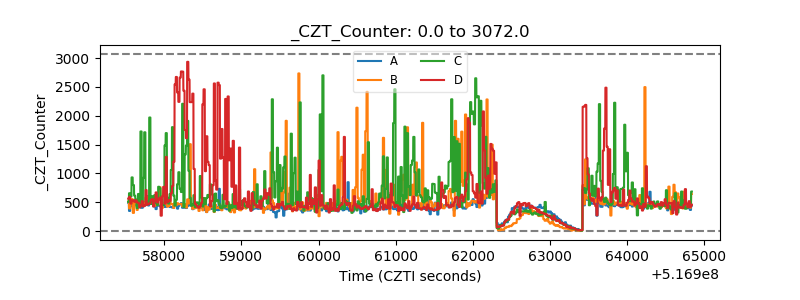 |
| +2.5 Volts monitor | 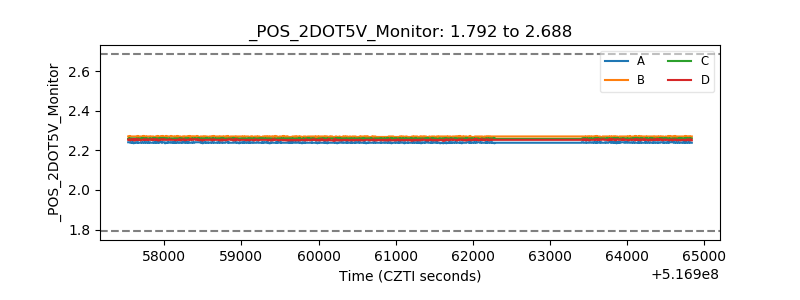 |
| +5 Volts monitor | 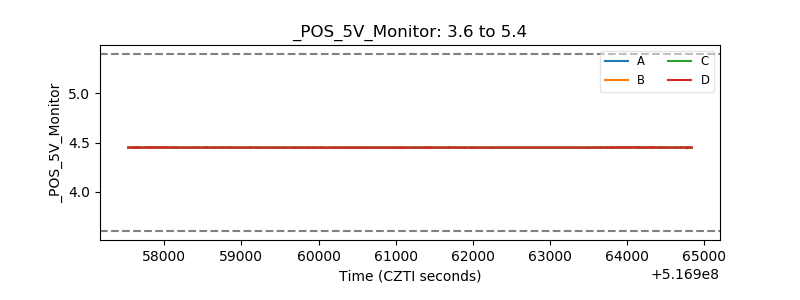 |
| _ROLL_ROT | 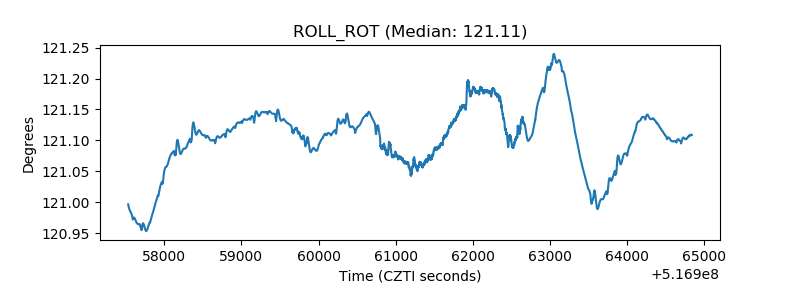 |
| _Roll_DEC | 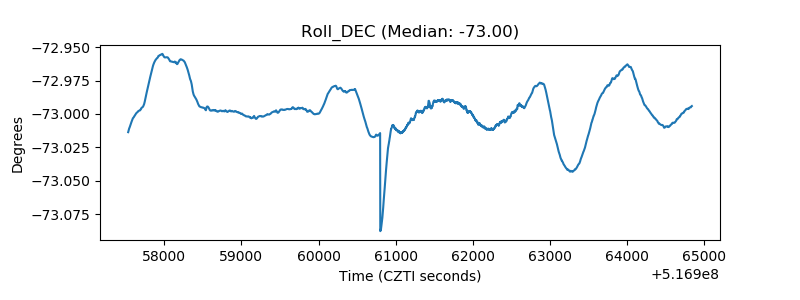 |
| _Roll_RA | 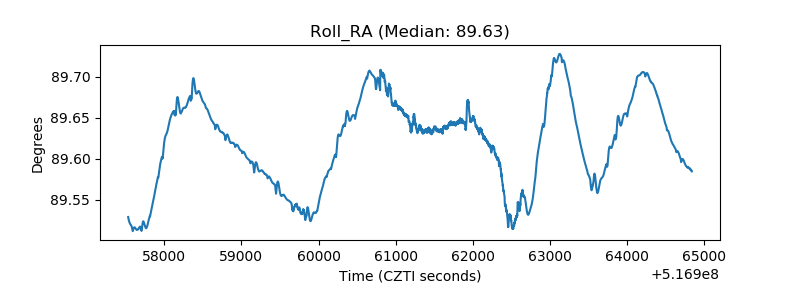 |
| Veto Counter | 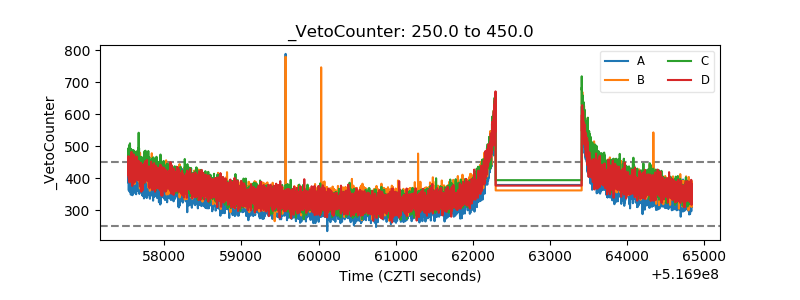 |