| Param | Original file | Final file |
|---|---|---|
| Filename | modeM0/AS1A14_070T08_9000006576_57585cztM0_level2.fits | modeM0/AS1A14_070T08_9000006576_57585cztM0_level2_quad_clean.evt |
| Size (bytes) | 482,935,680 | 96,932,160 |
| Size | 460.6 MB | 92.4 MB |
| Events in quadrant A | 2,966,628 | 642,643 |
| Events in quadrant B | 5,346,618 | 644,633 |
| Events in quadrant C | 4,746,877 | 603,349 |
| Events in quadrant D | 4,289,467 | 571,839 |
| Mode M0 | |||
|---|---|---|---|
| Quadrant | BADHDUFLAG | Total packets | Discarded packets |
| A | 0 | 14075 | 1 |
| B | 0 | 20636 | 1 |
| C | 0 | 19040 | 1 |
| D | 0 | 17472 | 1 |
| Mode M9 | |||
|---|---|---|---|
| Quadrant | BADHDUFLAG | Total packets | Discarded packets |
| A | 0 | 6 | 0 |
| B | 0 | 6 | 0 |
| C | 0 | 6 | 0 |
| D | 0 | 6 | 0 |
| Mode SS | |||
|---|---|---|---|
| Quadrant | BADHDUFLAG | Total packets | Discarded packets |
| A | 0 | 138 | 0 |
| B | 0 | 138 | 0 |
| C | 0 | 138 | 0 |
| D | 0 | 138 | 0 |
| Quadrant | Total seconds | Saturated seconds | Saturation percentage |
|---|---|---|---|
| A | 6778 | 145 | 2.139274% |
| B | 6779 | 713 | 10.517775% |
| C | 6779 | 379 | 5.590795% |
| D | 6779 | 318 | 4.690957% |
Noise dominated data is calculated using 1-second bins in cleaned event files. If a bin has >2000 counts, and if more than 50% of those come from <1% of pixels, then it is considered to be noise-dominated and hence unusable.
| Quadrant | # 1 sec bins | Bins with >0 counts | Bins with >2000 counts | High rate bins dominated by noise | Noise dominated (total time) | Noise dominated (detector-on time) | Marked lightcurve |
|---|---|---|---|---|---|---|---|
| A | 7343 | 6779 | 15 | 15 | 0.20% | 0.22% | 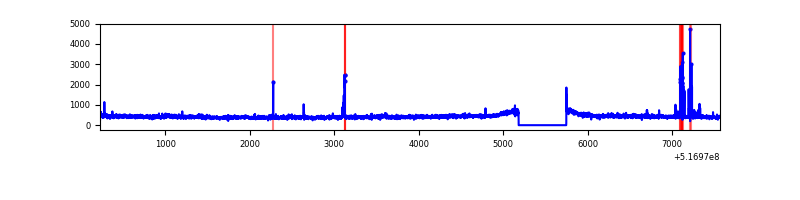 |
| B | 7344 | 6780 | 369 | 369 | 5.02% | 5.44% | 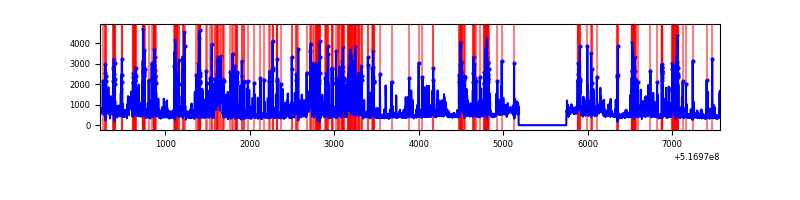 |
| C | 7344 | 6780 | 254 | 254 | 3.46% | 3.75% | 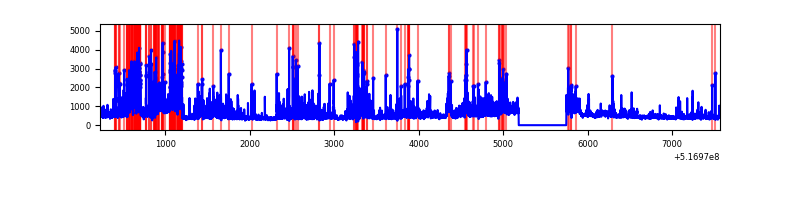 |
| D | 7344 | 6780 | 218 | 218 | 2.97% | 3.22% | 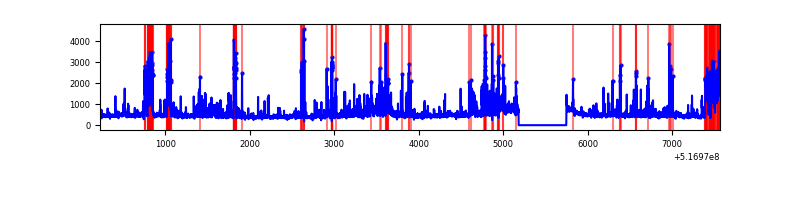 |
Top three noisy pixels from each quadrant. If the there are fewer than three noisy pixels in the level2.evt file, extra rows are filled as -1
| Pixel properties | Quadrant properties | ||||||
|---|---|---|---|---|---|---|---|
| Quadrant | DetID | PixID | Counts | Sigma | Mean | Median | Sigma |
| A | 7 | 160 | 76212 | 419.37 | 729 | 709 | 180.0 |
| A | 3 | 14 | 45948 | 251.28 | 729 | 709 | 180.0 |
| A | 3 | 245 | 18233 | 97.34 | 729 | 709 | 180.0 |
| B | 2 | 249 | 2038759 | 13807.98 | 695 | 669 | 147.6 |
| B | 5 | 185 | 225588 | 1523.82 | 695 | 669 | 147.6 |
| B | 10 | 247 | 100902 | 679.07 | 695 | 669 | 147.6 |
| C | 15 | 224 | 991417 | 5258.43 | 693 | 687 | 188.4 |
| C | 12 | 254 | 773977 | 4104.34 | 693 | 687 | 188.4 |
| C | 14 | 254 | 192768 | 1019.5 | 693 | 687 | 188.4 |
| D | 2 | 249 | 426868 | 2133.29 | 702 | 668 | 199.8 |
| D | 3 | 224 | 230234 | 1149.07 | 702 | 668 | 199.8 |
| D | 8 | 240 | 228231 | 1139.04 | 702 | 668 | 199.8 |
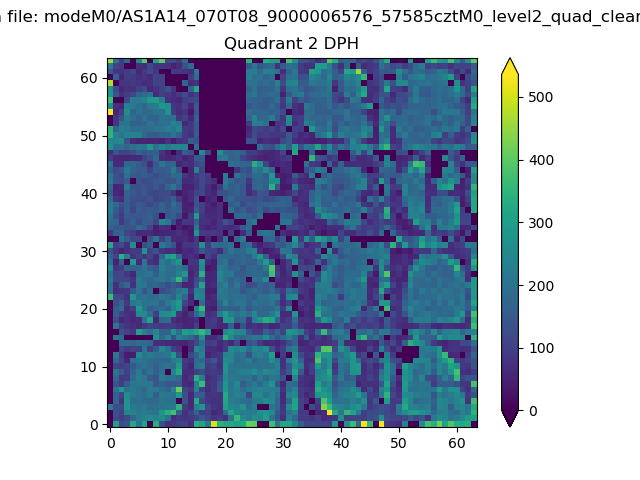
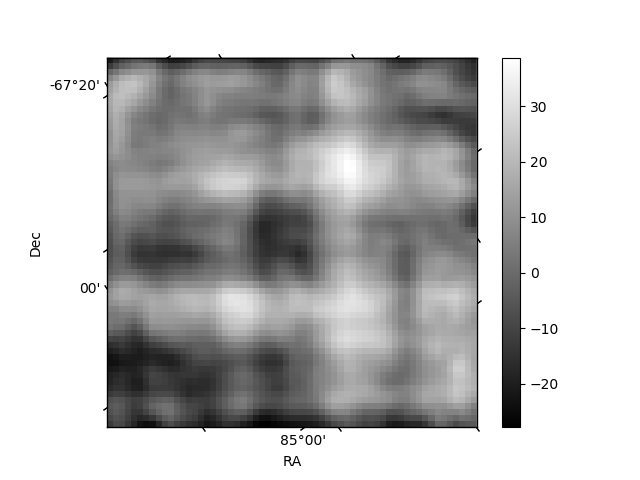
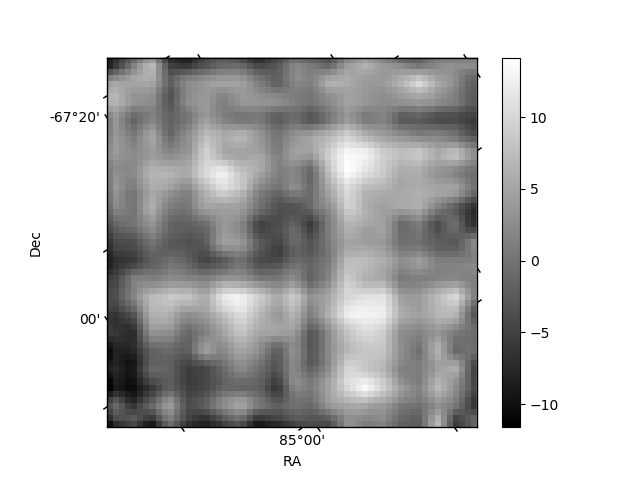
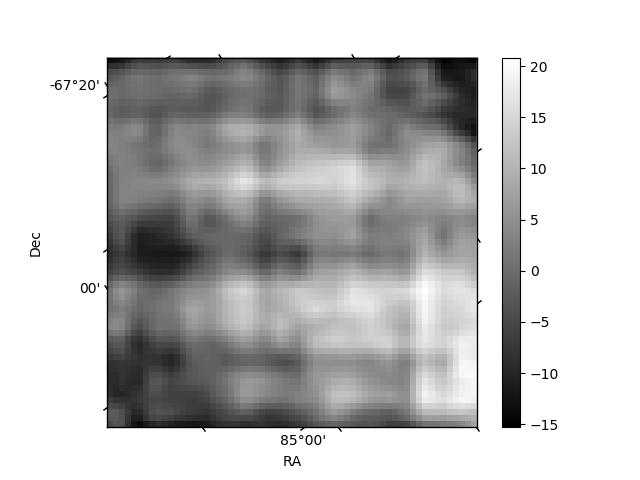
Histogram calculated using DETX and DETY for each event in the final _common_clean file
| Quadrant A | 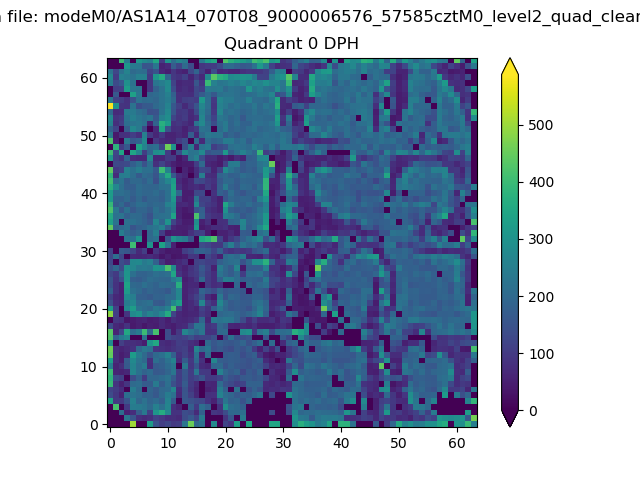 |
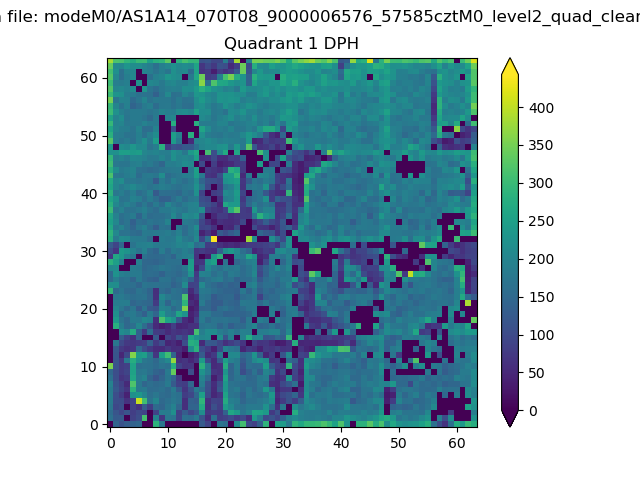 |
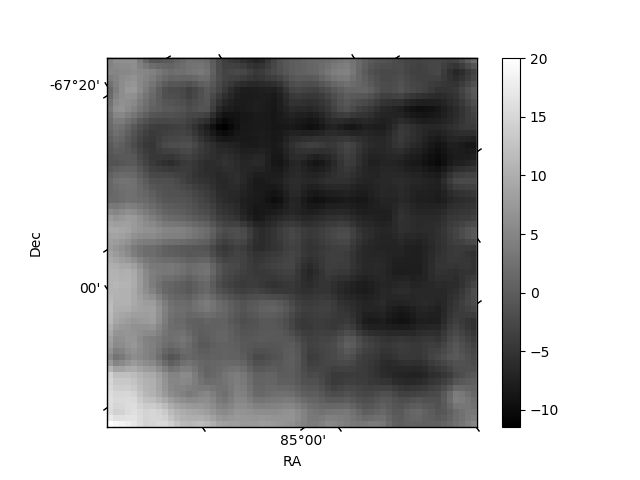
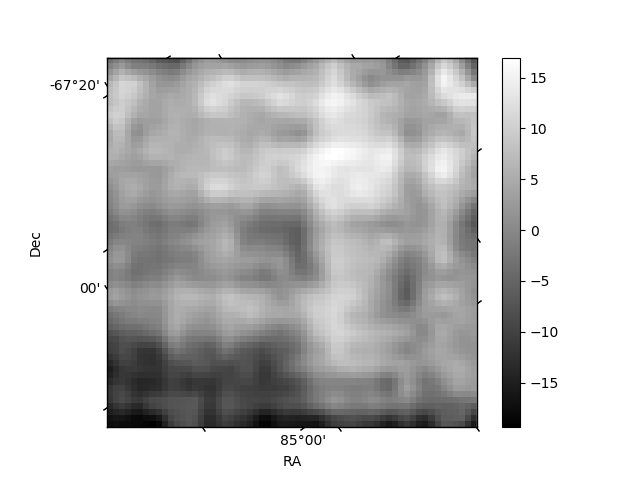
Quadrant B |
|---|---|---|---|
| Quadrant D | 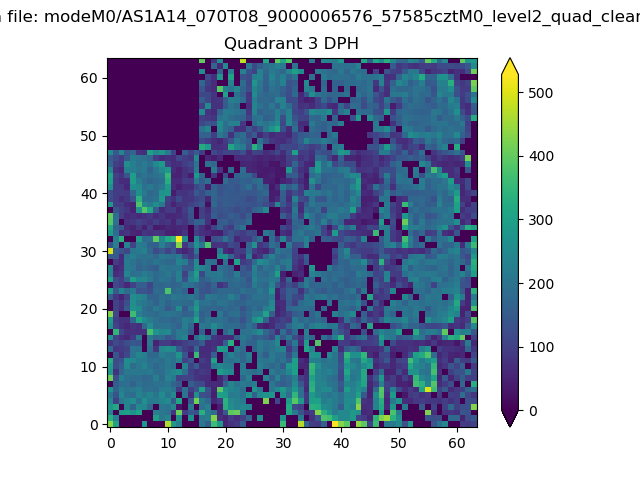 |
 |
Quadrant C |
| Plot type | Count rate plots | Images |
|---|---|---|
| Comparison with Poisson distribution Blue bars denote a histogram of data divided into 1 sec bins. Red curve is a Poisson curve with rate = median count rate of data. |
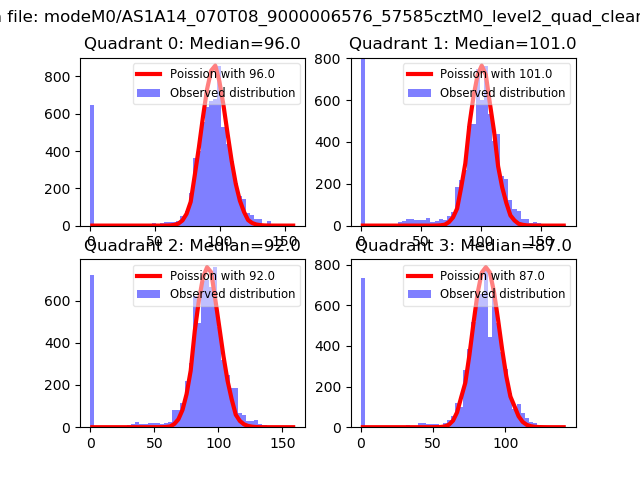 |
 |
| Quadrant-wise count rates Data is divided into 100 sec bins |
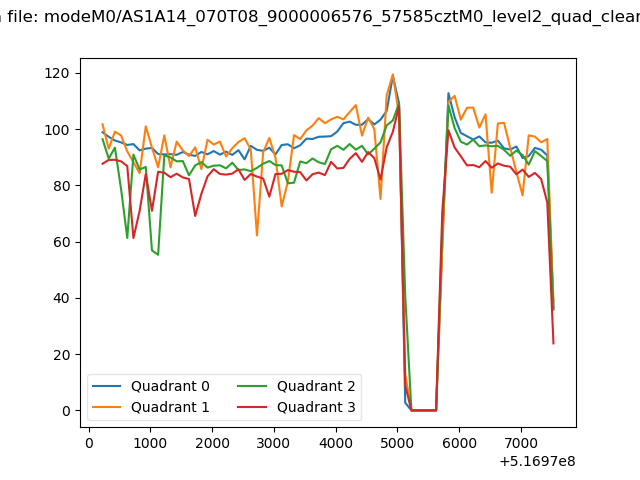 |
|
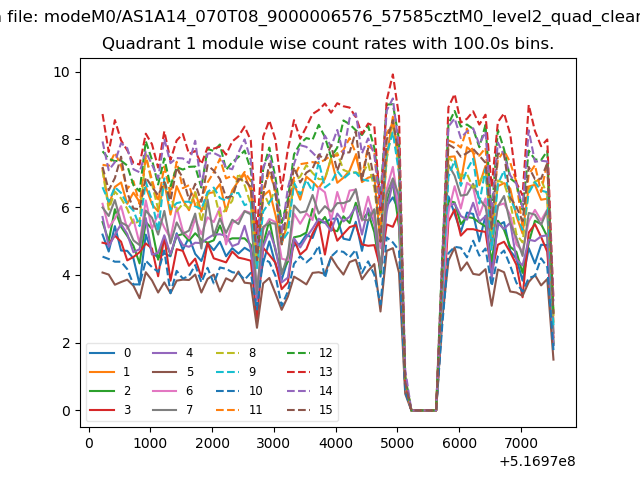
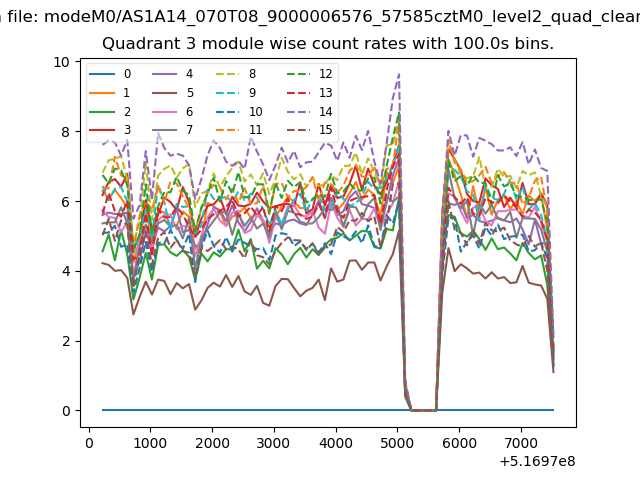
| Module-wise count rates for Quadrant A Data is divided into 100 sec bins |
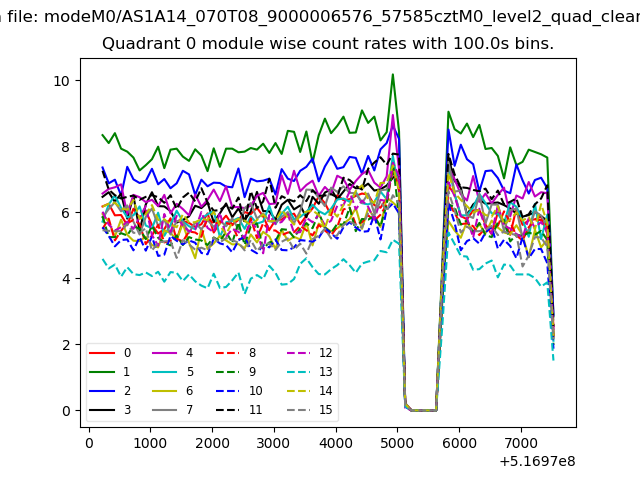 |
 |
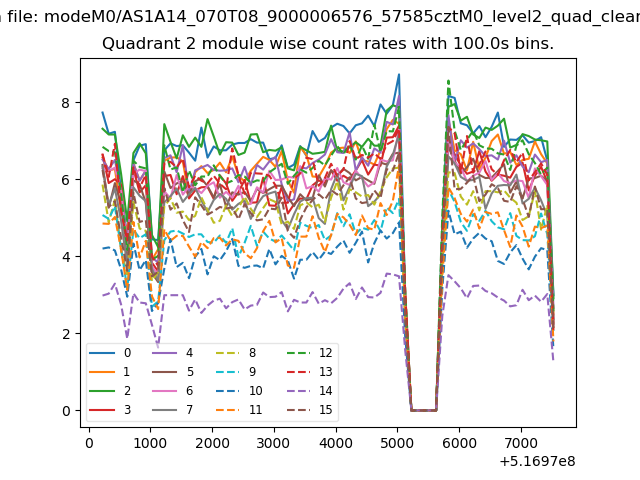
| Module-wise count rates for Quadrant B Data is divided into 100 sec bins |
 |
 |
| Module-wise count rates for Quadrant C Data is divided into 100 sec bins |
 |
 |
| Module-wise count rates for Quadrant D Data is divided into 100 sec bins |
 |
 |
| Parameter | Plot |
|---|---|
| CZT HV Monitor | 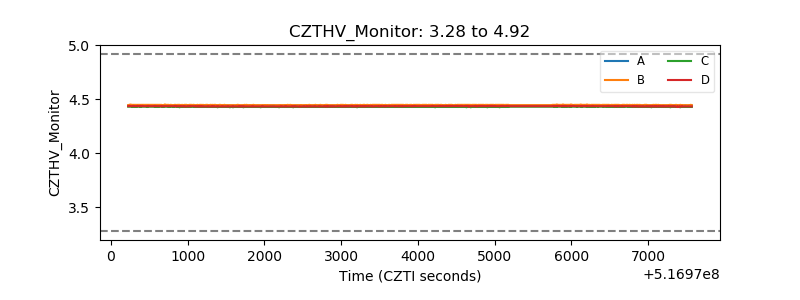 |
| D_VDD | 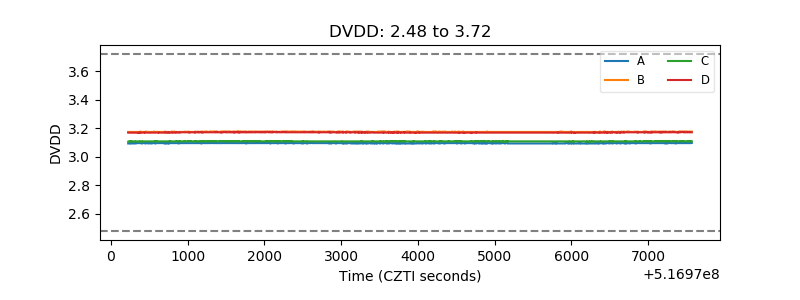 |
| Temperature 1 | 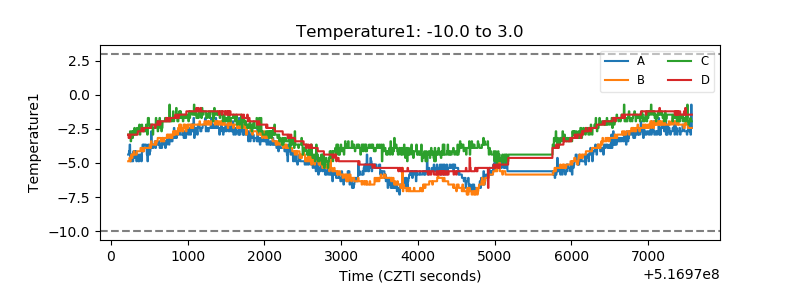 |
| Veto HV Monitor | 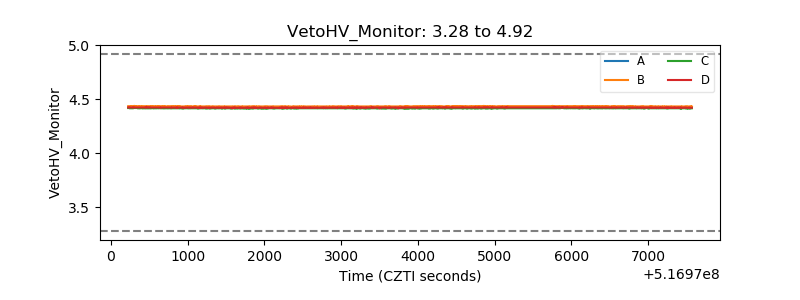 |
| Veto LLD | 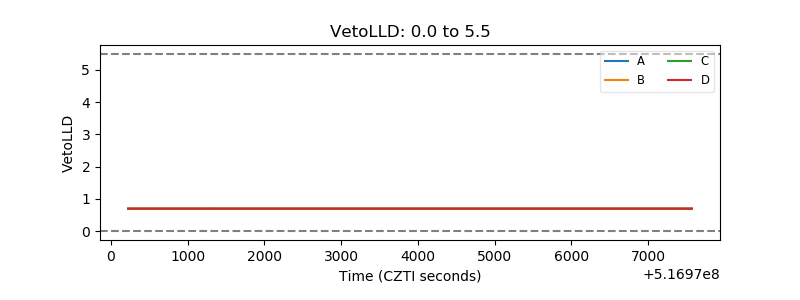 |
| Alpha Counter | 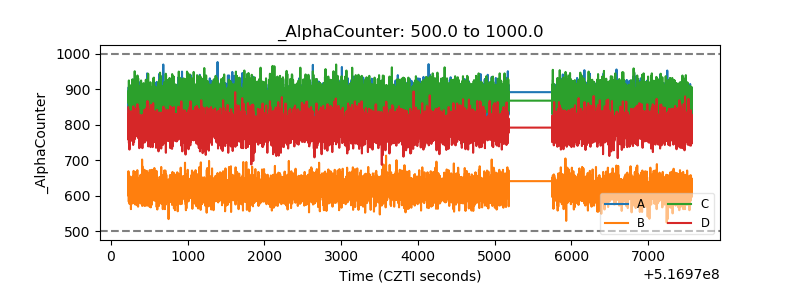 |
| _CPM_Rate | 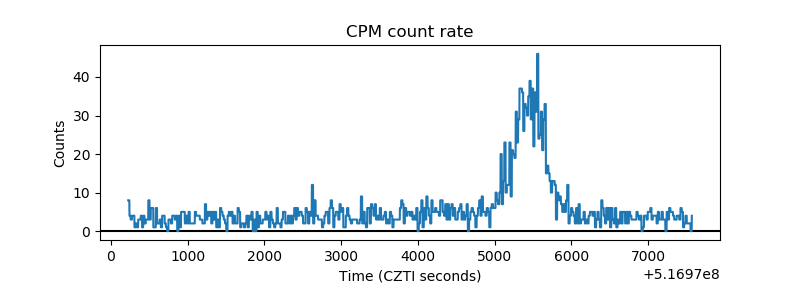 |
| CZT Counter | 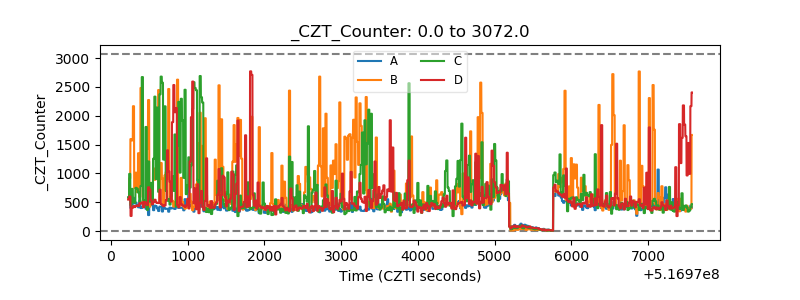 |
| +2.5 Volts monitor | 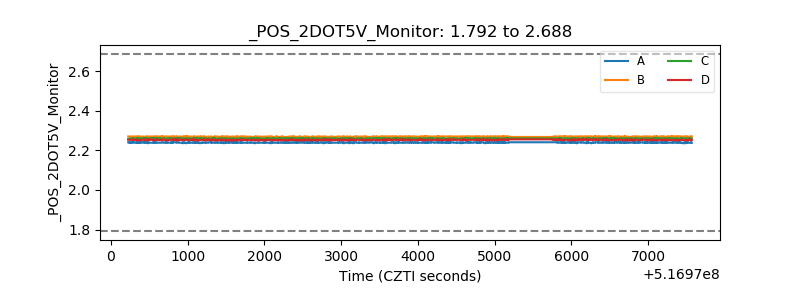 |
| +5 Volts monitor | 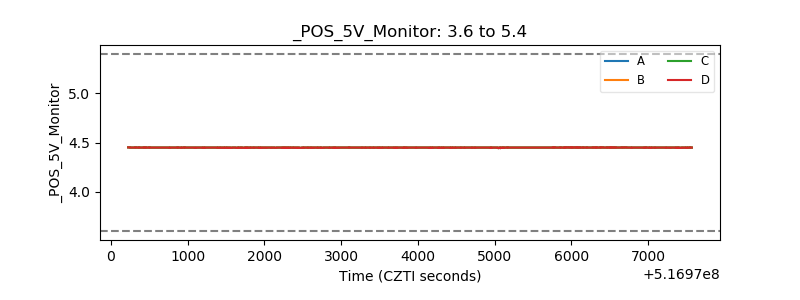 |
| _ROLL_ROT | 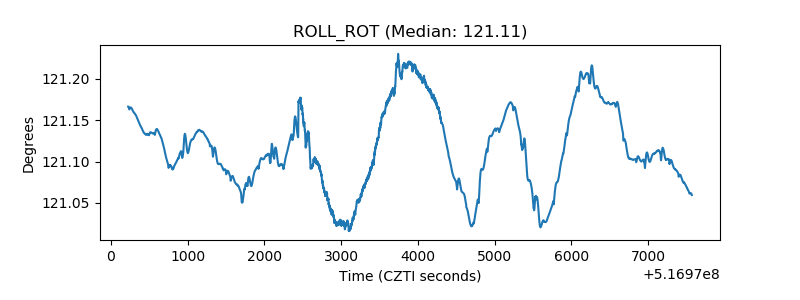 |
| _Roll_DEC | 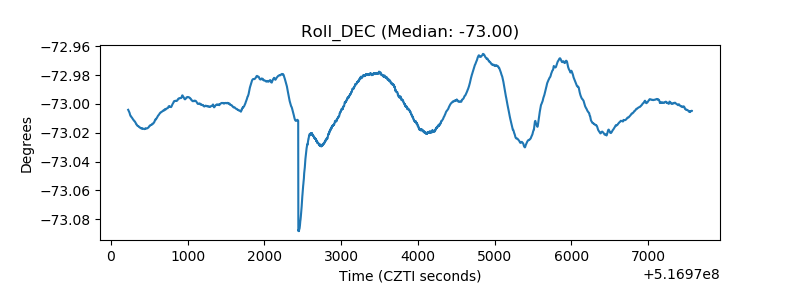 |
| _Roll_RA | 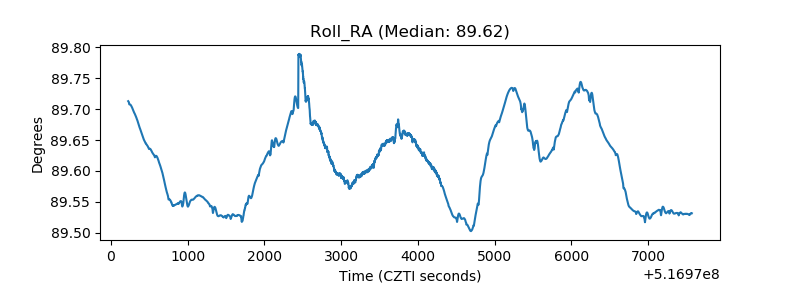 |
| Veto Counter | 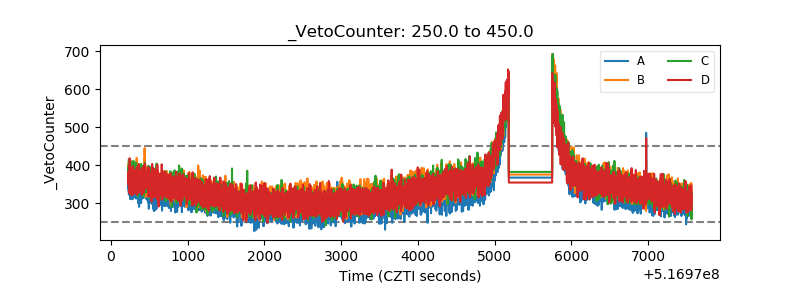 |