| Param | Original file | Final file |
|---|---|---|
| Filename | modeM0/AS1A14_070T08_9000006576_57586cztM0_level2.fits | modeM0/AS1A14_070T08_9000006576_57586cztM0_level2_quad_clean.evt |
| Size (bytes) | 539,187,840 | 103,737,600 |
| Size | 514.2 MB | 98.9 MB |
| Events in quadrant A | 3,222,349 | 697,863 |
| Events in quadrant B | 4,216,832 | 730,027 |
| Events in quadrant C | 4,375,215 | 659,405 |
| Events in quadrant D | 7,576,289 | 544,543 |
| Mode M0 | |||
|---|---|---|---|
| Quadrant | BADHDUFLAG | Total packets | Discarded packets |
| A | 0 | 15241 | 1 |
| B | 0 | 17696 | 1 |
| C | 0 | 18328 | 1 |
| D | 0 | 27534 | 1 |
| Mode SS | |||
|---|---|---|---|
| Quadrant | BADHDUFLAG | Total packets | Discarded packets |
| A | 0 | 146 | 0 |
| B | 0 | 146 | 0 |
| C | 0 | 146 | 0 |
| D | 0 | 146 | 0 |
| Quadrant | Total seconds | Saturated seconds | Saturation percentage |
|---|---|---|---|
| A | 7317 | 84 | 1.148011% |
| B | 7317 | 318 | 4.346043% |
| C | 7316 | 232 | 3.171132% |
| D | 7317 | 1191 | 16.277163% |
Noise dominated data is calculated using 1-second bins in cleaned event files. If a bin has >2000 counts, and if more than 50% of those come from <1% of pixels, then it is considered to be noise-dominated and hence unusable.
| Quadrant | # 1 sec bins | Bins with >0 counts | Bins with >2000 counts | High rate bins dominated by noise | Noise dominated (total time) | Noise dominated (detector-on time) | Marked lightcurve |
|---|---|---|---|---|---|---|---|
| A | 7332 | 7318 | 15 | 15 | 0.20% | 0.20% | 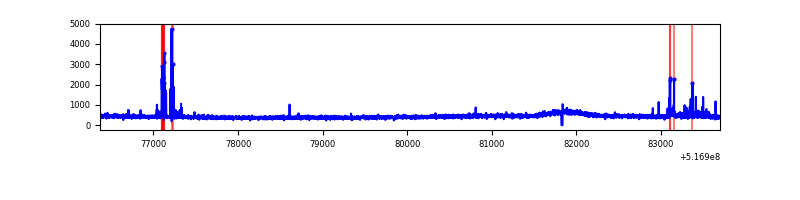 |
| B | 7332 | 7318 | 162 | 162 | 2.21% | 2.21% | 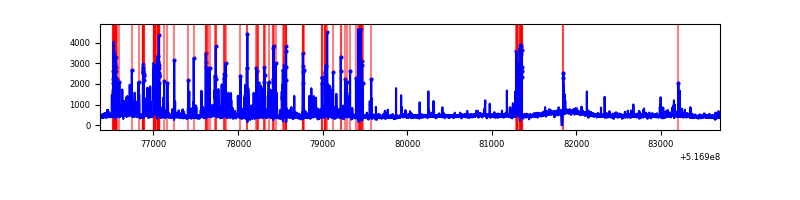 |
| C | 7331 | 7317 | 160 | 160 | 2.18% | 2.19% | 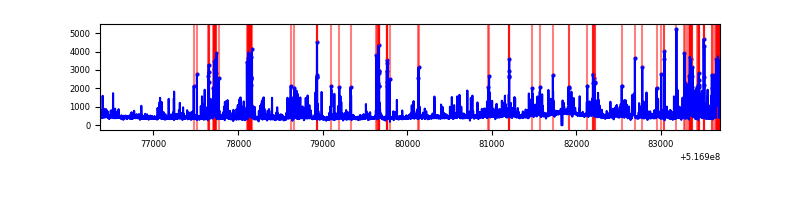 |
| D | 7332 | 7318 | 1173 | 1173 | 16.00% | 16.03% | 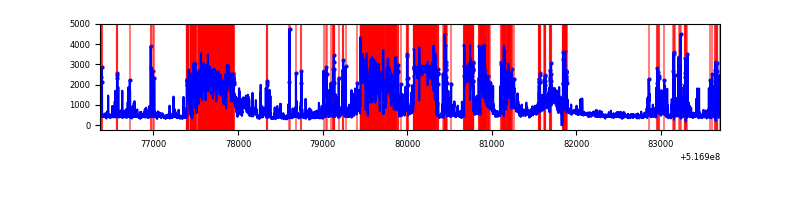 |
Top three noisy pixels from each quadrant. If the there are fewer than three noisy pixels in the level2.evt file, extra rows are filled as -1
| Pixel properties | Quadrant properties | ||||||
|---|---|---|---|---|---|---|---|
| Quadrant | DetID | PixID | Counts | Sigma | Mean | Median | Sigma |
| A | 7 | 160 | 86624 | 438.82 | 793 | 772 | 195.6 |
| A | 4 | 249 | 44908 | 225.6 | 793 | 772 | 195.6 |
| A | 3 | 14 | 15953 | 77.6 | 793 | 772 | 195.6 |
| B | 2 | 249 | 815211 | 4957.52 | 771 | 741 | 164.3 |
| B | 10 | 247 | 78900 | 475.74 | 771 | 741 | 164.3 |
| B | 5 | 185 | 65664 | 395.17 | 771 | 741 | 164.3 |
| C | 15 | 224 | 1003167 | 4854.72 | 760 | 753 | 206.5 |
| C | 12 | 254 | 150138 | 723.48 | 760 | 753 | 206.5 |
| C | 14 | 254 | 112833 | 542.81 | 760 | 753 | 206.5 |
| D | 15 | 142 | 1991200 | 9775.18 | 715 | 680 | 203.6 |
| D | 8 | 240 | 1821481 | 8941.71 | 715 | 680 | 203.6 |
| D | 2 | 249 | 222725 | 1090.43 | 715 | 680 | 203.6 |
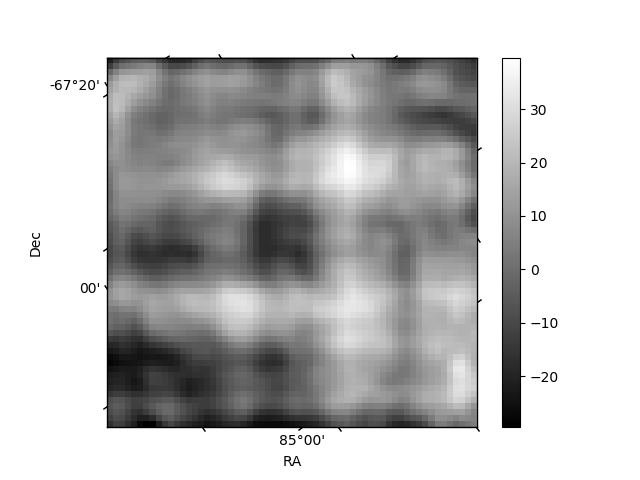
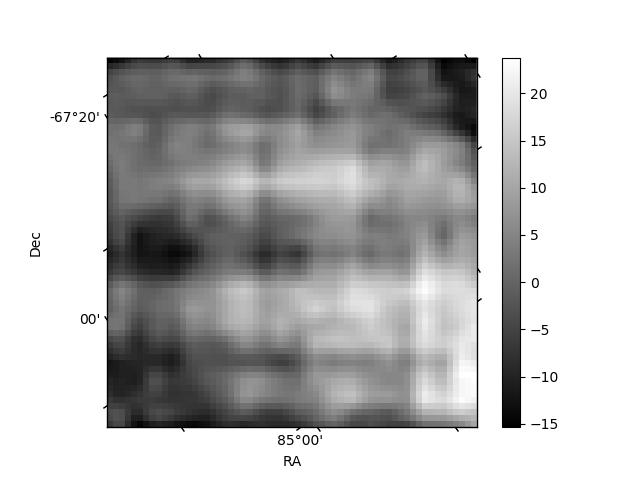
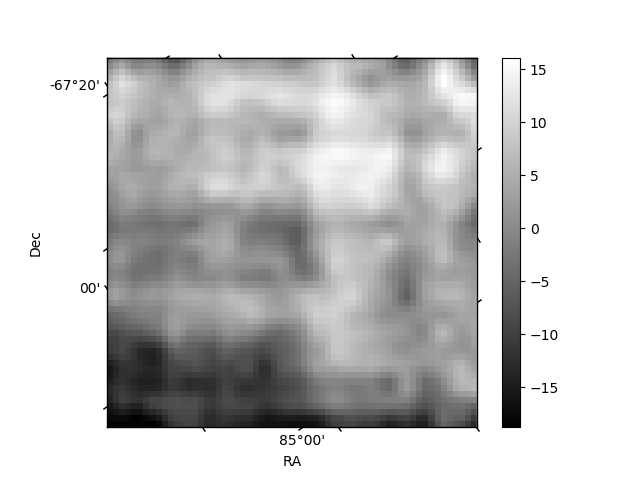
Histogram calculated using DETX and DETY for each event in the final _common_clean file
| Quadrant A | 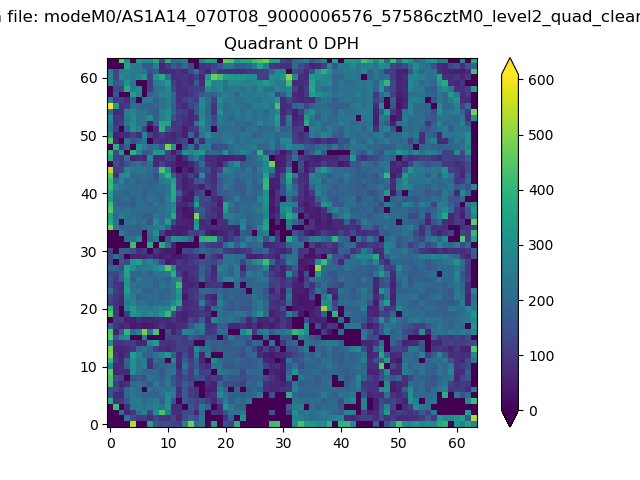 |
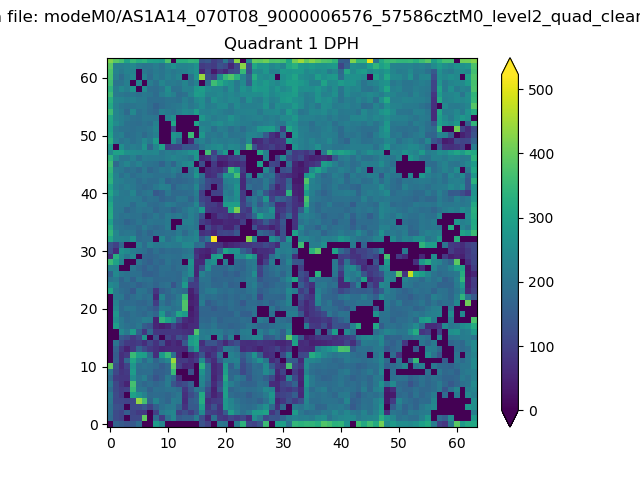 |
Quadrant B |
|---|---|---|---|
| Quadrant D | 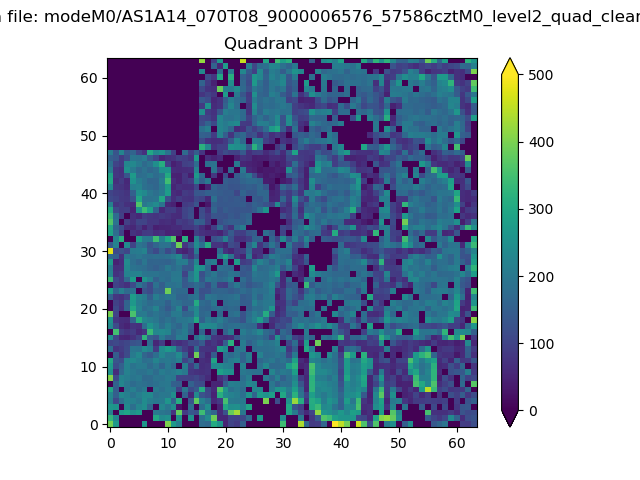 |
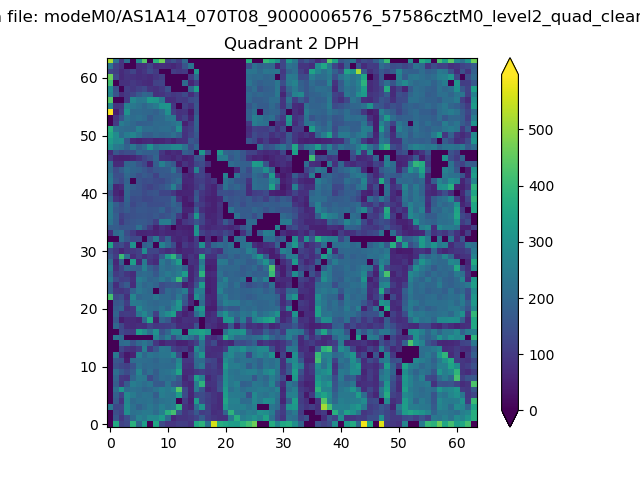 |
Quadrant C |
| Plot type | Count rate plots | Images |
|---|---|---|
| Comparison with Poisson distribution Blue bars denote a histogram of data divided into 1 sec bins. Red curve is a Poisson curve with rate = median count rate of data. |
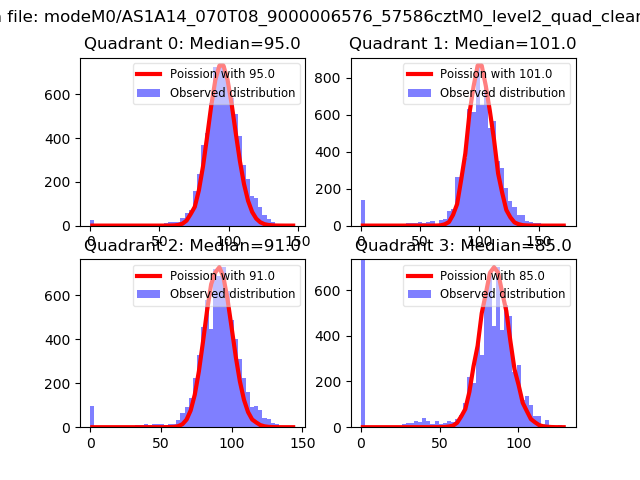 |
 |
| Quadrant-wise count rates Data is divided into 100 sec bins |
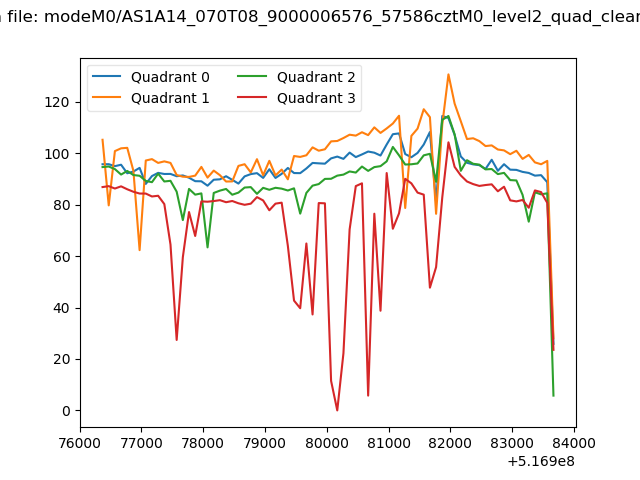 |
|
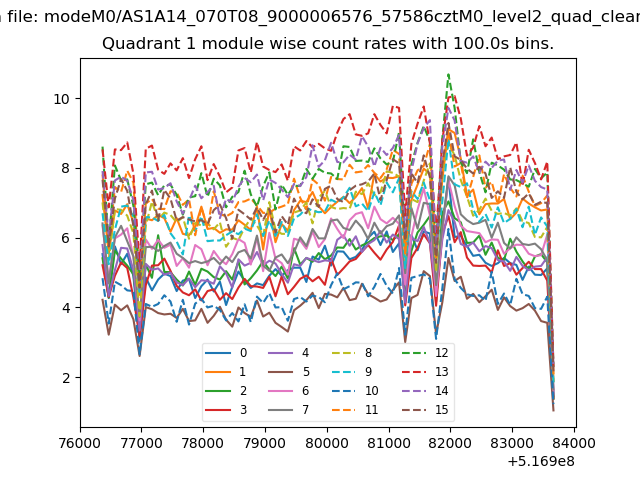
| Module-wise count rates for Quadrant A Data is divided into 100 sec bins |
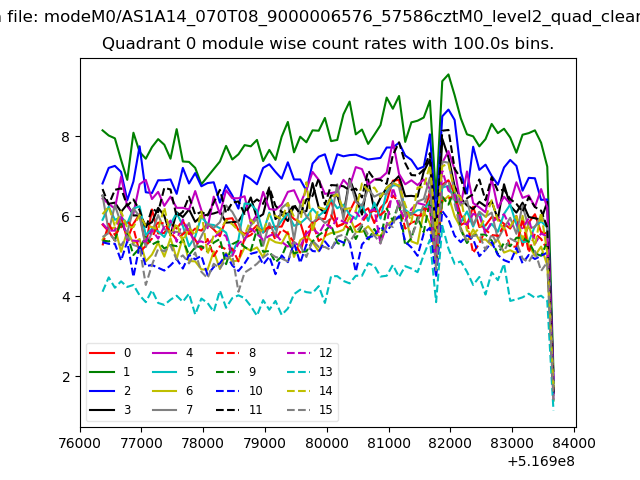 |
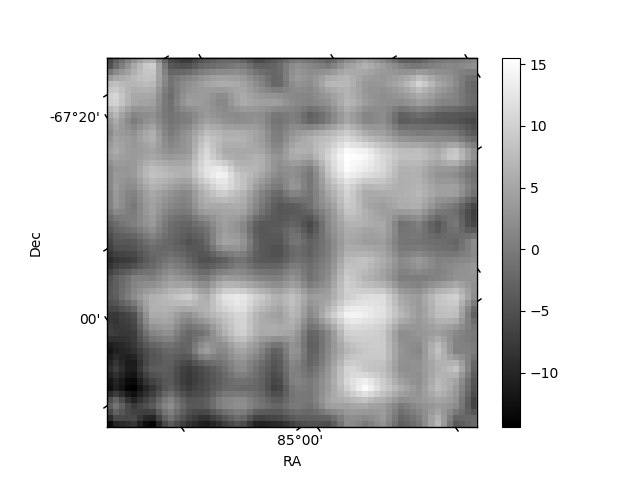 |
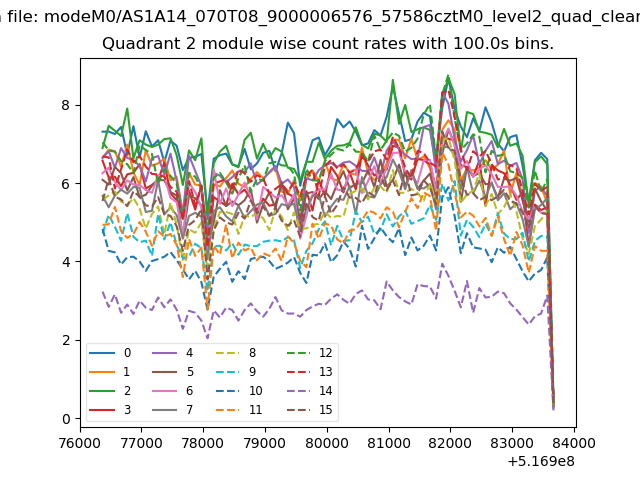
| Module-wise count rates for Quadrant B Data is divided into 100 sec bins |
 |
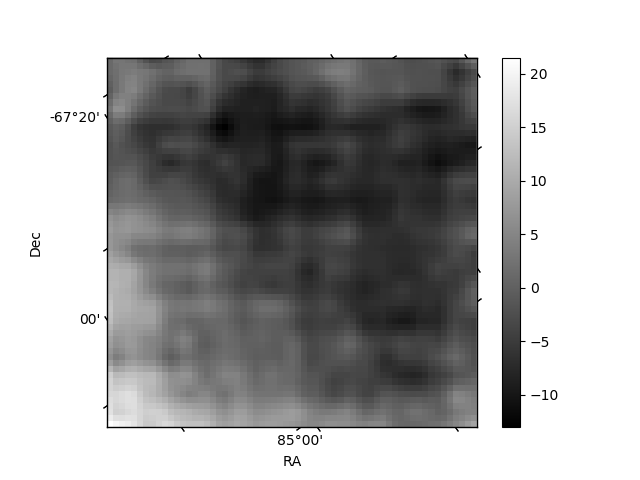 |
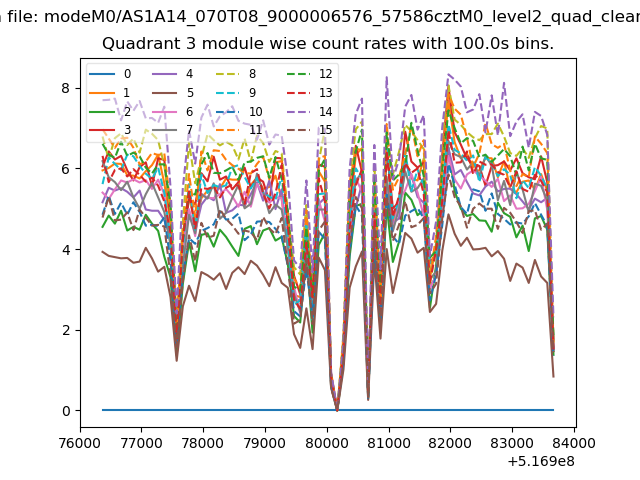
| Module-wise count rates for Quadrant C Data is divided into 100 sec bins |
 |
 |
| Module-wise count rates for Quadrant D Data is divided into 100 sec bins |
 |
 |
| Parameter | Plot |
|---|---|
| CZT HV Monitor | 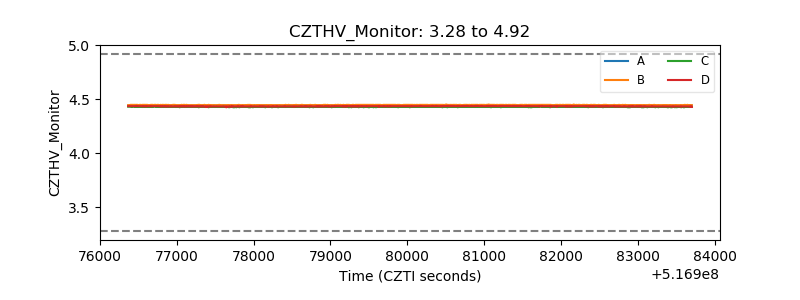 |
| D_VDD | 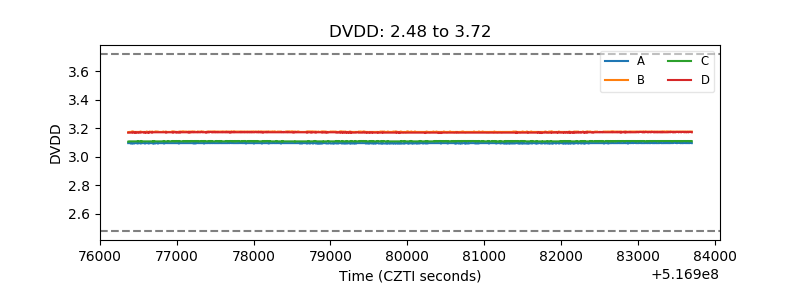 |
| Temperature 1 | 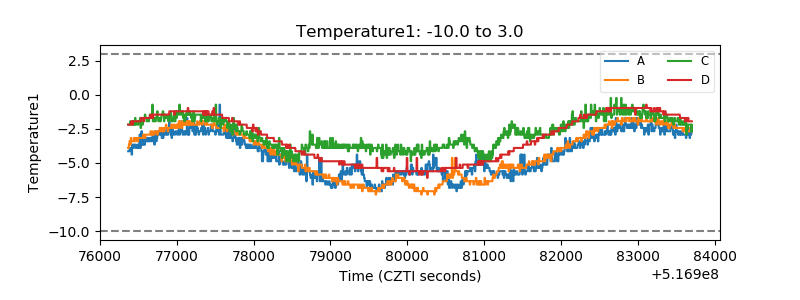 |
| Veto HV Monitor | 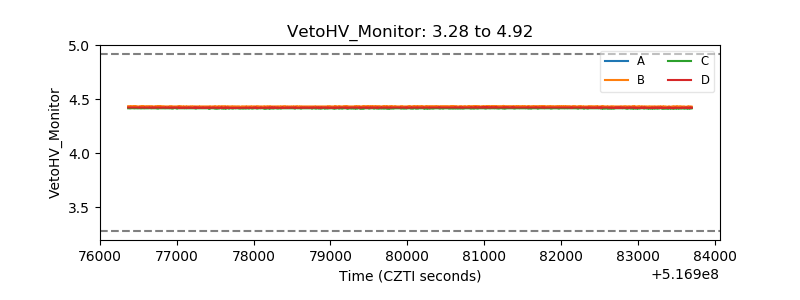 |
| Veto LLD | 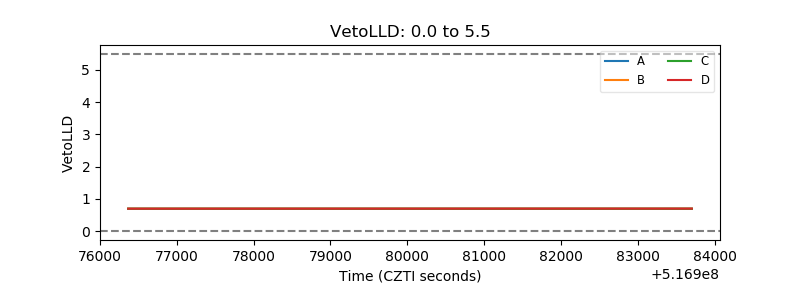 |
| Alpha Counter | 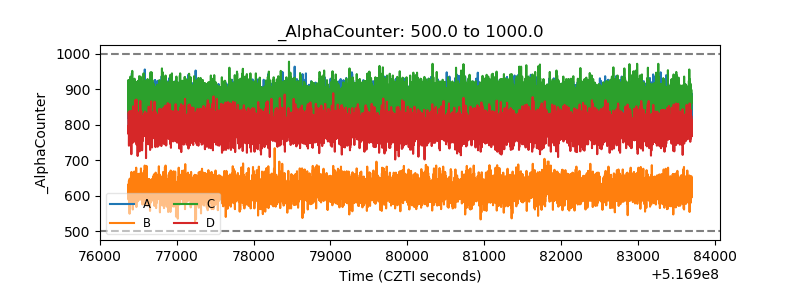 |
| _CPM_Rate | 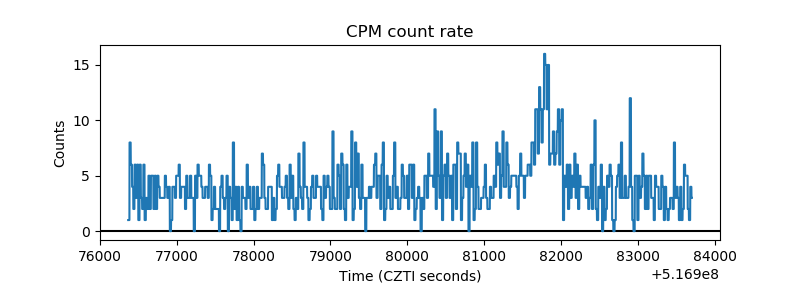 |
| CZT Counter | 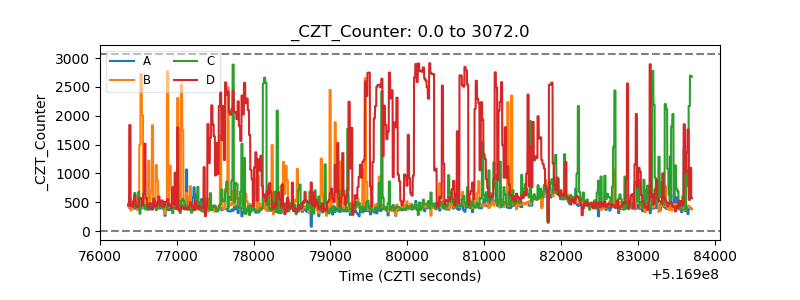 |
| +2.5 Volts monitor | 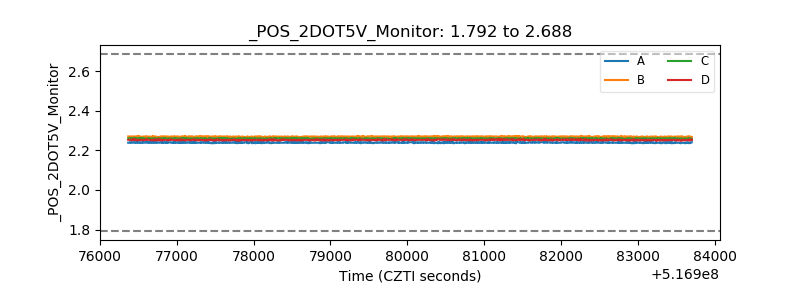 |
| +5 Volts monitor | 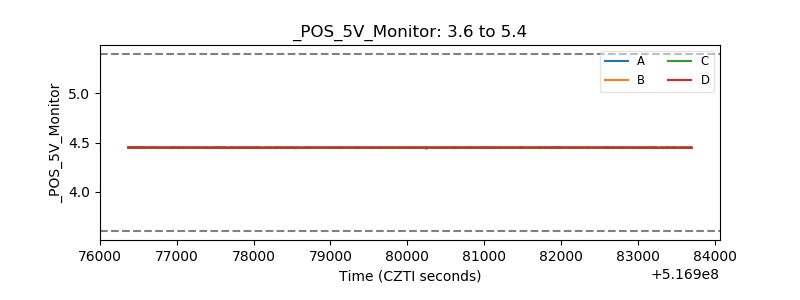 |
| _ROLL_ROT | 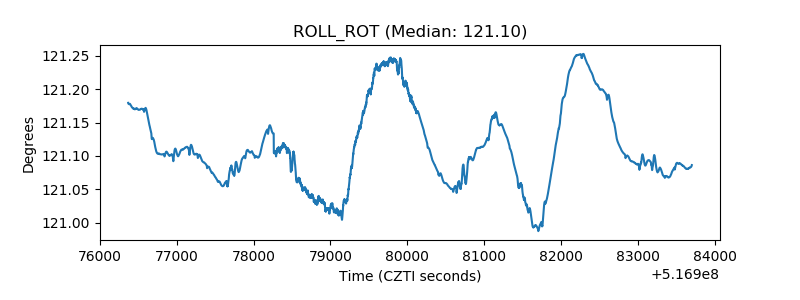 |
| _Roll_DEC | 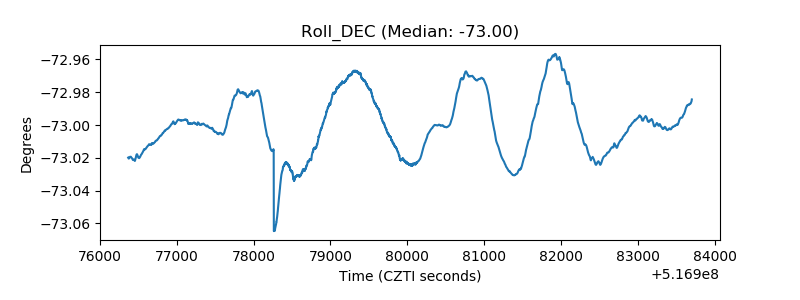 |
| _Roll_RA | 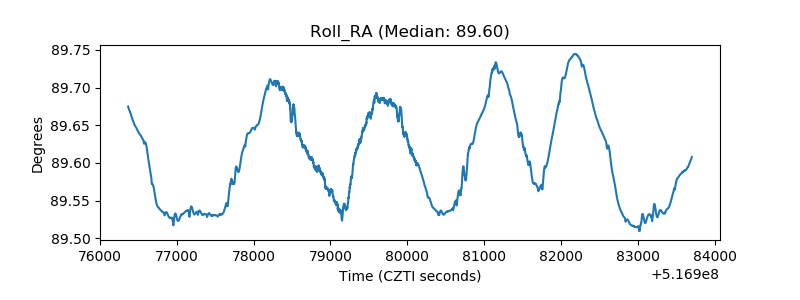 |
| Veto Counter | 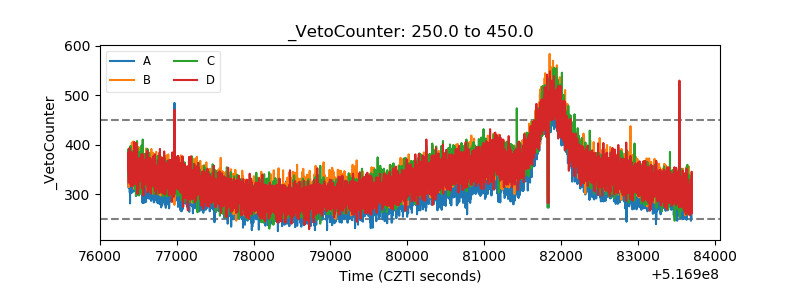 |