| Param | Original file | Final file |
|---|---|---|
| Filename | modeM0/AS1A14_070T08_9000006576_57587cztM0_level2.fits | modeM0/AS1A14_070T08_9000006576_57587cztM0_level2_quad_clean.evt |
| Size (bytes) | 541,382,400 | 107,184,960 |
| Size | 516.3 MB | 102.2 MB |
| Events in quadrant A | 3,349,773 | 716,129 |
| Events in quadrant B | 6,048,861 | 711,402 |
| Events in quadrant C | 5,527,668 | 659,370 |
| Events in quadrant D | 4,528,719 | 634,037 |
| Mode M0 | |||
|---|---|---|---|
| Quadrant | BADHDUFLAG | Total packets | Discarded packets |
| A | 0 | 15481 | 0 |
| B | 0 | 23222 | 0 |
| C | 0 | 21665 | 0 |
| D | 0 | 18636 | 5 |
| Mode SS | |||
|---|---|---|---|
| Quadrant | BADHDUFLAG | Total packets | Discarded packets |
| A | 0 | 150 | 0 |
| B | 0 | 150 | 0 |
| C | 0 | 150 | 0 |
| D | 0 | 150 | 0 |
| Quadrant | Total seconds | Saturated seconds | Saturation percentage |
|---|---|---|---|
| A | 7536 | 15 | 0.199045% |
| B | 7537 | 759 | 10.070320% |
| C | 7537 | 407 | 5.400027% |
| D | 7536 | 208 | 2.760085% |
Noise dominated data is calculated using 1-second bins in cleaned event files. If a bin has >2000 counts, and if more than 50% of those come from <1% of pixels, then it is considered to be noise-dominated and hence unusable.
| Quadrant | # 1 sec bins | Bins with >0 counts | Bins with >2000 counts | High rate bins dominated by noise | Noise dominated (total time) | Noise dominated (detector-on time) | Marked lightcurve |
|---|---|---|---|---|---|---|---|
| A | 7536 | 7536 | 7 | 7 | 0.09% | 0.09% | 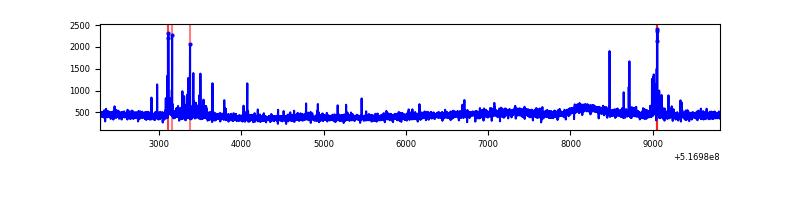 |
| B | 7537 | 7537 | 453 | 453 | 6.01% | 6.01% | 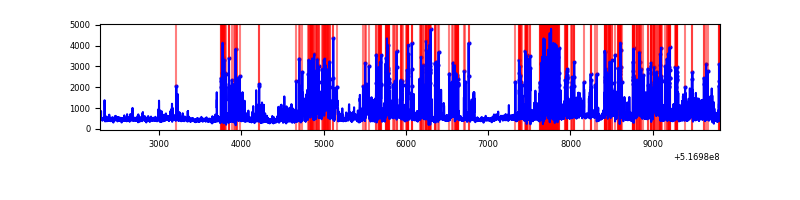 |
| C | 7537 | 7537 | 356 | 356 | 4.72% | 4.72% | 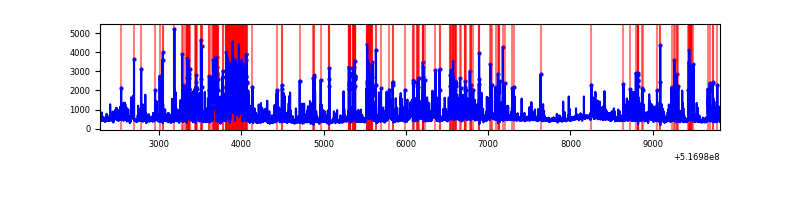 |
| D | 7536 | 7536 | 156 | 156 | 2.07% | 2.07% | 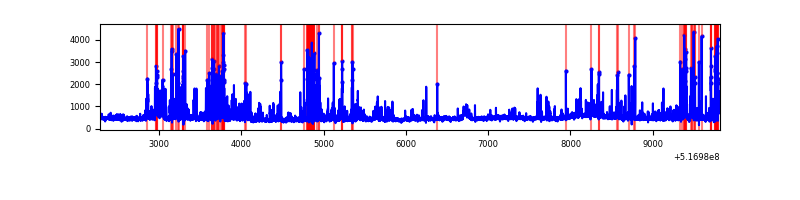 |
Top three noisy pixels from each quadrant. If the there are fewer than three noisy pixels in the level2.evt file, extra rows are filled as -1
| Pixel properties | Quadrant properties | ||||||
|---|---|---|---|---|---|---|---|
| Quadrant | DetID | PixID | Counts | Sigma | Mean | Median | Sigma |
| A | 4 | 249 | 79125 | 392.6 | 810 | 789 | 199.5 |
| A | 3 | 14 | 69888 | 346.31 | 810 | 789 | 199.5 |
| A | 7 | 160 | 28446 | 138.61 | 810 | 789 | 199.5 |
| B | 2 | 249 | 2590524 | 15852.26 | 771 | 743 | 163.4 |
| B | 5 | 185 | 158815 | 967.57 | 771 | 743 | 163.4 |
| B | 0 | 245 | 98025 | 595.47 | 771 | 743 | 163.4 |
| C | 15 | 224 | 2154428 | 10424.41 | 765 | 759 | 206.6 |
| C | 14 | 254 | 104775 | 503.47 | 765 | 759 | 206.6 |
| C | 12 | 254 | 93302 | 447.94 | 765 | 759 | 206.6 |
| D | 2 | 249 | 466679 | 2138.27 | 774 | 738 | 217.9 |
| D | 3 | 224 | 297234 | 1360.66 | 774 | 738 | 217.9 |
| D | 3 | 12 | 131481 | 600.0 | 774 | 738 | 217.9 |
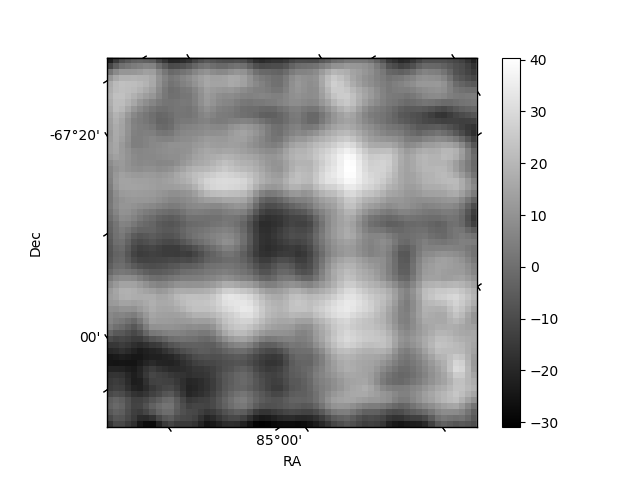
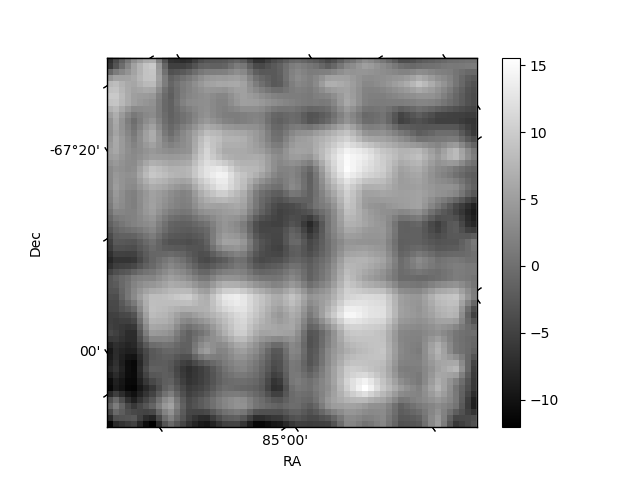
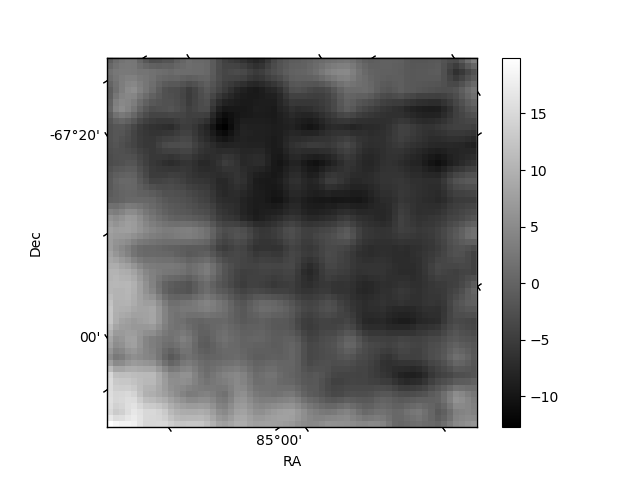
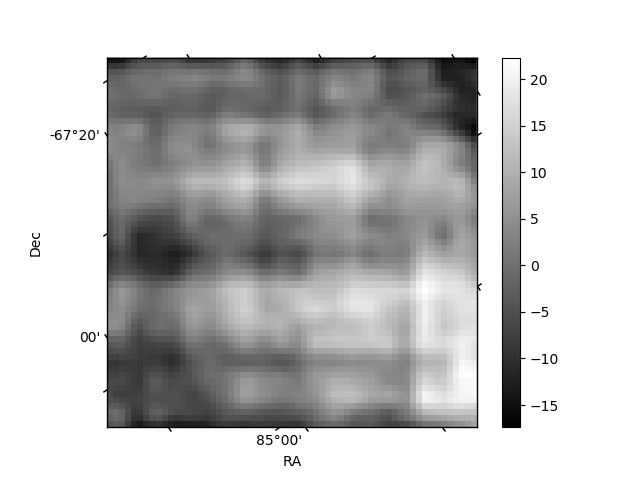
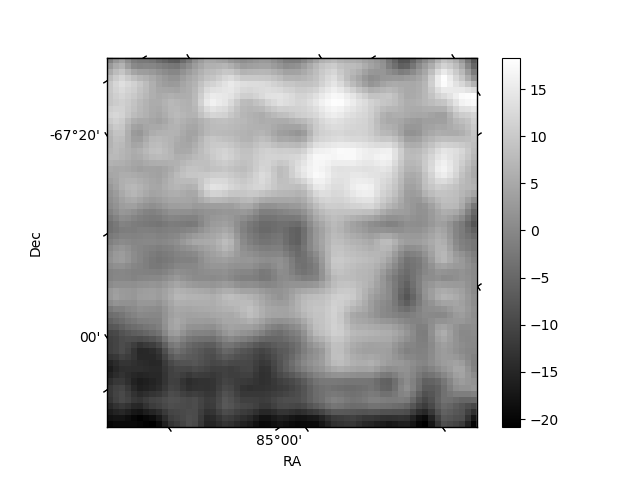
Histogram calculated using DETX and DETY for each event in the final _common_clean file
| Quadrant A | 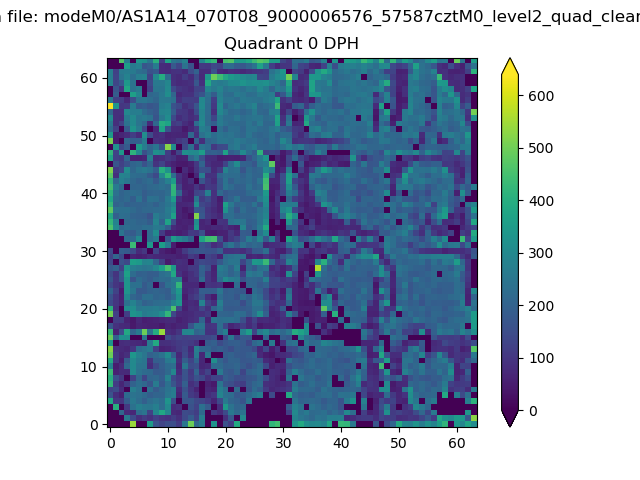 |
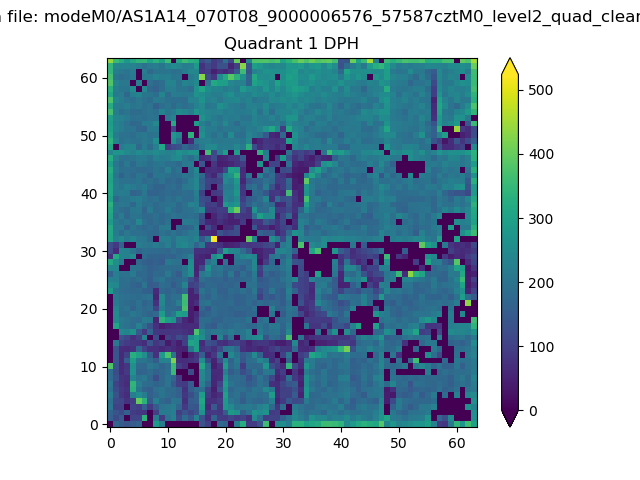 |
Quadrant B |
|---|---|---|---|
| Quadrant D | 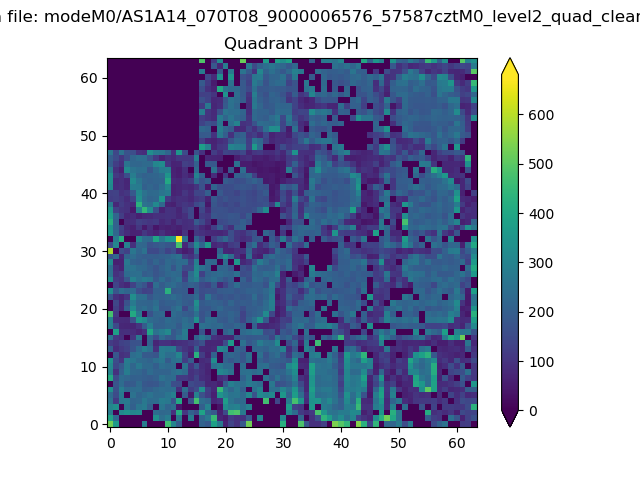 |
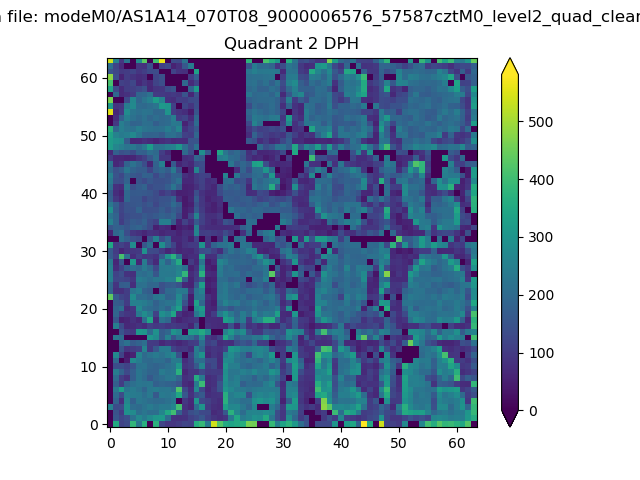 |
Quadrant C |
| Plot type | Count rate plots | Images |
|---|---|---|
| Comparison with Poisson distribution Blue bars denote a histogram of data divided into 1 sec bins. Red curve is a Poisson curve with rate = median count rate of data. |
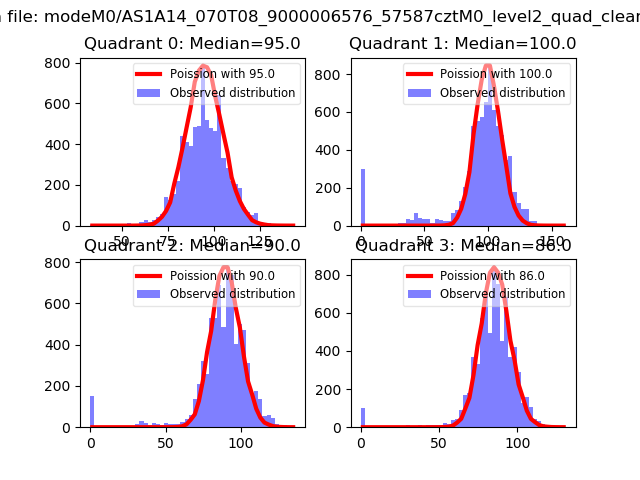 |
 |
| Quadrant-wise count rates Data is divided into 100 sec bins |
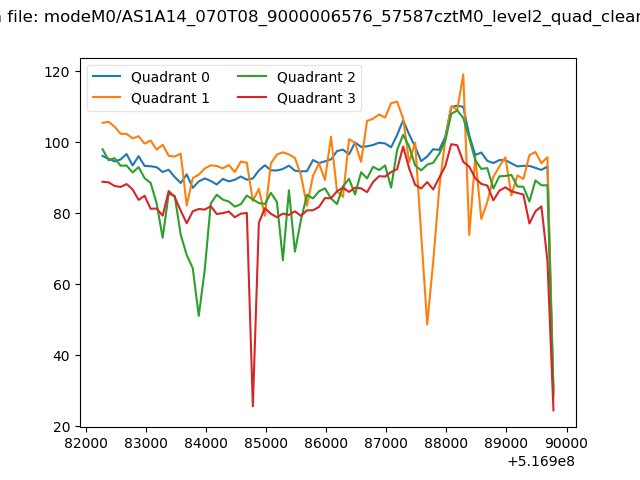 |
|
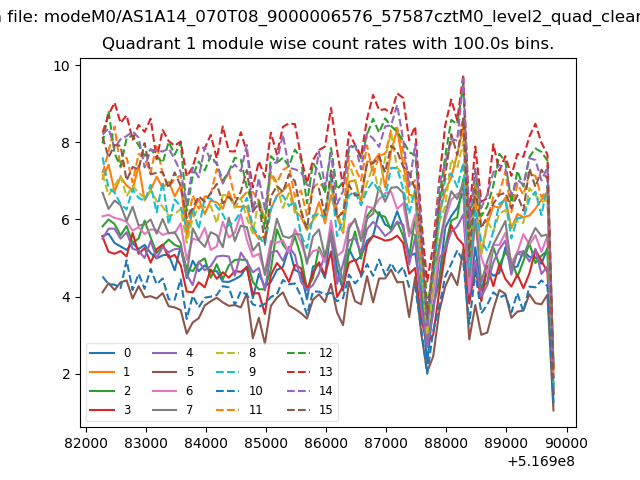
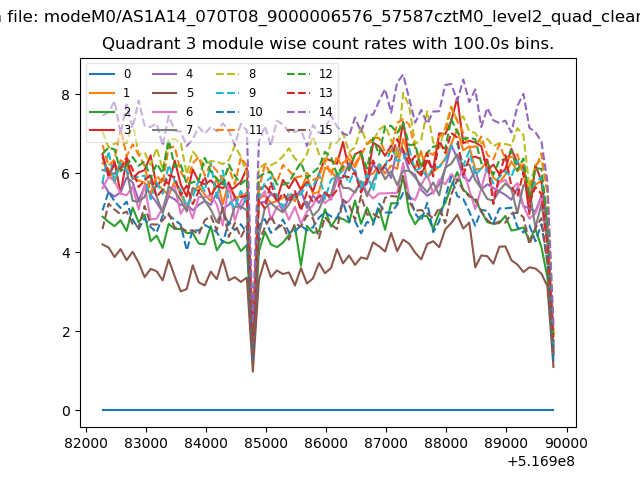
| Module-wise count rates for Quadrant A Data is divided into 100 sec bins |
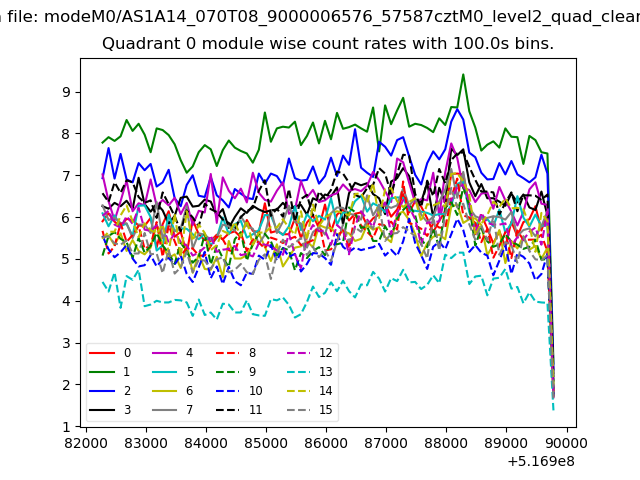 |
 |
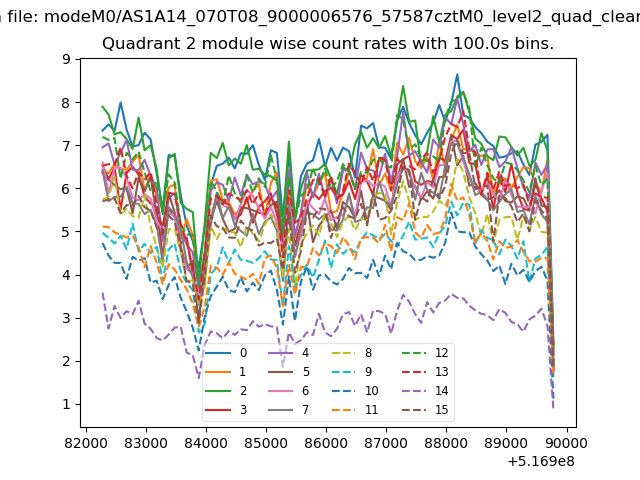
| Module-wise count rates for Quadrant B Data is divided into 100 sec bins |
 |
 |
| Module-wise count rates for Quadrant C Data is divided into 100 sec bins |
 |
 |
| Module-wise count rates for Quadrant D Data is divided into 100 sec bins |
 |
 |
| Parameter | Plot |
|---|---|
| CZT HV Monitor | 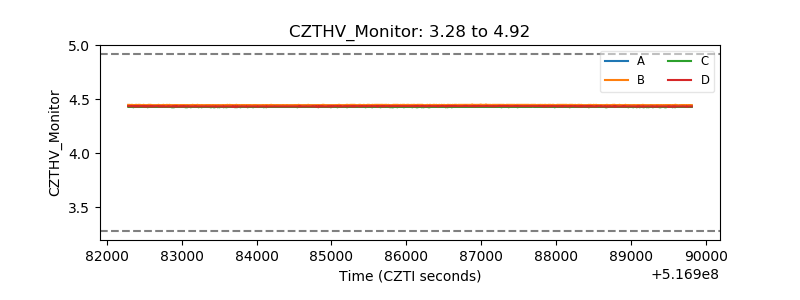 |
| D_VDD | 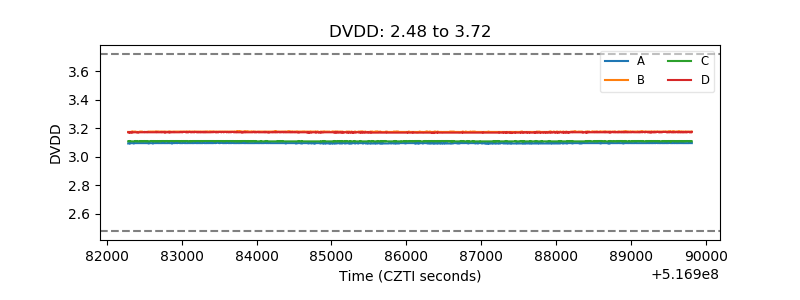 |
| Temperature 1 | 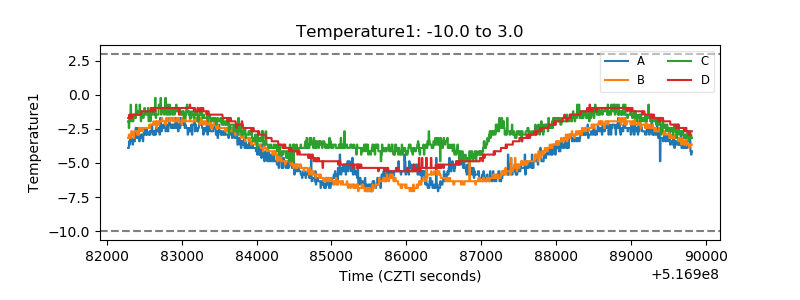 |
| Veto HV Monitor | 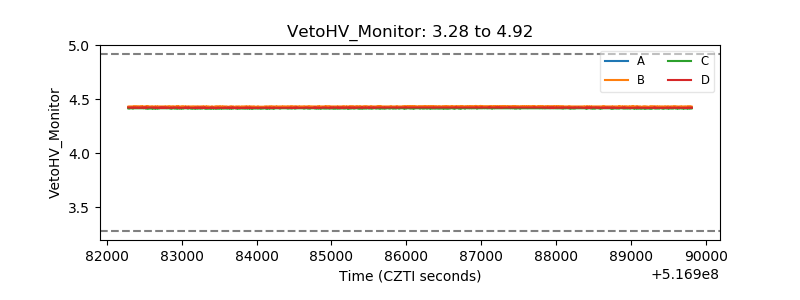 |
| Veto LLD | 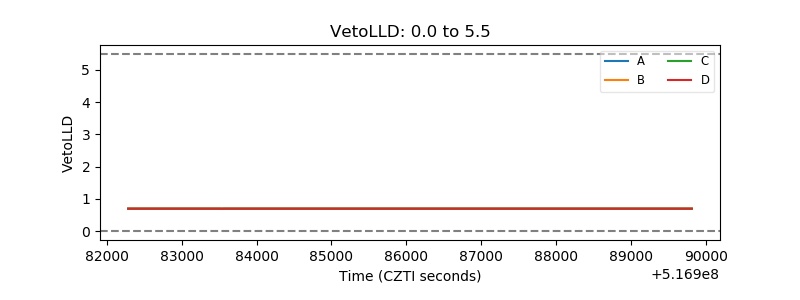 |
| Alpha Counter | 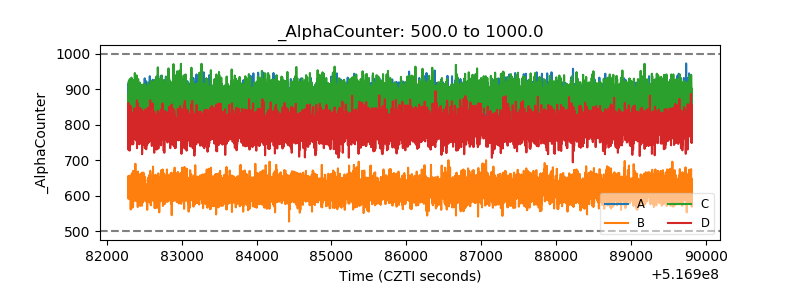 |
| _CPM_Rate | 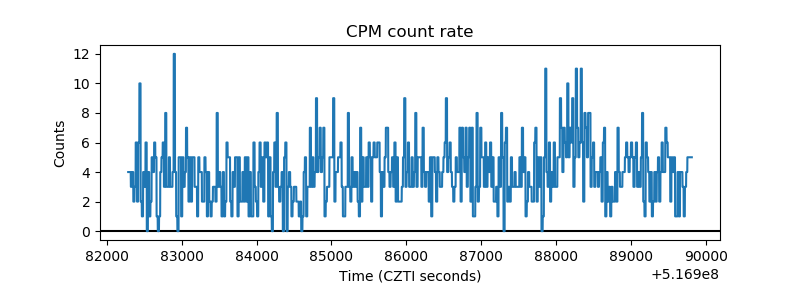 |
| CZT Counter | 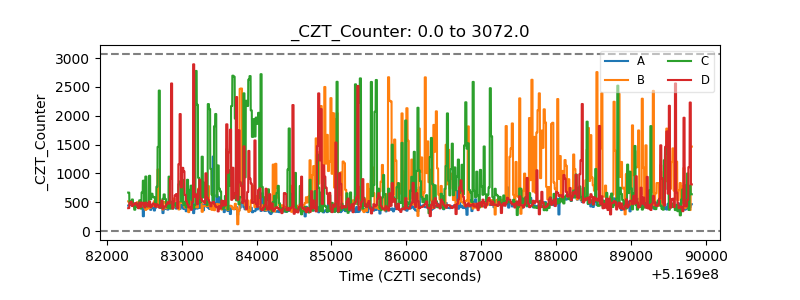 |
| +2.5 Volts monitor | 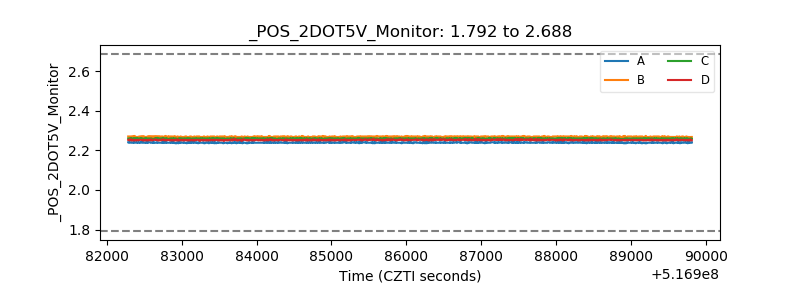 |
| +5 Volts monitor | 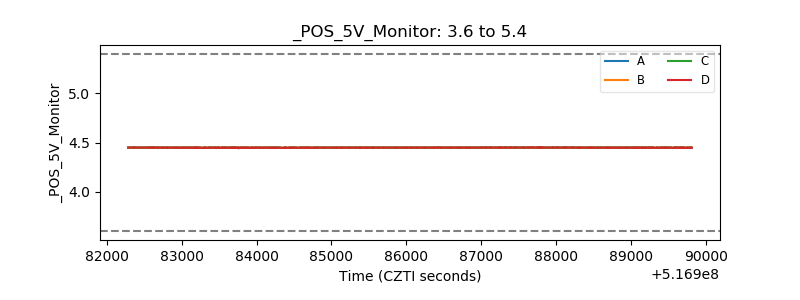 |
| _ROLL_ROT | 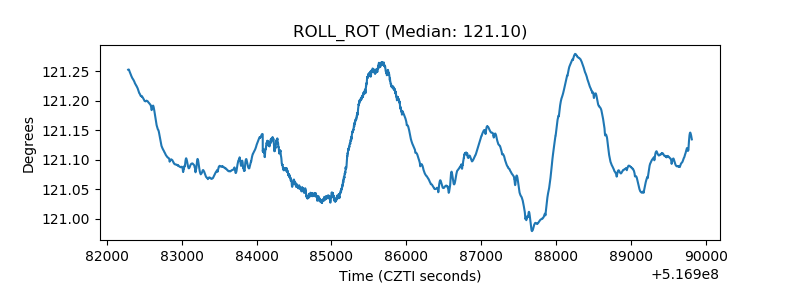 |
| _Roll_DEC | 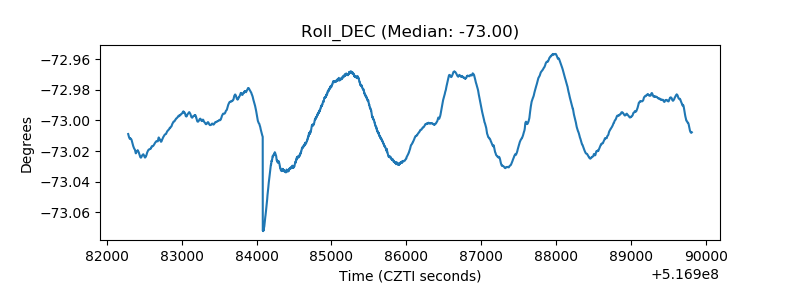 |
| _Roll_RA | 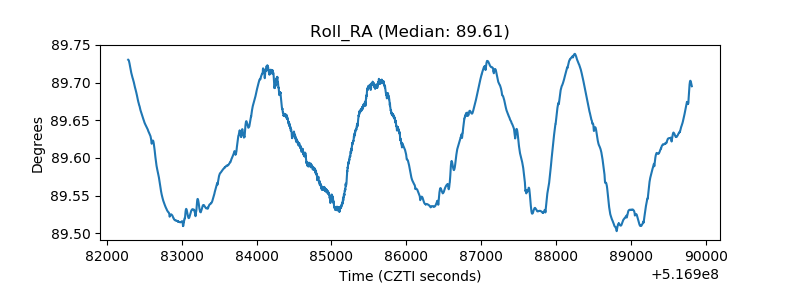 |
| Veto Counter | 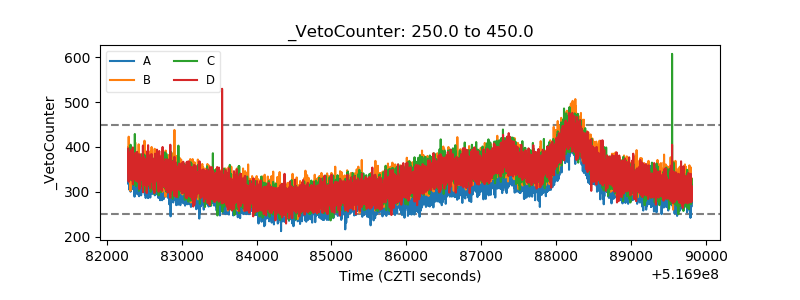 |