| Param | Original file | Final file |
|---|---|---|
| Filename | modeM0/AS1A14_070T08_9000006576_57588cztM0_level2.fits | modeM0/AS1A14_070T08_9000006576_57588cztM0_level2_quad_clean.evt |
| Size (bytes) | 545,797,440 | 112,651,200 |
| Size | 520.5 MB | 107.4 MB |
| Events in quadrant A | 3,899,461 | 747,484 |
| Events in quadrant B | 5,558,398 | 762,501 |
| Events in quadrant C | 5,461,545 | 688,781 |
| Events in quadrant D | 4,675,200 | 666,685 |
| Mode M0 | |||
|---|---|---|---|
| Quadrant | BADHDUFLAG | Total packets | Discarded packets |
| A | 0 | 17135 | 0 |
| B | 0 | 21981 | 0 |
| C | 0 | 21785 | 0 |
| D | 0 | 19170 | 0 |
| Mode SS | |||
|---|---|---|---|
| Quadrant | BADHDUFLAG | Total packets | Discarded packets |
| A | 0 | 156 | 0 |
| B | 0 | 156 | 0 |
| C | 0 | 156 | 0 |
| D | 0 | 156 | 0 |
| Quadrant | Total seconds | Saturated seconds | Saturation percentage |
|---|---|---|---|
| A | 7846 | 78 | 0.994137% |
| B | 7847 | 548 | 6.983561% |
| C | 7847 | 408 | 5.199439% |
| D | 7847 | 184 | 2.344845% |
Noise dominated data is calculated using 1-second bins in cleaned event files. If a bin has >2000 counts, and if more than 50% of those come from <1% of pixels, then it is considered to be noise-dominated and hence unusable.
| Quadrant | # 1 sec bins | Bins with >0 counts | Bins with >2000 counts | High rate bins dominated by noise | Noise dominated (total time) | Noise dominated (detector-on time) | Marked lightcurve |
|---|---|---|---|---|---|---|---|
| A | 7846 | 7846 | 55 | 55 | 0.70% | 0.70% | 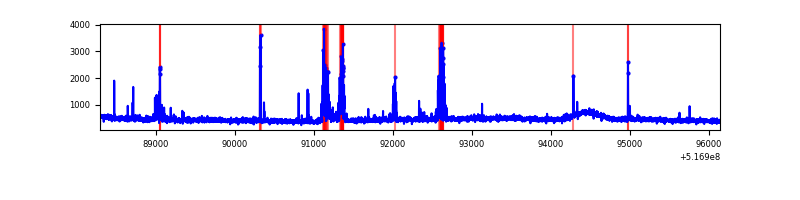 |
| B | 7847 | 7847 | 330 | 330 | 4.21% | 4.21% | 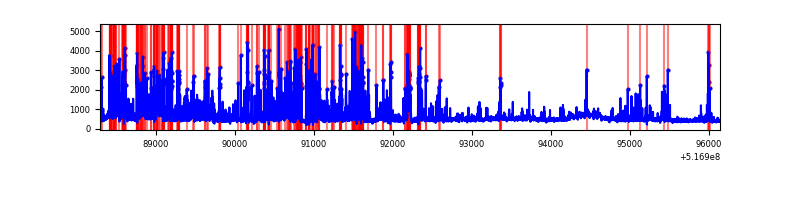 |
| C | 7847 | 7847 | 342 | 342 | 4.36% | 4.36% | 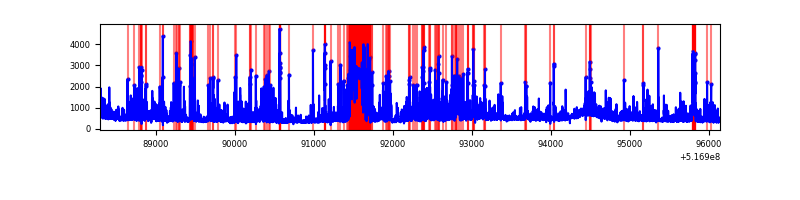 |
| D | 7847 | 7847 | 157 | 157 | 2.00% | 2.00% | 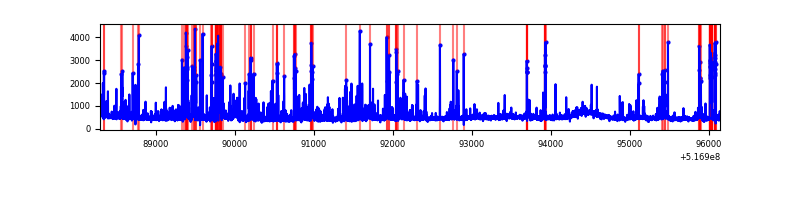 |
Top three noisy pixels from each quadrant. If the there are fewer than three noisy pixels in the level2.evt file, extra rows are filled as -1
| Pixel properties | Quadrant properties | ||||||
|---|---|---|---|---|---|---|---|
| Quadrant | DetID | PixID | Counts | Sigma | Mean | Median | Sigma |
| A | 10 | 248 | 297155 | 1403.91 | 855 | 833 | 211.1 |
| A | 3 | 14 | 121519 | 571.78 | 855 | 833 | 211.1 |
| A | 4 | 249 | 55812 | 260.48 | 855 | 833 | 211.1 |
| B | 2 | 249 | 1881448 | 10660.28 | 824 | 792 | 176.4 |
| B | 0 | 245 | 150182 | 846.8 | 824 | 792 | 176.4 |
| B | 7 | 252 | 58060 | 324.61 | 824 | 792 | 176.4 |
| C | 15 | 224 | 1993301 | 9110.27 | 808 | 800 | 218.7 |
| C | 14 | 245 | 120012 | 545.07 | 808 | 800 | 218.7 |
| C | 14 | 254 | 99842 | 452.85 | 808 | 800 | 218.7 |
| D | 2 | 249 | 247469 | 1075.22 | 820 | 784 | 229.4 |
| D | 8 | 240 | 212338 | 922.09 | 820 | 784 | 229.4 |
| D | 3 | 224 | 161887 | 702.19 | 820 | 784 | 229.4 |
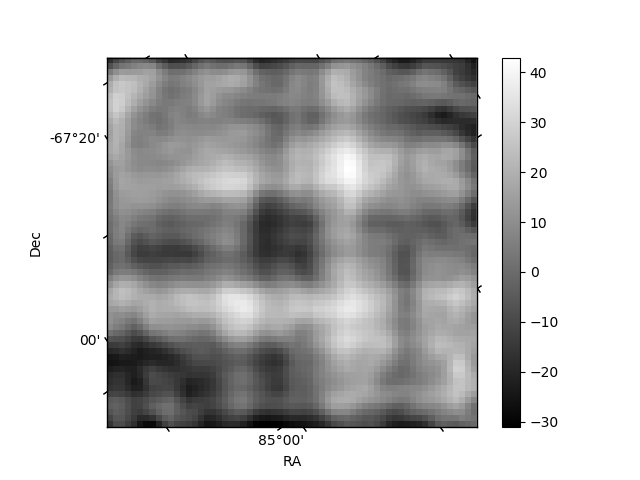
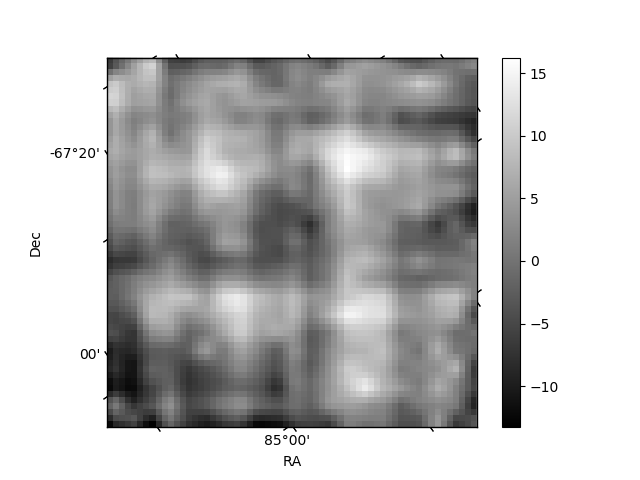
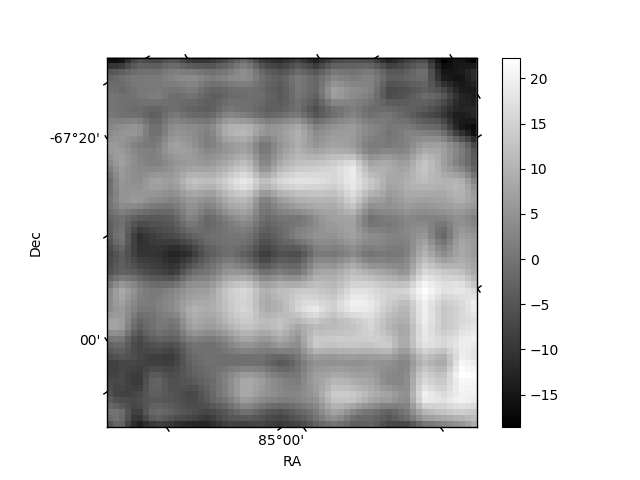
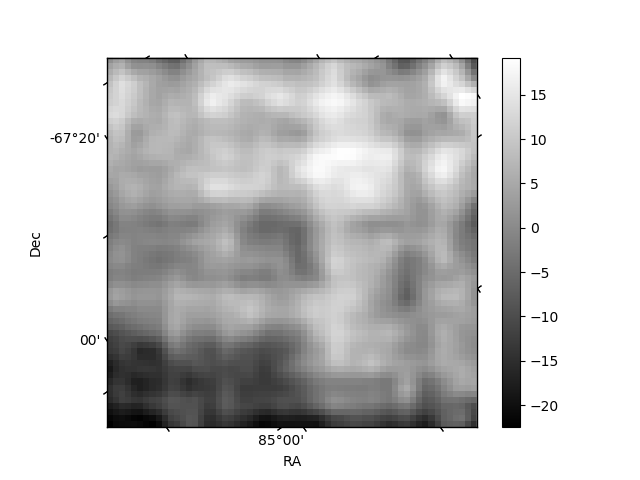
Histogram calculated using DETX and DETY for each event in the final _common_clean file
| Quadrant A | 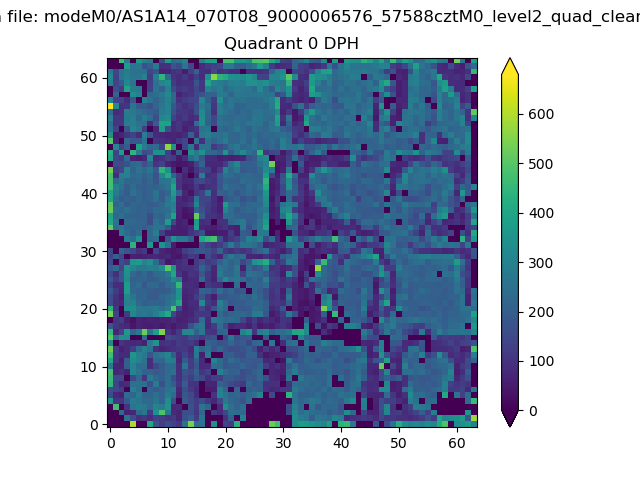 |
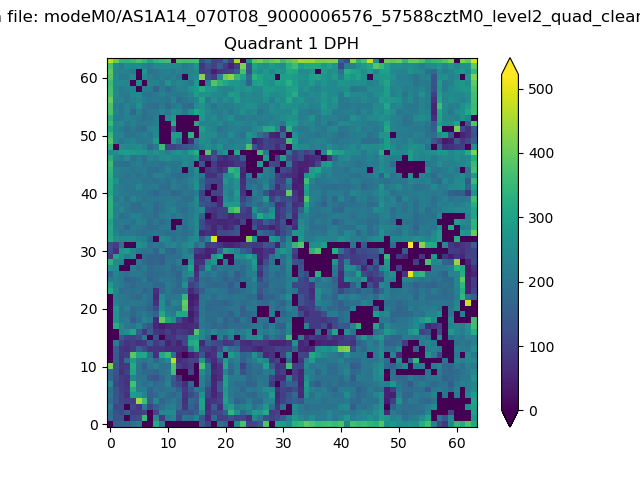 |
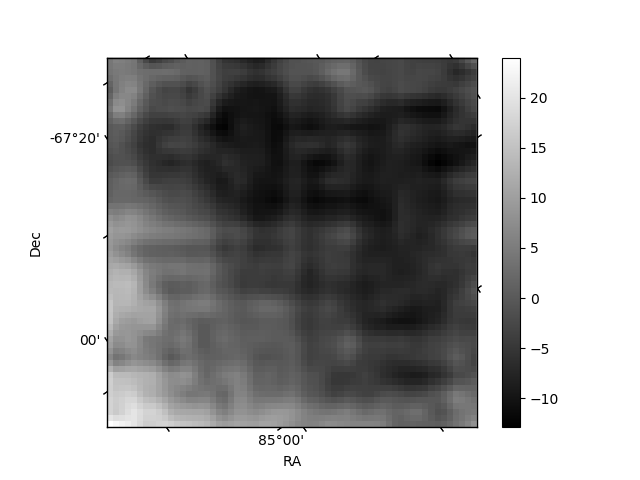
Quadrant B |
|---|---|---|---|
| Quadrant D | 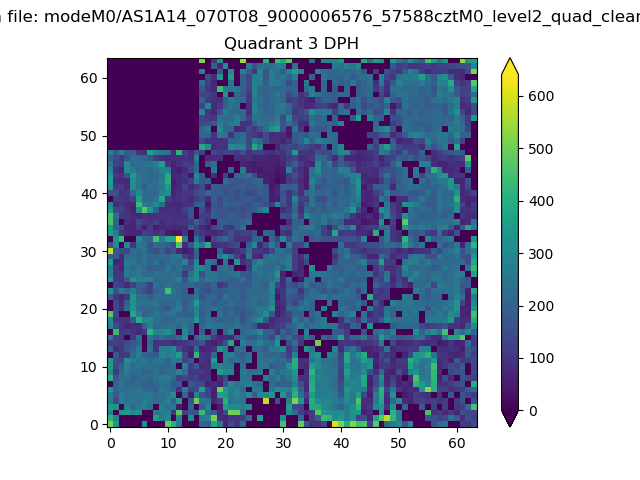 |
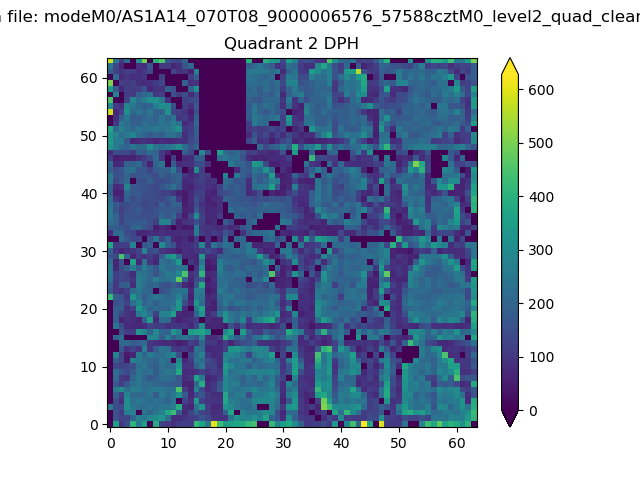 |
Quadrant C |
| Plot type | Count rate plots | Images |
|---|---|---|
| Comparison with Poisson distribution Blue bars denote a histogram of data divided into 1 sec bins. Red curve is a Poisson curve with rate = median count rate of data. |
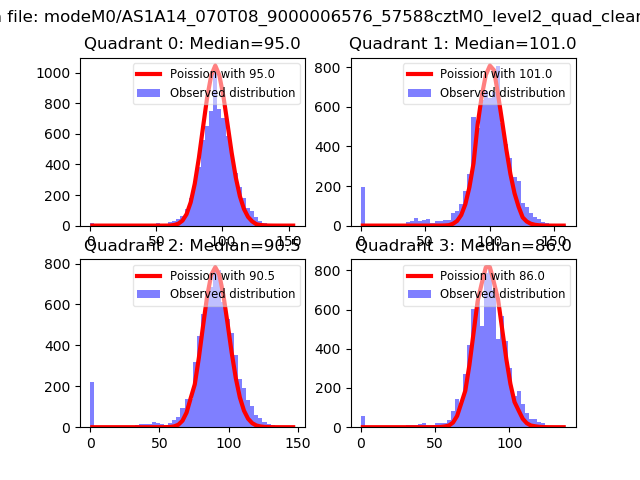 |
 |
| Quadrant-wise count rates Data is divided into 100 sec bins |
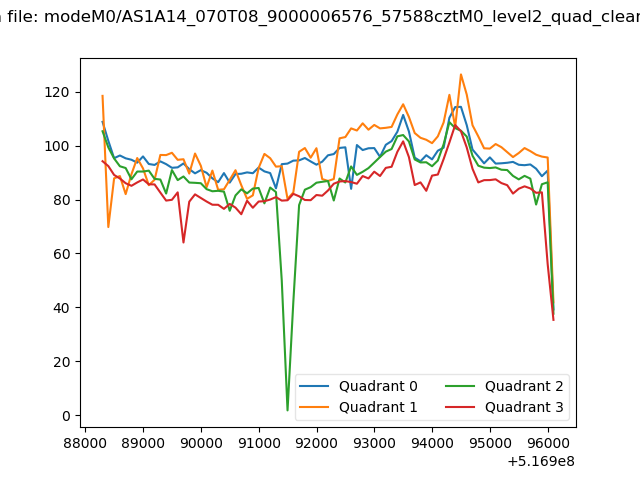 |
|
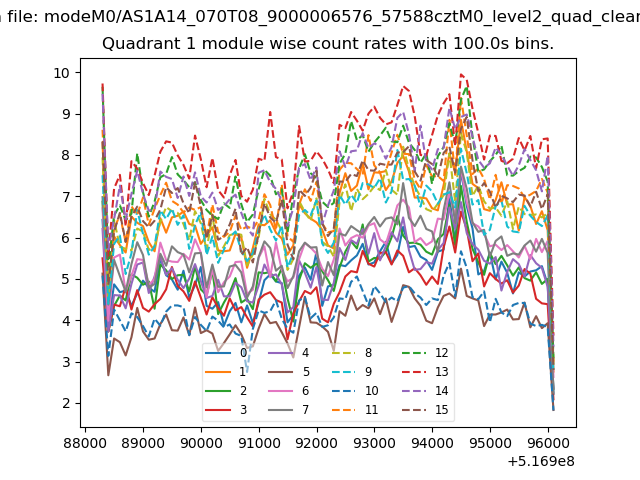
| Module-wise count rates for Quadrant A Data is divided into 100 sec bins |
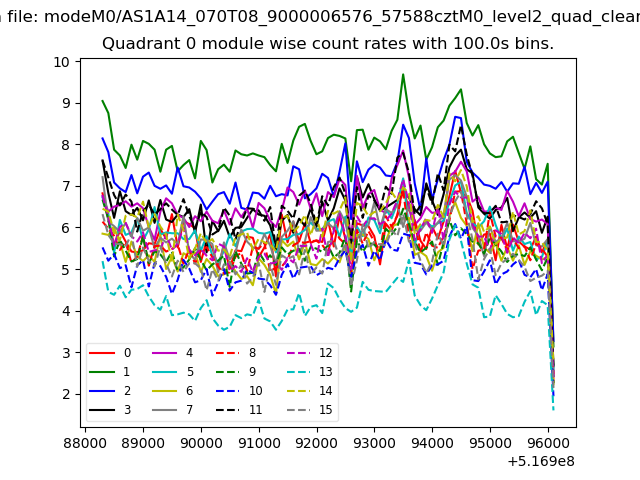 |
 |
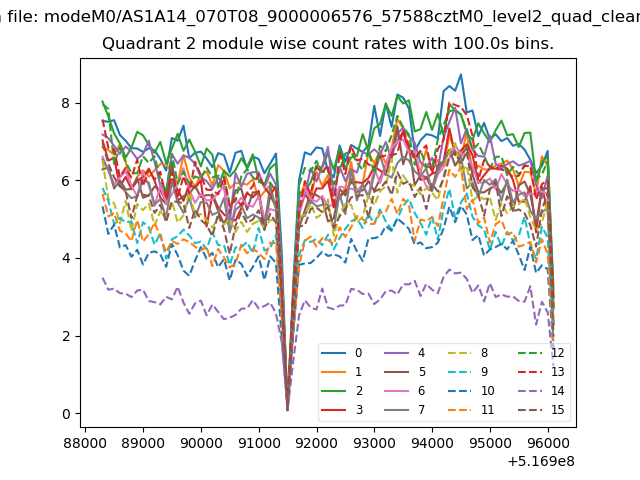
| Module-wise count rates for Quadrant B Data is divided into 100 sec bins |
 |
 |
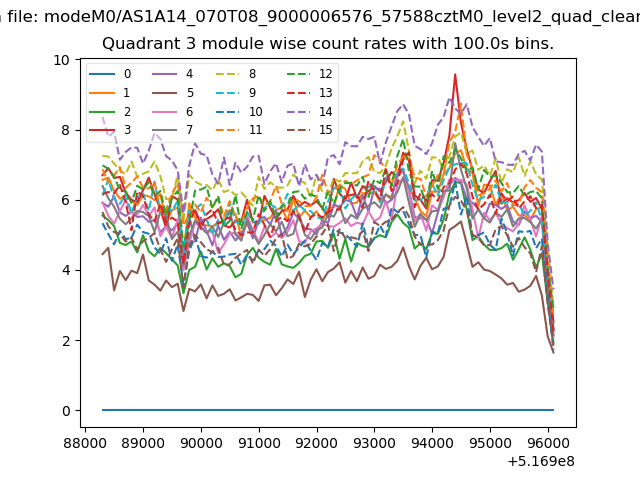
| Module-wise count rates for Quadrant C Data is divided into 100 sec bins |
 |
 |
| Module-wise count rates for Quadrant D Data is divided into 100 sec bins |
 |
 |
| Parameter | Plot |
|---|---|
| CZT HV Monitor | 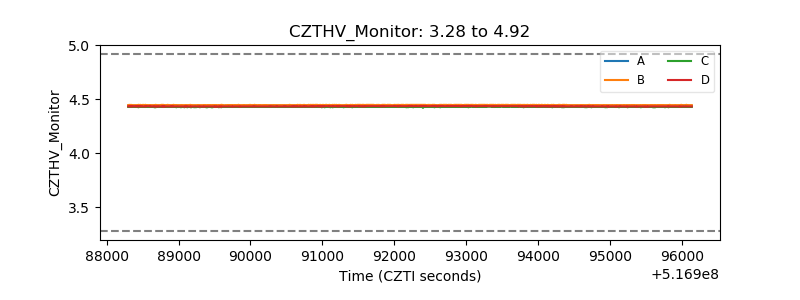 |
| D_VDD | 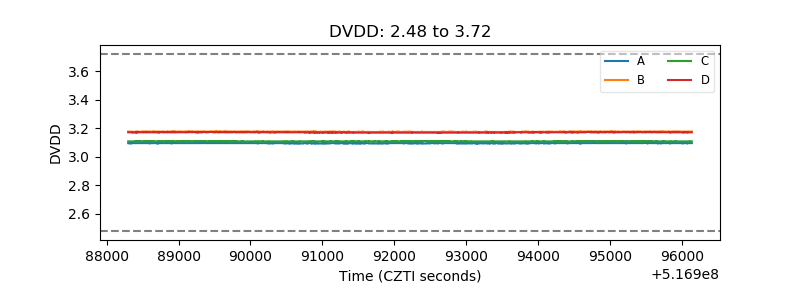 |
| Temperature 1 | 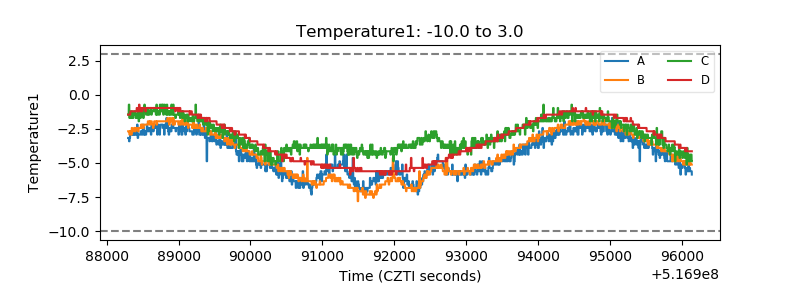 |
| Veto HV Monitor | 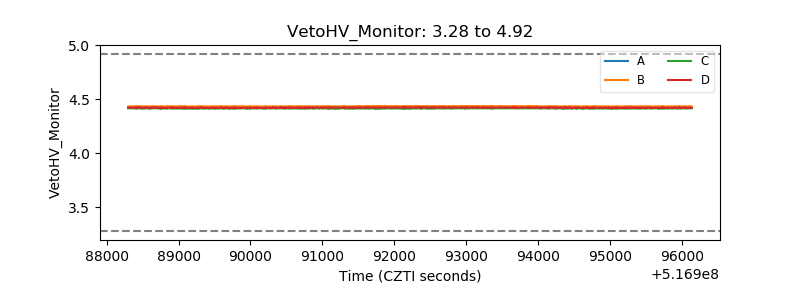 |
| Veto LLD | 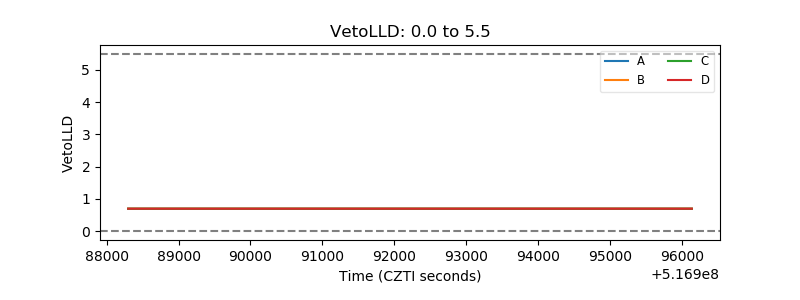 |
| Alpha Counter | 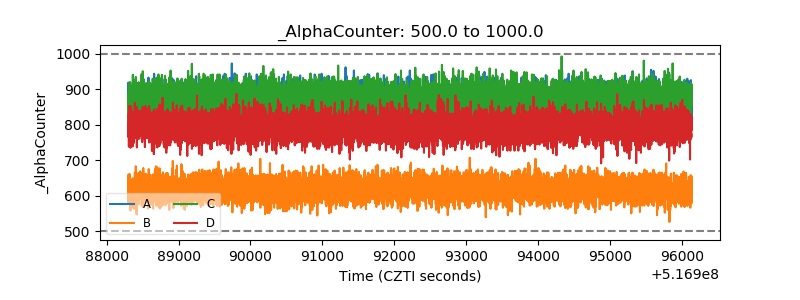 |
| _CPM_Rate | 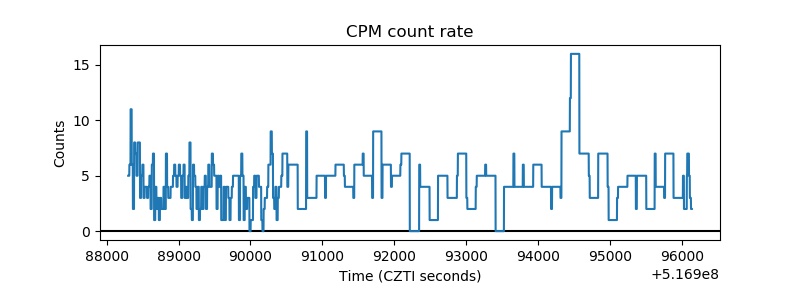 |
| CZT Counter | 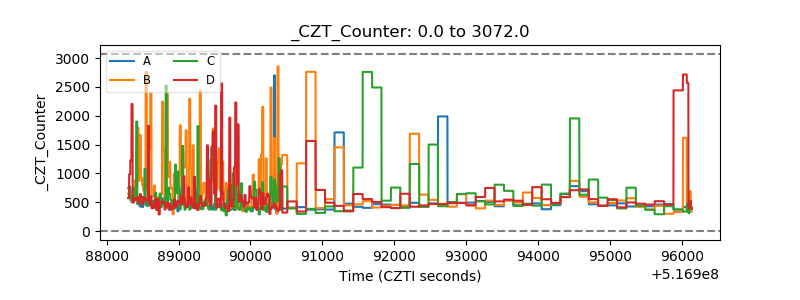 |
| +2.5 Volts monitor | 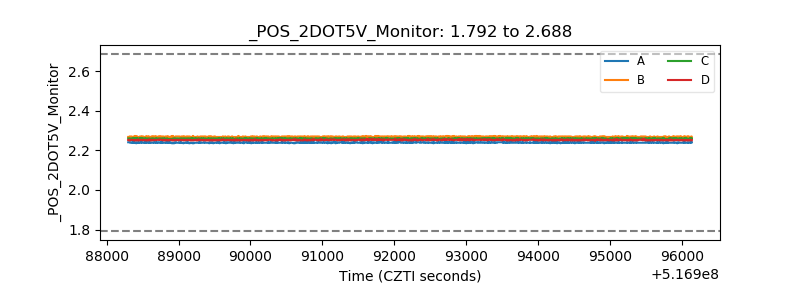 |
| +5 Volts monitor | 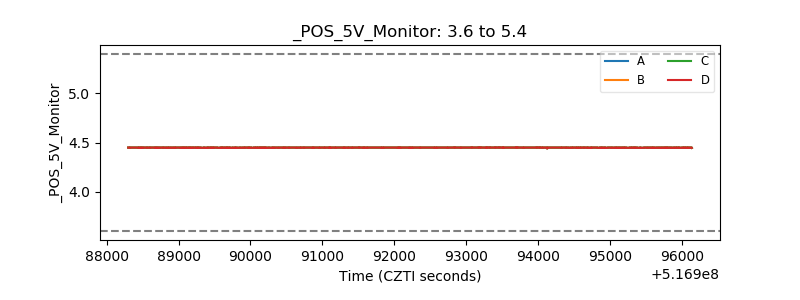 |
| _ROLL_ROT | 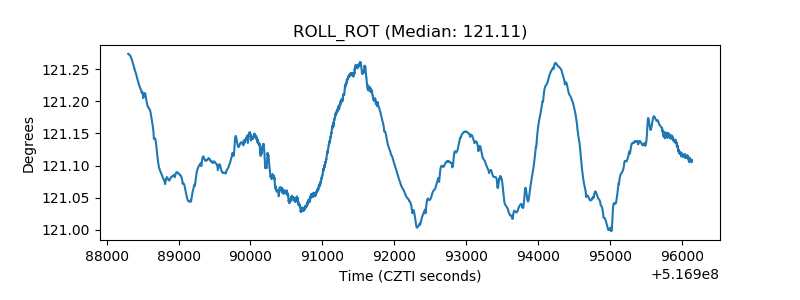 |
| _Roll_DEC | 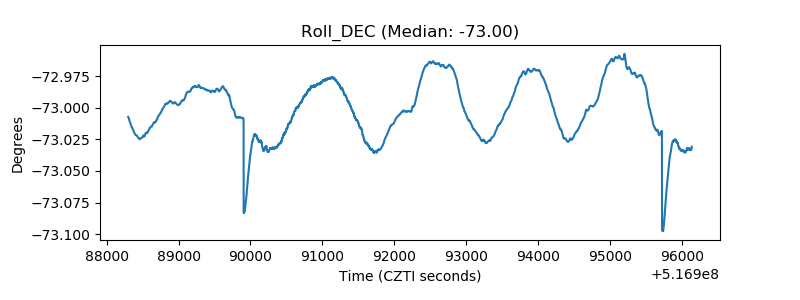 |
| _Roll_RA | 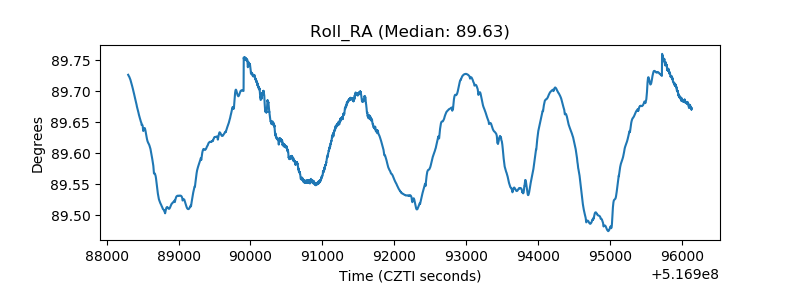 |
| Veto Counter | 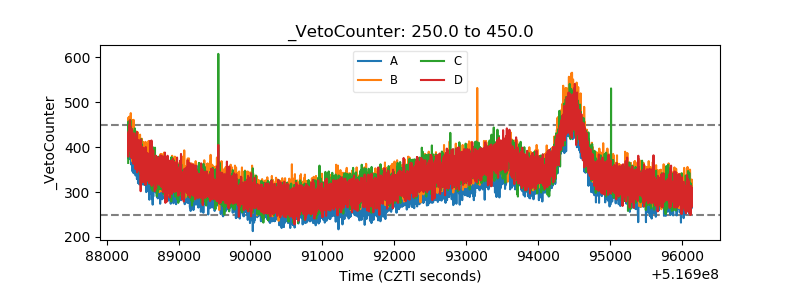 |