| Param | Original file | Final file |
|---|---|---|
| Filename | modeM0/AS1A14_070T08_9000006576_57591cztM0_level2.fits | modeM0/AS1A14_070T08_9000006576_57591cztM0_level2_quad_clean.evt |
| Size (bytes) | 1,319,693,760 | 217,393,920 |
| Size | 1.2 GB | 207.3 MB |
| Events in quadrant A | 9,926,570 | 1,363,206 |
| Events in quadrant B | 10,036,835 | 1,486,508 |
| Events in quadrant C | 11,905,042 | 1,386,329 |
| Events in quadrant D | 15,514,687 | 1,038,521 |
| Mode M0 | |||
|---|---|---|---|
| Quadrant | BADHDUFLAG | Total packets | Discarded packets |
| A | 0 | 43776 | 451 |
| B | 0 | 43722 | 310 |
| C | 0 | 49474 | 411 |
| D | 0 | 59586 | 546 |
| Mode M9 | |||
|---|---|---|---|
| Quadrant | BADHDUFLAG | Total packets | Discarded packets |
| A | 0 | 17 | 0 |
| B | 0 | 17 | 0 |
| C | 0 | 17 | 0 |
| D | 0 | 17 | 0 |
| Mode SS | |||
|---|---|---|---|
| Quadrant | BADHDUFLAG | Total packets | Discarded packets |
| A | 0 | 386 | 4 |
| B | 0 | 386 | 2 |
| C | 0 | 386 | 0 |
| D | 0 | 386 | 2 |
| Quadrant | Total seconds | Saturated seconds | Saturation percentage |
|---|---|---|---|
| A | 18949 | 380 | 2.005383% |
| B | 18978 | 521 | 2.745284% |
| C | 18953 | 670 | 3.535060% |
| D | 18945 | 2170 | 11.454210% |
Noise dominated data is calculated using 1-second bins in cleaned event files. If a bin has >2000 counts, and if more than 50% of those come from <1% of pixels, then it is considered to be noise-dominated and hence unusable.
| Quadrant | # 1 sec bins | Bins with >0 counts | Bins with >2000 counts | High rate bins dominated by noise | Noise dominated (total time) | Noise dominated (detector-on time) | Marked lightcurve |
|---|---|---|---|---|---|---|---|
| A | 20955 | 19310 | 229 | 229 | 1.09% | 1.19% | 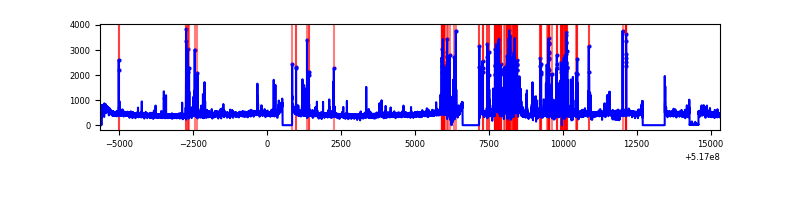 |
| B | 20950 | 19311 | 253 | 253 | 1.21% | 1.31% | 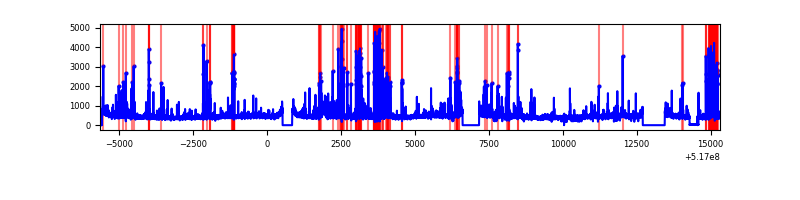 |
| C | 20957 | 19317 | 448 | 448 | 2.14% | 2.32% | 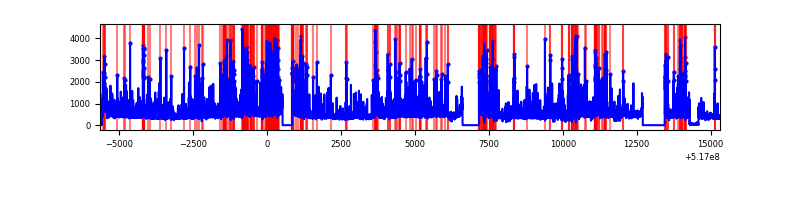 |
| D | 20974 | 19229 | 1913 | 1913 | 9.12% | 9.95% | 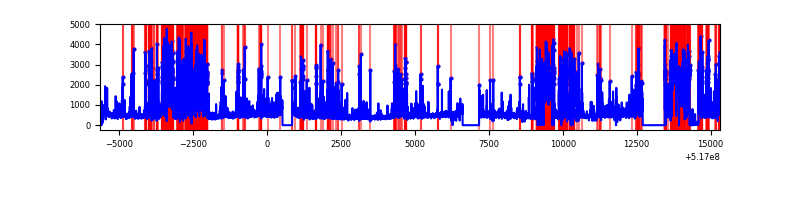 |
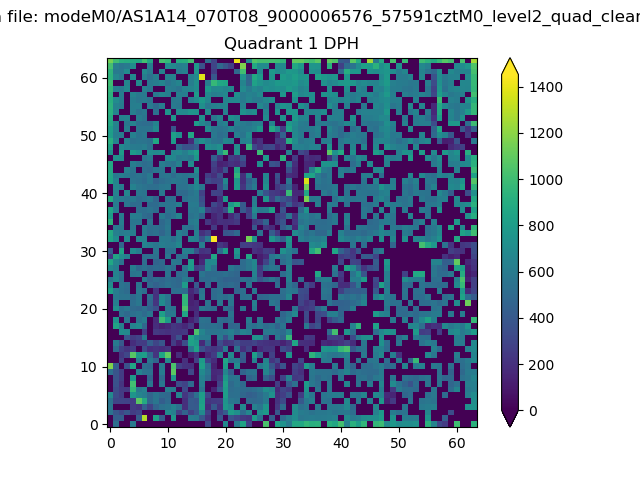
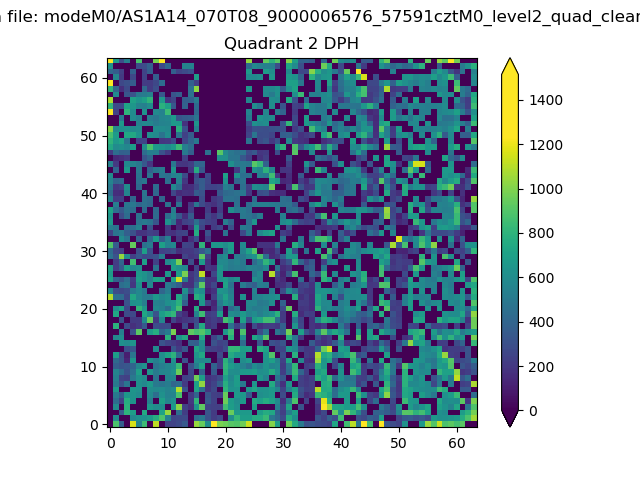
Top three noisy pixels from each quadrant. If the there are fewer than three noisy pixels in the level2.evt file, extra rows are filled as -1
| Pixel properties | Quadrant properties | ||||||
|---|---|---|---|---|---|---|---|
| Quadrant | DetID | PixID | Counts | Sigma | Mean | Median | Sigma |
| A | 4 | 249 | 1591430 | 3173.15 | 2037 | 1984 | 500.9 |
| A | 10 | 251 | 141737 | 279.0 | 2037 | 1984 | 500.9 |
| A | 3 | 128 | 119546 | 234.7 | 2037 | 1984 | 500.9 |
| B | 2 | 249 | 1238315 | 2924.72 | 2010 | 1936 | 422.7 |
| B | 0 | 63 | 148100 | 345.76 | 2010 | 1936 | 422.7 |
| B | 0 | 245 | 133456 | 311.12 | 2010 | 1936 | 422.7 |
| C | 15 | 224 | 3589536 | 6778.88 | 1955 | 1930 | 529.2 |
| C | 15 | 198 | 236279 | 442.81 | 1955 | 1930 | 529.2 |
| C | 14 | 254 | 197055 | 368.69 | 1955 | 1930 | 529.2 |
| D | 15 | 142 | 3881903 | 7358.44 | 1857 | 1769 | 527.3 |
| D | 15 | 94 | 1957178 | 3708.31 | 1857 | 1769 | 527.3 |
| D | 2 | 249 | 342577 | 646.32 | 1857 | 1769 | 527.3 |
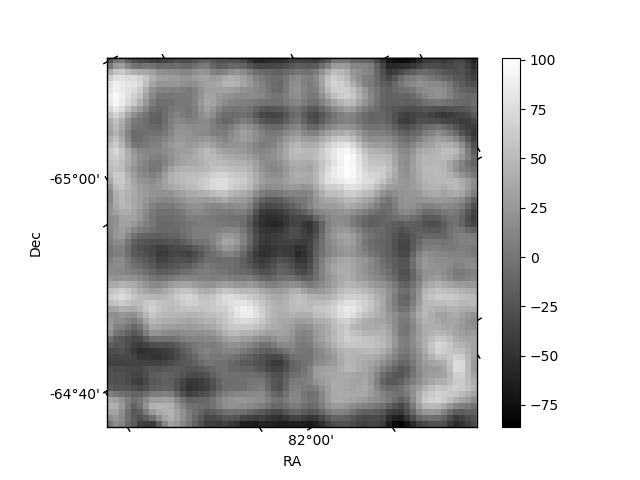
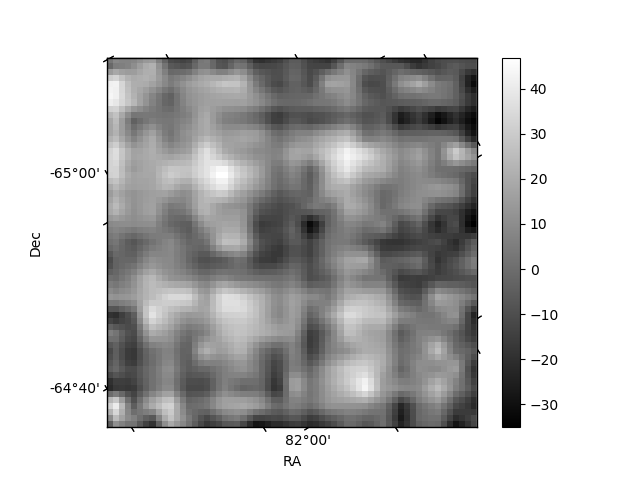
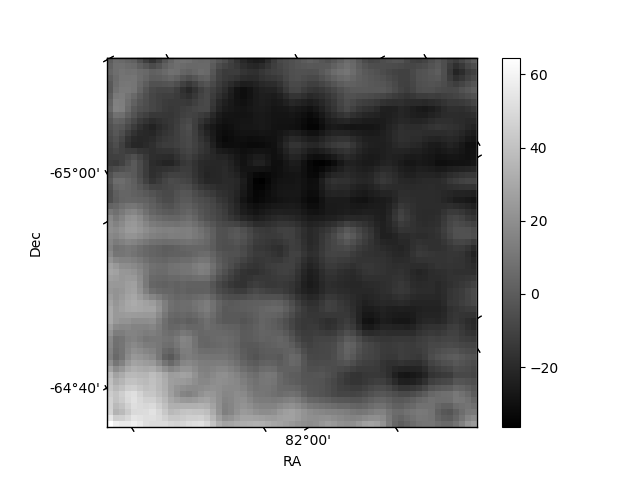
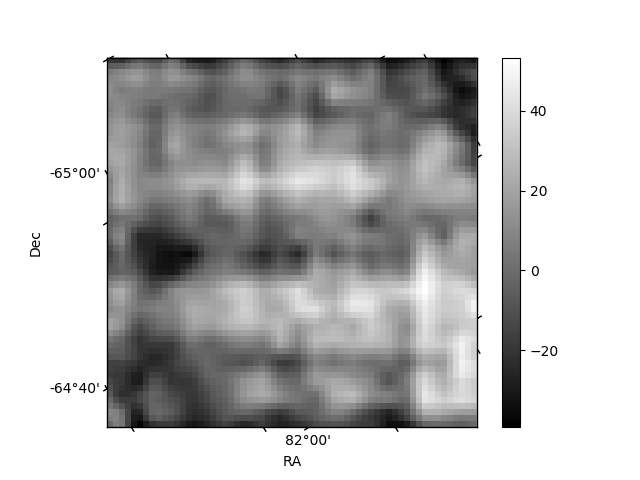
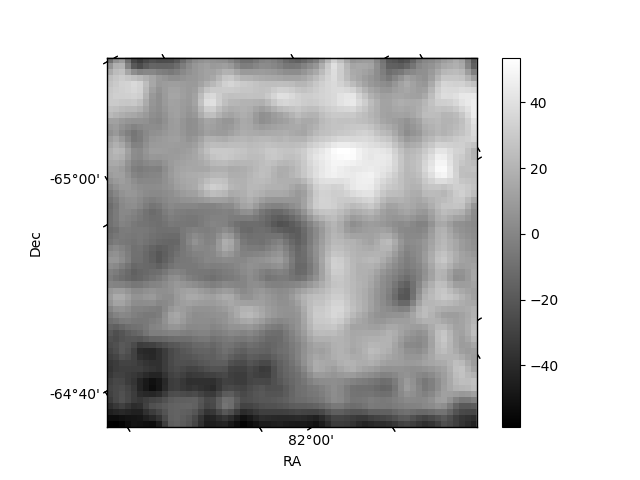
Histogram calculated using DETX and DETY for each event in the final _common_clean file
| Quadrant A | 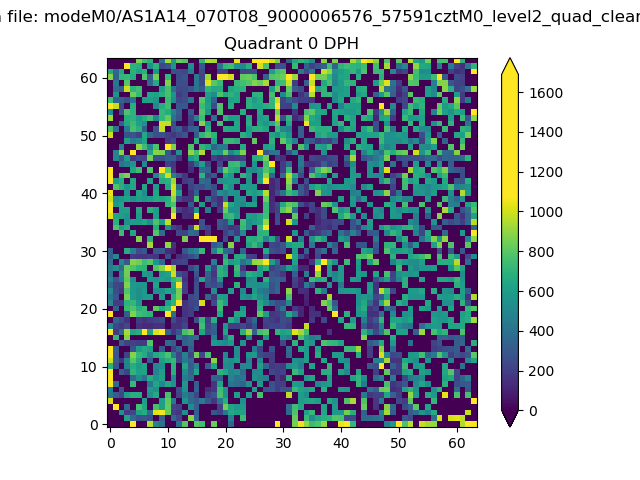 |
 |
Quadrant B |
|---|---|---|---|
| Quadrant D | 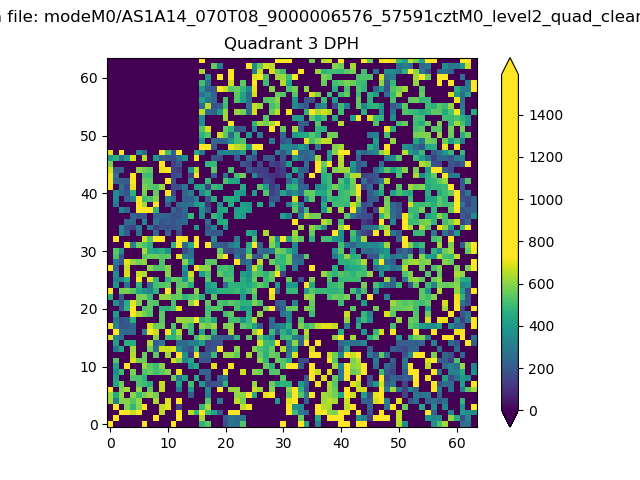 |
 |
Quadrant C |
| Plot type | Count rate plots | Images |
|---|---|---|
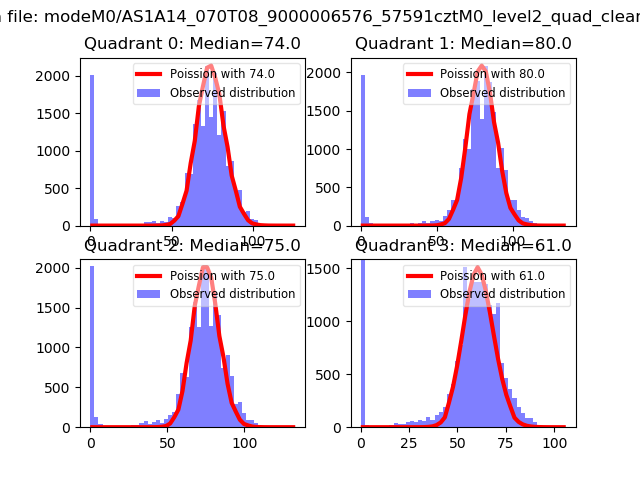
| Comparison with Poisson distribution Blue bars denote a histogram of data divided into 1 sec bins. Red curve is a Poisson curve with rate = median count rate of data. |
 |
 |
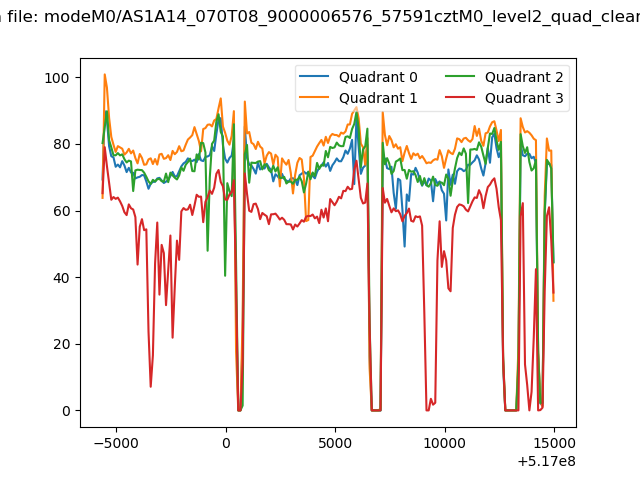
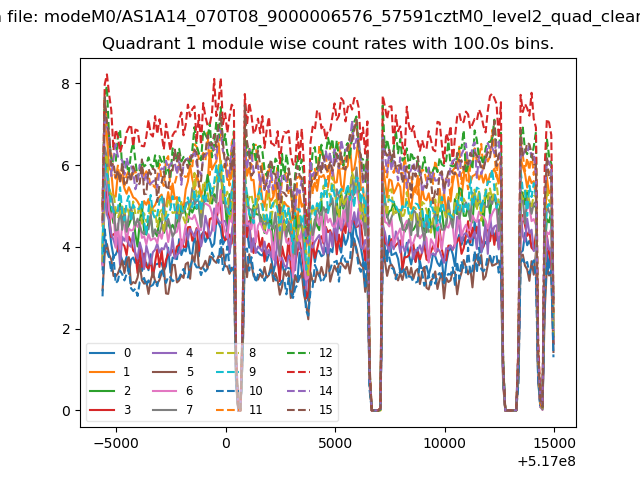
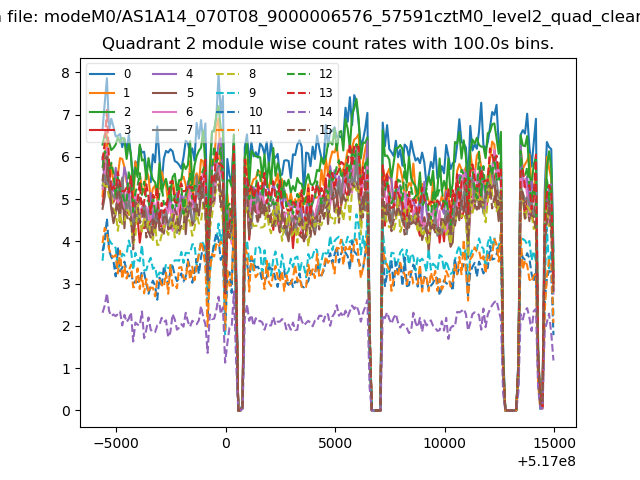
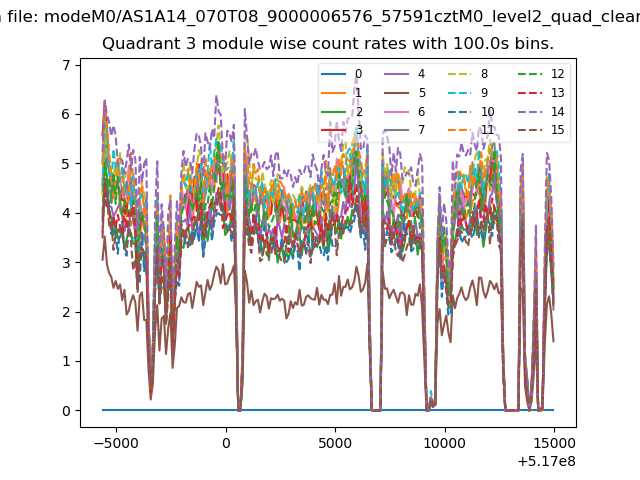
| Quadrant-wise count rates Data is divided into 100 sec bins |
 |
|
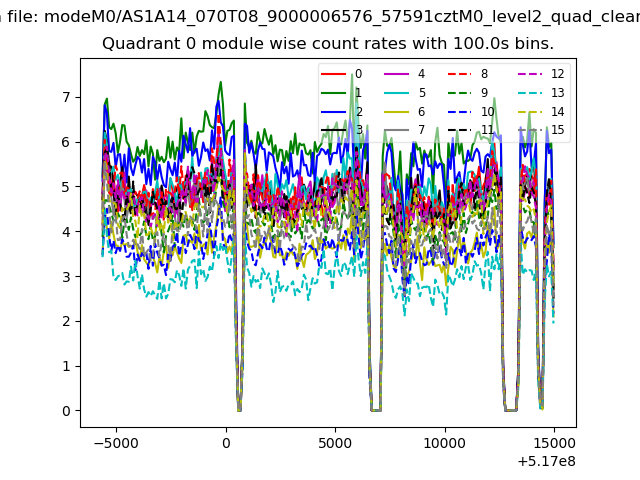
| Module-wise count rates for Quadrant A Data is divided into 100 sec bins |
 |
 |
| Module-wise count rates for Quadrant B Data is divided into 100 sec bins |
 |
 |
| Module-wise count rates for Quadrant C Data is divided into 100 sec bins |
 |
 |
| Module-wise count rates for Quadrant D Data is divided into 100 sec bins |
 |
 |
| Parameter | Plot |
|---|---|
| CZT HV Monitor | 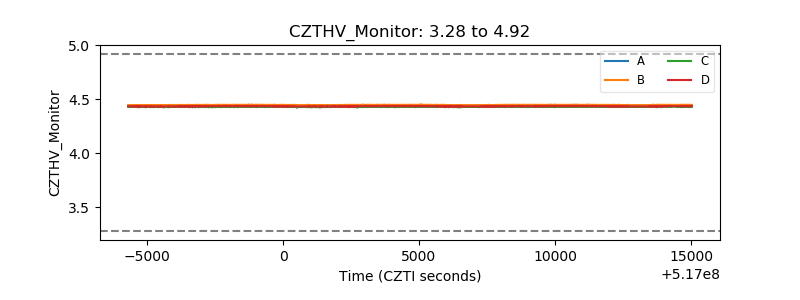 |
| D_VDD | 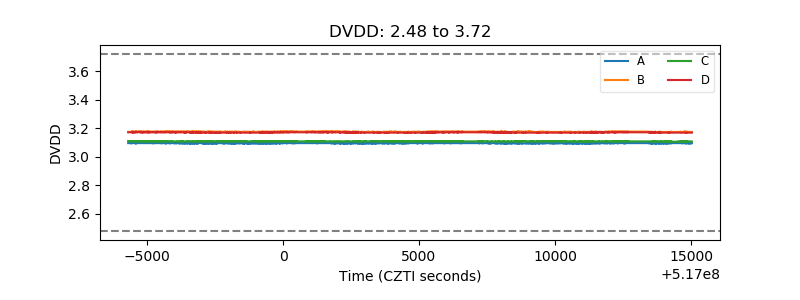 |
| Temperature 1 | 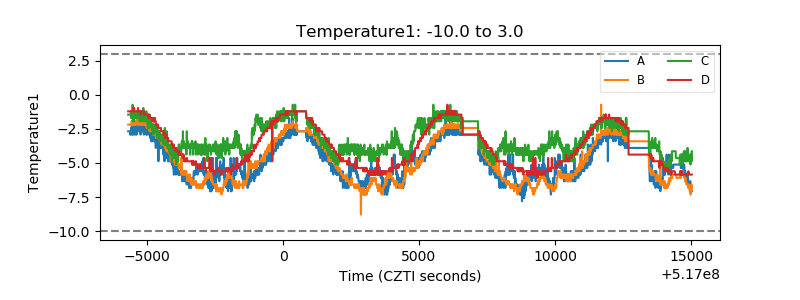 |
| Veto HV Monitor | 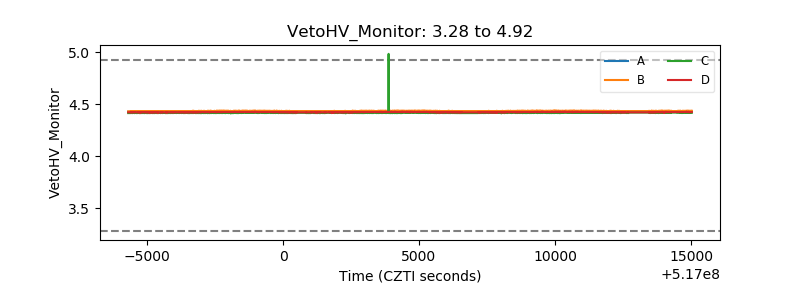 |
| Veto LLD | 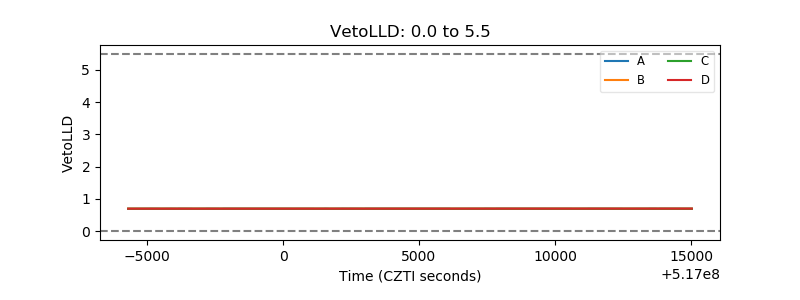 |
| Alpha Counter | 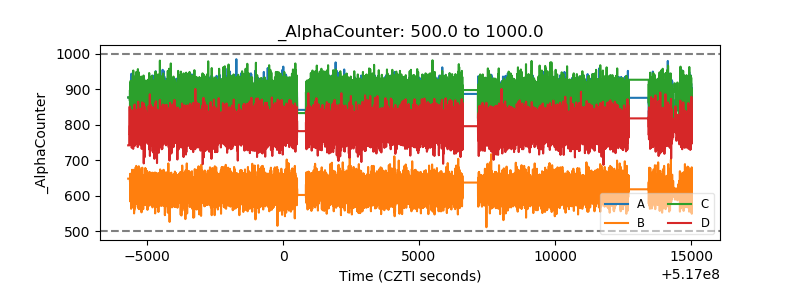 |
| _CPM_Rate | 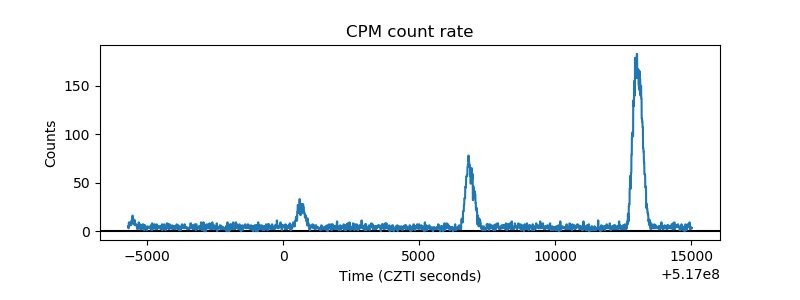 |
| CZT Counter | 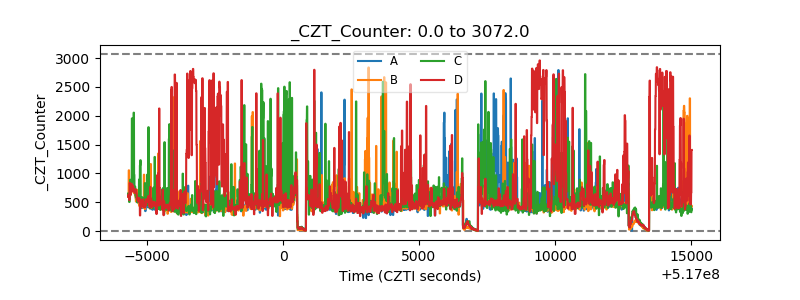 |
| +2.5 Volts monitor | 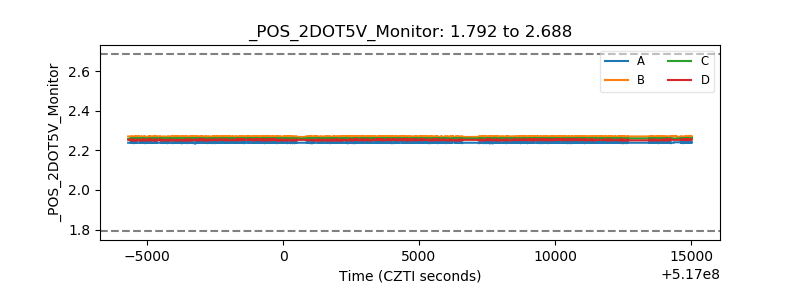 |
| +5 Volts monitor | 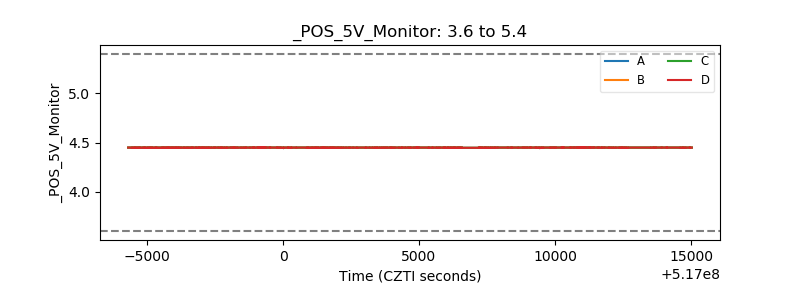 |
| _ROLL_ROT | 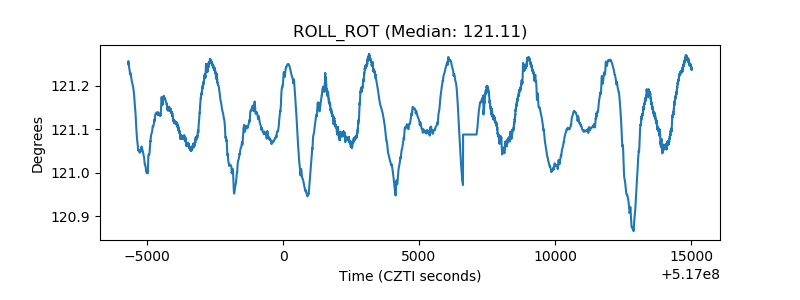 |
| _Roll_DEC | 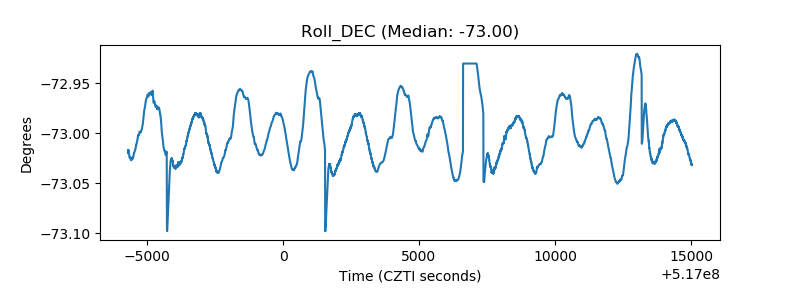 |
| _Roll_RA | 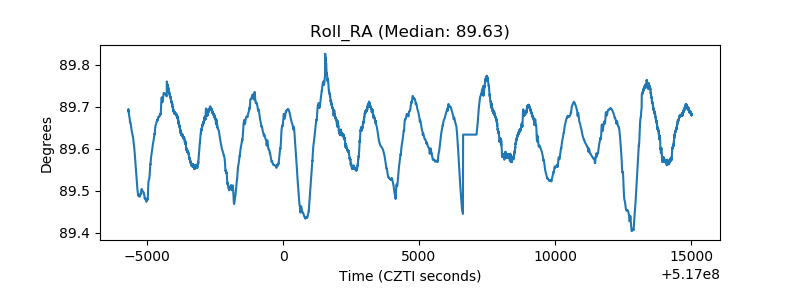 |
| Veto Counter | 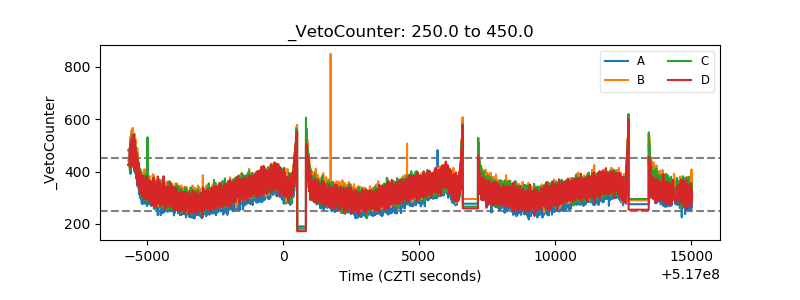 |