| Param | Original file | Final file |
|---|---|---|
| Filename | modeM0/AS1A14_070T08_9000006576_57592cztM0_level2.fits | modeM0/AS1A14_070T08_9000006576_57592cztM0_level2_quad_clean.evt |
| Size (bytes) | 562,636,800 | 83,076,480 |
| Size | 536.6 MB | 79.2 MB |
| Events in quadrant A | 3,505,922 | 557,967 |
| Events in quadrant B | 3,450,056 | 592,341 |
| Events in quadrant C | 3,739,928 | 537,383 |
| Events in quadrant D | 9,596,322 | 348,445 |
| Mode M0 | |||
|---|---|---|---|
| Quadrant | BADHDUFLAG | Total packets | Discarded packets |
| A | 0 | 15098 | 2 |
| B | 0 | 15261 | 2 |
| C | 0 | 16067 | 2 |
| D | 0 | 33285 | 2 |
| Mode M9 | |||
|---|---|---|---|
| Quadrant | BADHDUFLAG | Total packets | Discarded packets |
| A | 0 | 17 | 0 |
| B | 0 | 17 | 0 |
| C | 0 | 17 | 0 |
| D | 0 | 17 | 0 |
| Mode SS | |||
|---|---|---|---|
| Quadrant | BADHDUFLAG | Total packets | Discarded packets |
| A | 0 | 140 | 0 |
| B | 0 | 140 | 0 |
| C | 0 | 140 | 0 |
| D | 0 | 140 | 0 |
| Quadrant | Total seconds | Saturated seconds | Saturation percentage |
|---|---|---|---|
| A | 6879 | 119 | 1.729903% |
| B | 6880 | 199 | 2.892442% |
| C | 6880 | 142 | 2.063953% |
| D | 6880 | 2240 | 32.558140% |
Noise dominated data is calculated using 1-second bins in cleaned event files. If a bin has >2000 counts, and if more than 50% of those come from <1% of pixels, then it is considered to be noise-dominated and hence unusable.
| Quadrant | # 1 sec bins | Bins with >0 counts | Bins with >2000 counts | High rate bins dominated by noise | Noise dominated (total time) | Noise dominated (detector-on time) | Marked lightcurve |
|---|---|---|---|---|---|---|---|
| A | 8809 | 7166 | 48 | 48 | 0.54% | 0.67% | 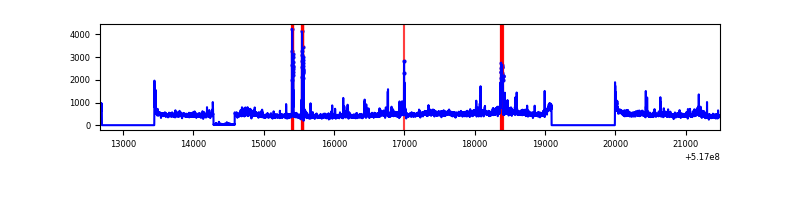 |
| B | 8810 | 7162 | 93 | 93 | 1.06% | 1.30% | 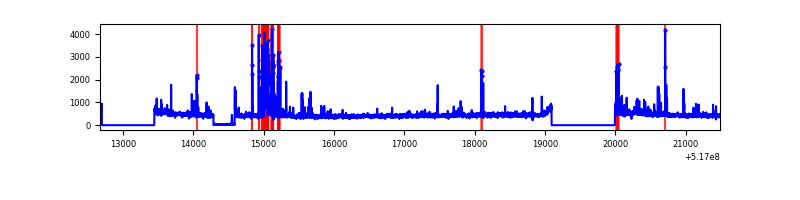 |
| C | 8810 | 7167 | 83 | 83 | 0.94% | 1.16% | 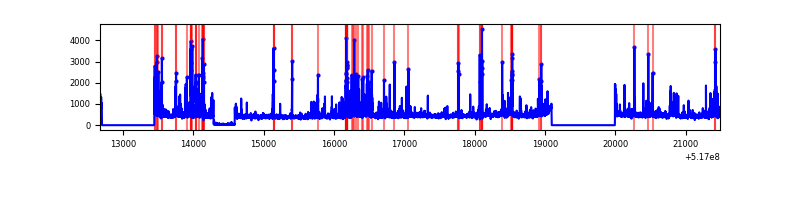 |
| D | 8810 | 7088 | 2041 | 2041 | 23.17% | 28.80% | 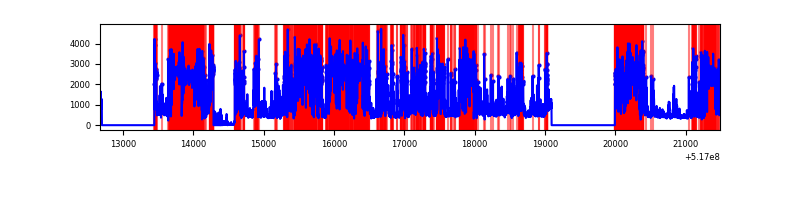 |
Top three noisy pixels from each quadrant. If the there are fewer than three noisy pixels in the level2.evt file, extra rows are filled as -1
| Pixel properties | Quadrant properties | ||||||
|---|---|---|---|---|---|---|---|
| Quadrant | DetID | PixID | Counts | Sigma | Mean | Median | Sigma |
| A | 4 | 249 | 316652 | 1731.22 | 736 | 716 | 182.5 |
| A | 3 | 14 | 234007 | 1278.36 | 736 | 716 | 182.5 |
| A | 3 | 128 | 80028 | 434.6 | 736 | 716 | 182.5 |
| B | 2 | 249 | 344641 | 2217.44 | 727 | 700 | 155.1 |
| B | 10 | 16 | 85833 | 548.87 | 727 | 700 | 155.1 |
| B | 0 | 63 | 43418 | 275.41 | 727 | 700 | 155.1 |
| C | 15 | 224 | 731539 | 3759.48 | 717 | 710 | 194.4 |
| C | 14 | 245 | 96915 | 494.89 | 717 | 710 | 194.4 |
| C | 14 | 246 | 39420 | 199.13 | 717 | 710 | 194.4 |
| D | 15 | 142 | 6493853 | 39527.21 | 580 | 554 | 164.3 |
| D | 2 | 249 | 322194 | 1957.95 | 580 | 554 | 164.3 |
| D | 8 | 240 | 93934 | 568.44 | 580 | 554 | 164.3 |
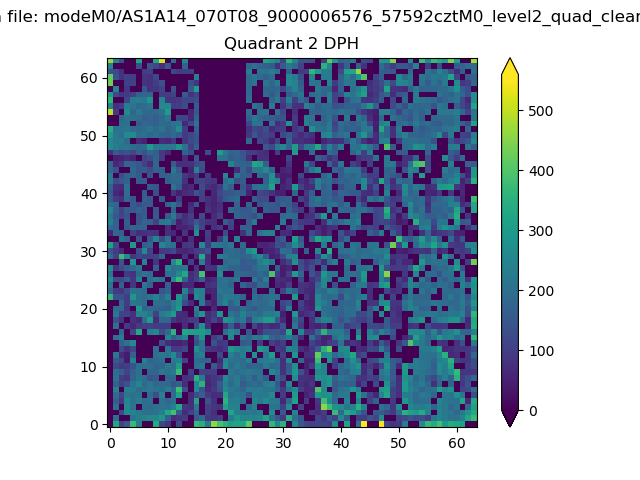
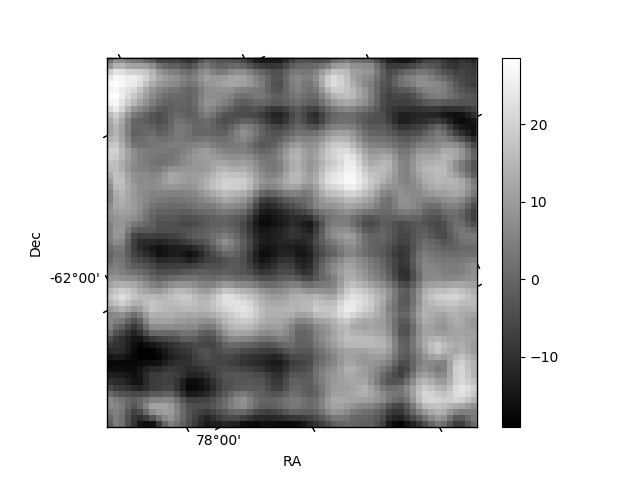
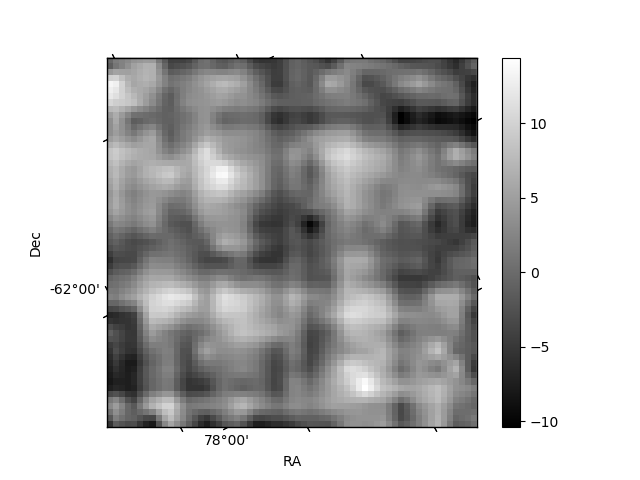
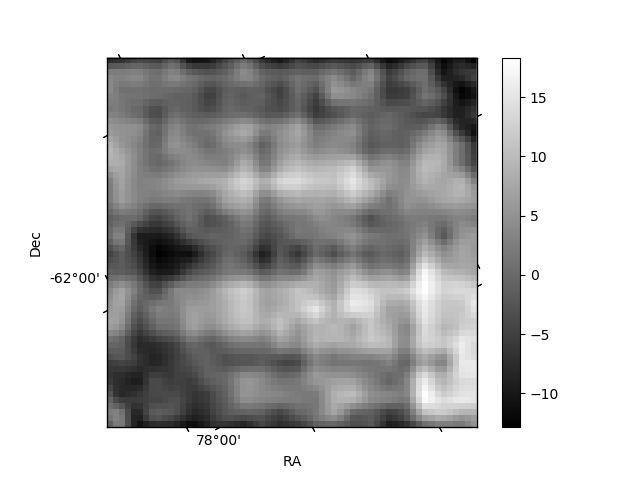
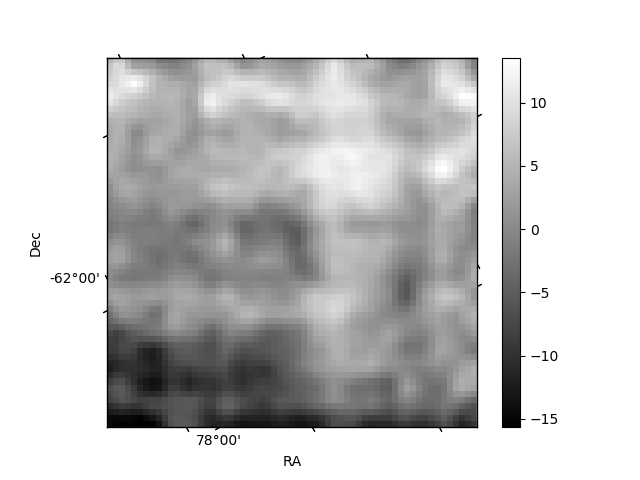
Histogram calculated using DETX and DETY for each event in the final _common_clean file
| Quadrant A | 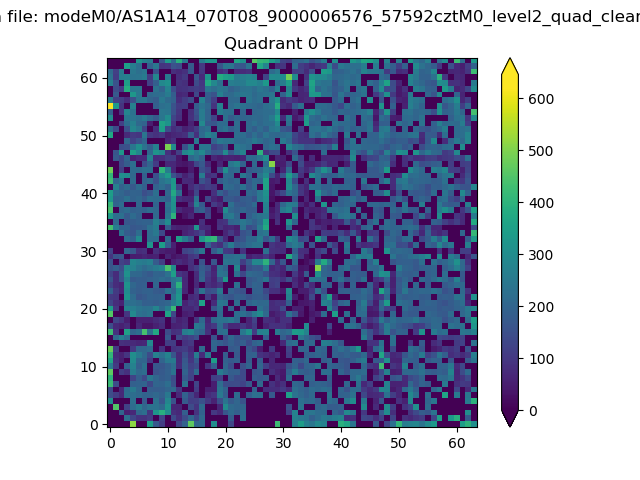 |
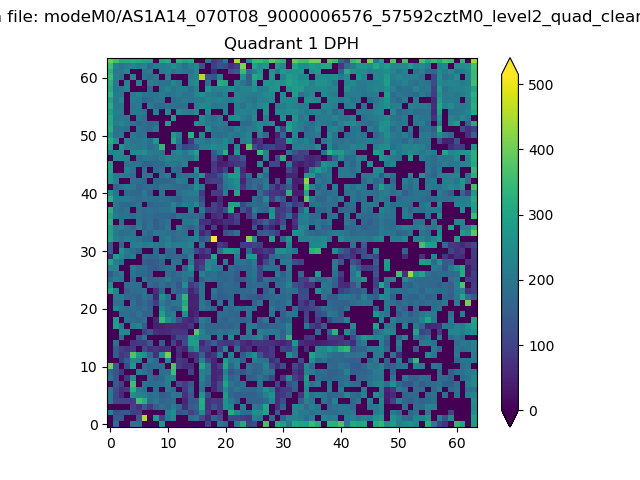 |
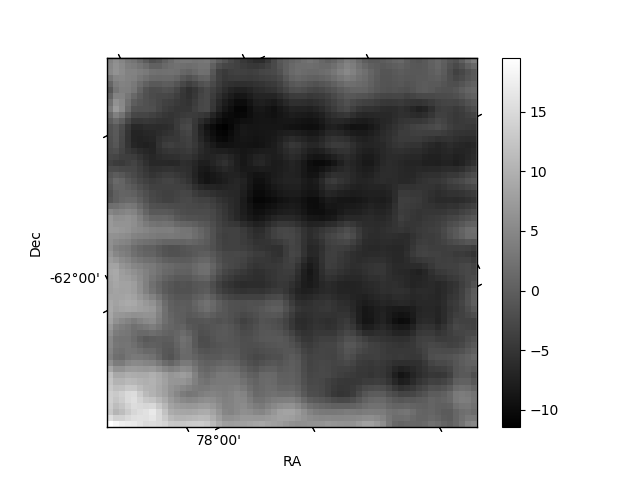
Quadrant B |
|---|---|---|---|
| Quadrant D | 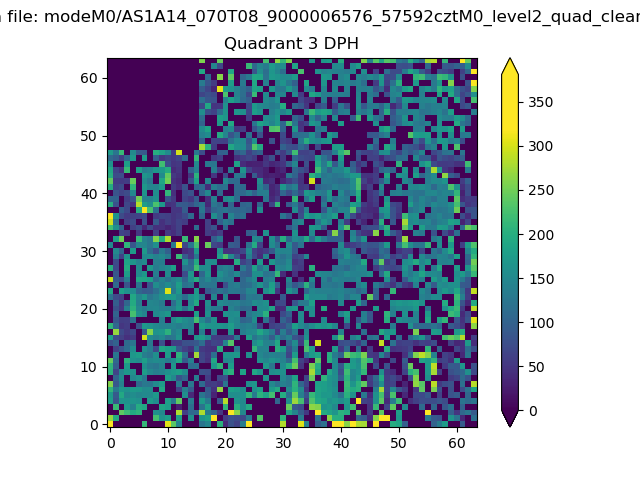 |
 |
Quadrant C |
| Plot type | Count rate plots | Images |
|---|---|---|
| Comparison with Poisson distribution Blue bars denote a histogram of data divided into 1 sec bins. Red curve is a Poisson curve with rate = median count rate of data. |
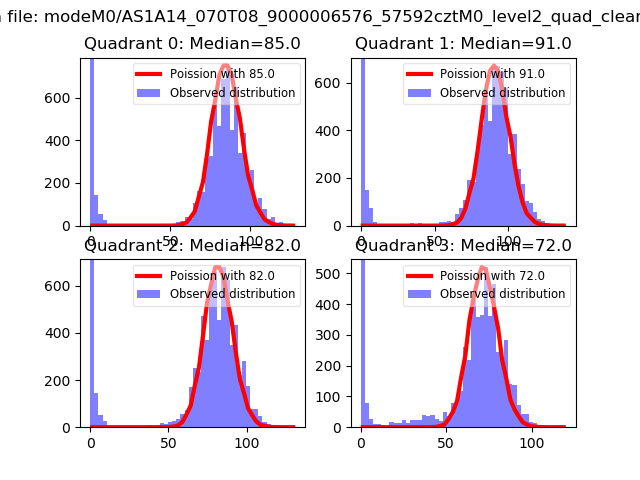 |
 |
| Quadrant-wise count rates Data is divided into 100 sec bins |
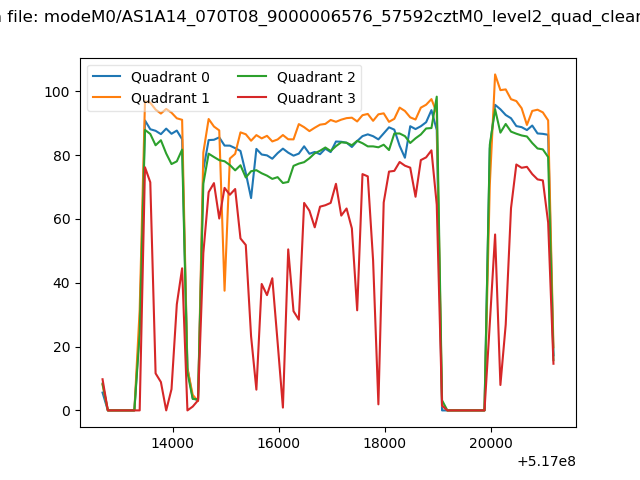 |
|
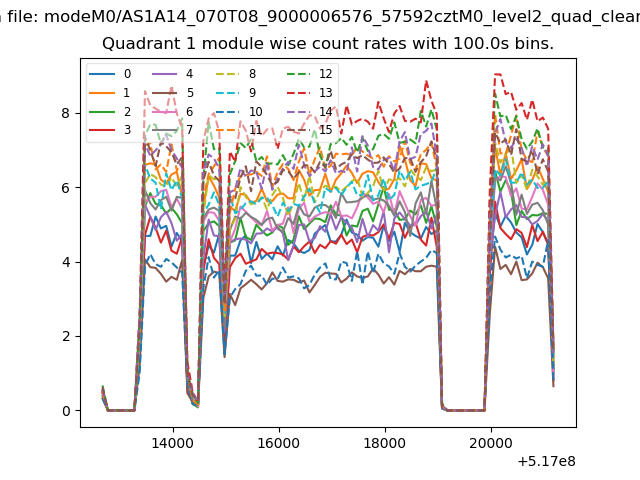
| Module-wise count rates for Quadrant A Data is divided into 100 sec bins |
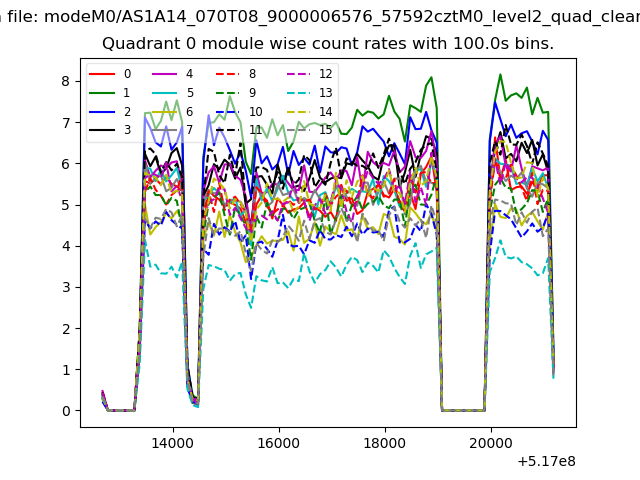 |
 |
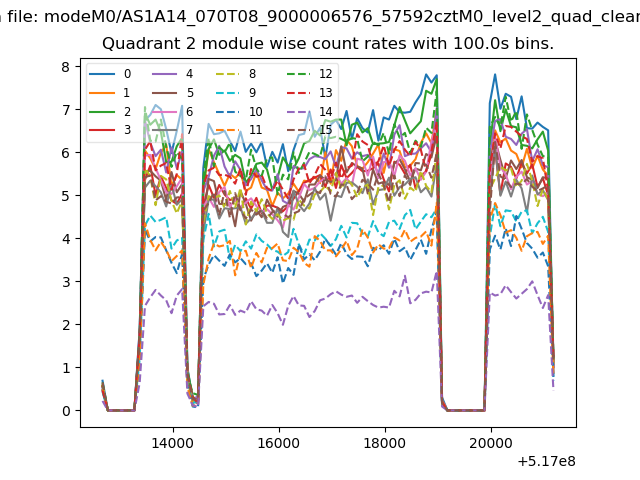
| Module-wise count rates for Quadrant B Data is divided into 100 sec bins |
 |
 |
| Module-wise count rates for Quadrant C Data is divided into 100 sec bins |
 |
 |
| Module-wise count rates for Quadrant D Data is divided into 100 sec bins |
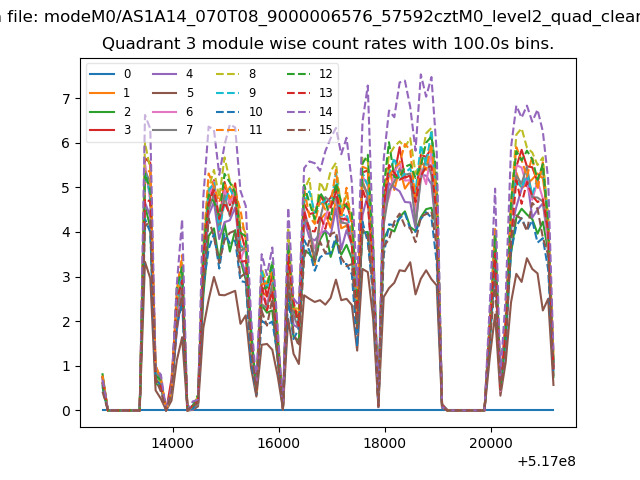 |
 |
| Parameter | Plot |
|---|---|
| CZT HV Monitor | 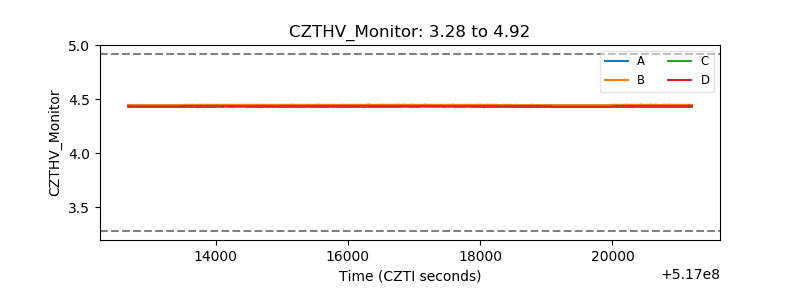 |
| D_VDD | 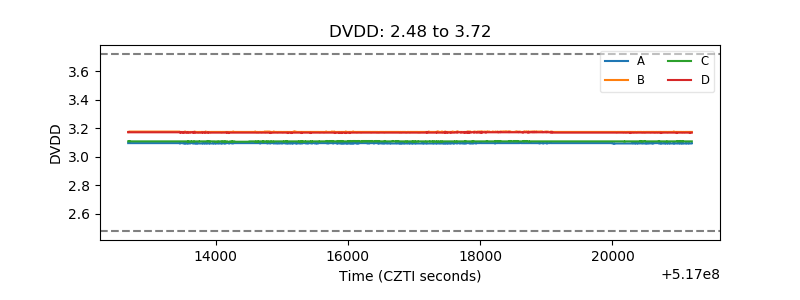 |
| Temperature 1 | 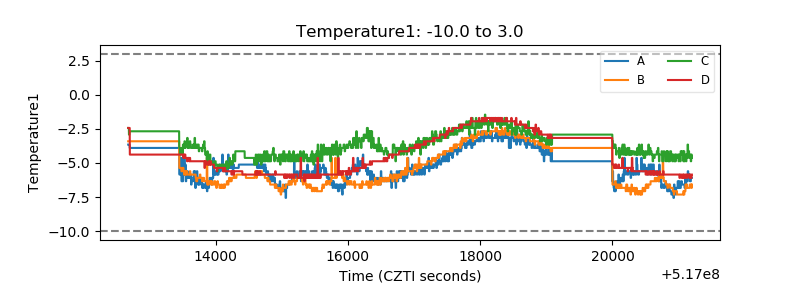 |
| Veto HV Monitor | 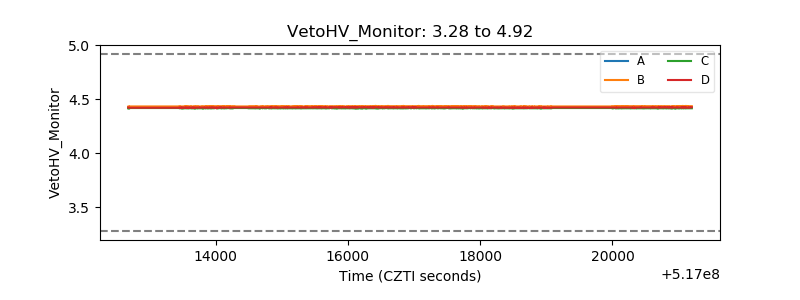 |
| Veto LLD | 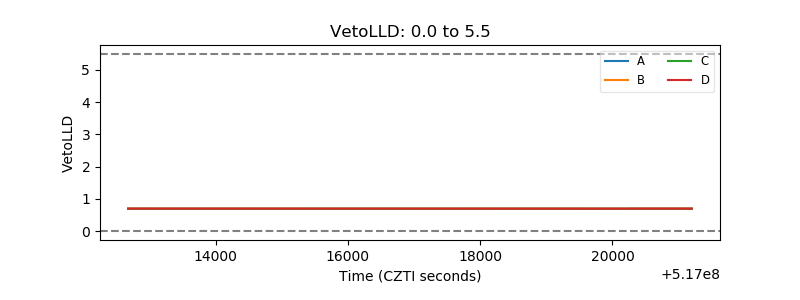 |
| Alpha Counter | 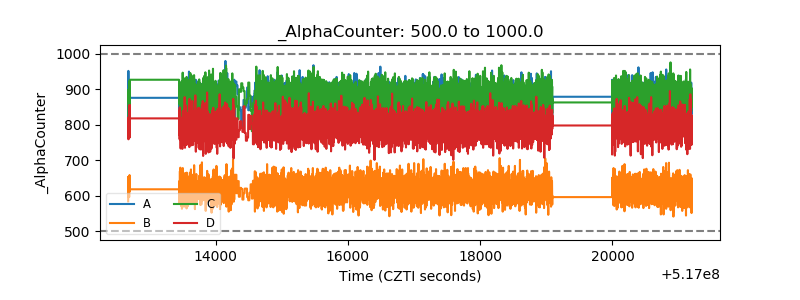 |
| _CPM_Rate | 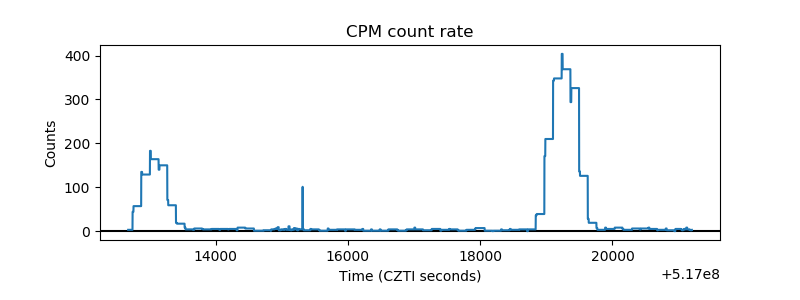 |
| CZT Counter | 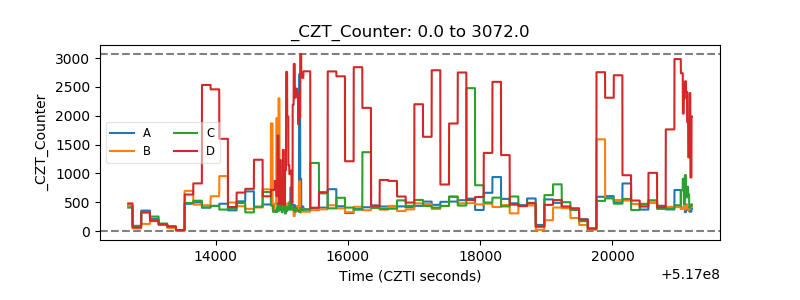 |
| +2.5 Volts monitor | 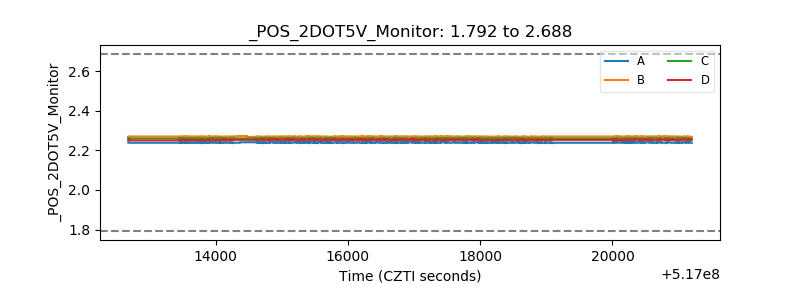 |
| +5 Volts monitor |  |
| _ROLL_ROT | 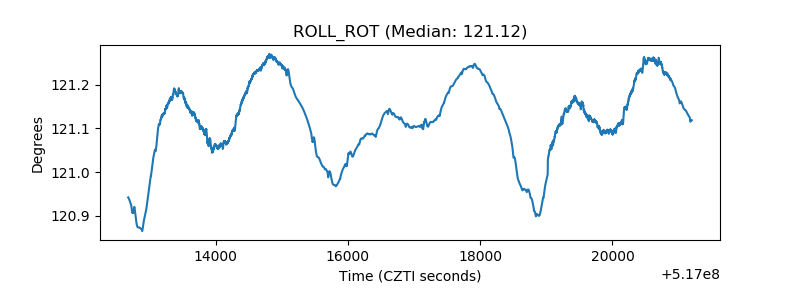 |
| _Roll_DEC | 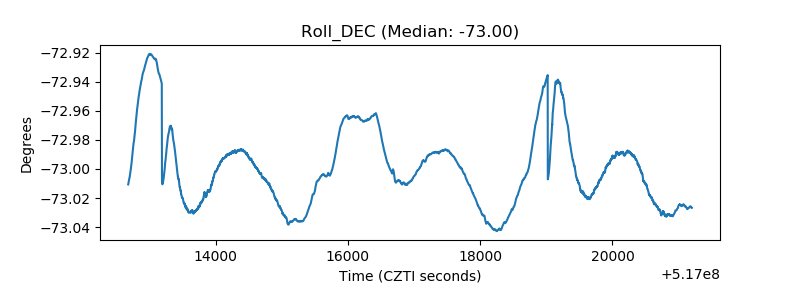 |
| _Roll_RA | 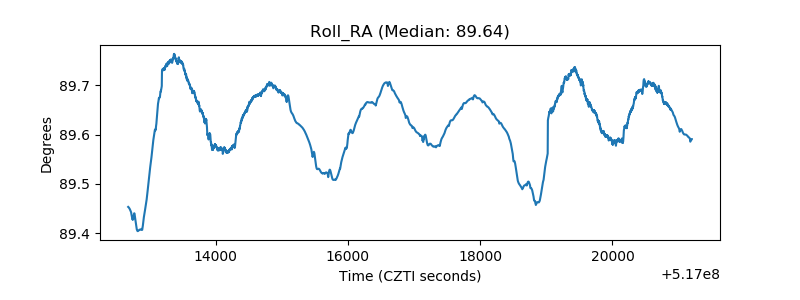 |
| Veto Counter | 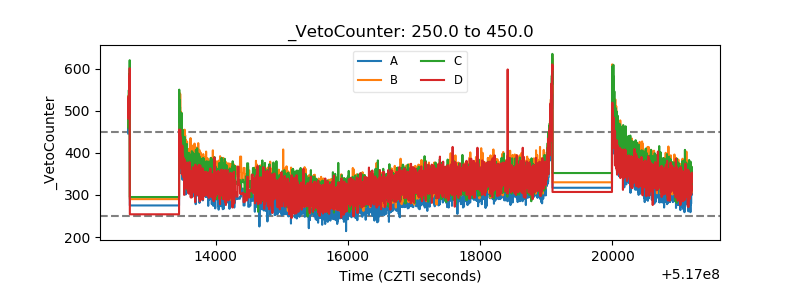 |