| Param | Original file | Final file |
|---|---|---|
| Filename | modeM0/AS1A14_070T08_9000006576_57594cztM0_level2.fits | modeM0/AS1A14_070T08_9000006576_57594cztM0_level2_quad_clean.evt |
| Size (bytes) | 2,112,966,720 | 401,474,880 |
| Size | 2.0 GB | 382.9 MB |
| Events in quadrant A | 14,810,058 | 2,692,374 |
| Events in quadrant B | 14,419,329 | 2,883,645 |
| Events in quadrant C | 18,194,692 | 2,515,547 |
| Events in quadrant D | 28,556,557 | 2,077,384 |
| Mode M0 | |||
|---|---|---|---|
| Quadrant | BADHDUFLAG | Total packets | Discarded packets |
| A | 0 | 64662 | 5 |
| B | 0 | 63796 | 5 |
| C | 0 | 74875 | 5 |
| D | 0 | 104650 | 5 |
| Mode M9 | |||
|---|---|---|---|
| Quadrant | BADHDUFLAG | Total packets | Discarded packets |
| A | 0 | 37 | 0 |
| B | 0 | 37 | 0 |
| C | 0 | 37 | 0 |
| D | 0 | 37 | 0 |
| Mode SS | |||
|---|---|---|---|
| Quadrant | BADHDUFLAG | Total packets | Discarded packets |
| A | 0 | 586 | 0 |
| B | 0 | 586 | 0 |
| C | 0 | 586 | 0 |
| D | 0 | 586 | 0 |
| Quadrant | Total seconds | Saturated seconds | Saturation percentage |
|---|---|---|---|
| A | 28898 | 500 | 1.730224% |
| B | 28899 | 593 | 2.051974% |
| C | 28899 | 1143 | 3.955154% |
| D | 28899 | 4972 | 17.204748% |
Noise dominated data is calculated using 1-second bins in cleaned event files. If a bin has >2000 counts, and if more than 50% of those come from <1% of pixels, then it is considered to be noise-dominated and hence unusable.
| Quadrant | # 1 sec bins | Bins with >0 counts | Bins with >2000 counts | High rate bins dominated by noise | Noise dominated (total time) | Noise dominated (detector-on time) | Marked lightcurve |
|---|---|---|---|---|---|---|---|
| A | 32748 | 29188 | 292 | 292 | 0.89% | 1.00% | 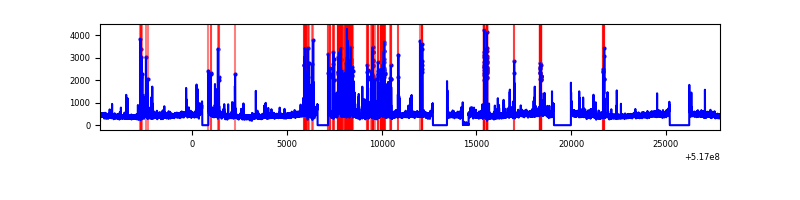 |
| B | 32749 | 29184 | 272 | 272 | 0.83% | 0.93% | 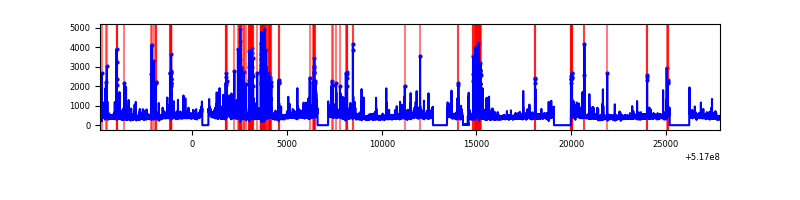 |
| C | 32749 | 29189 | 813 | 813 | 2.48% | 2.79% | 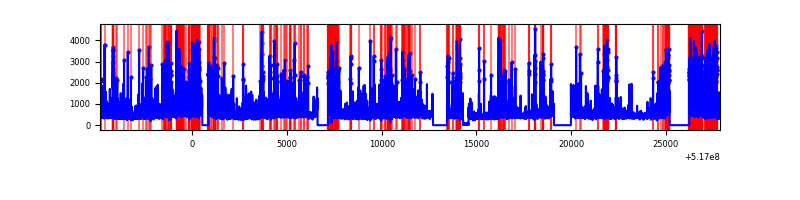 |
| D | 32749 | 29110 | 4482 | 4482 | 13.69% | 15.40% | 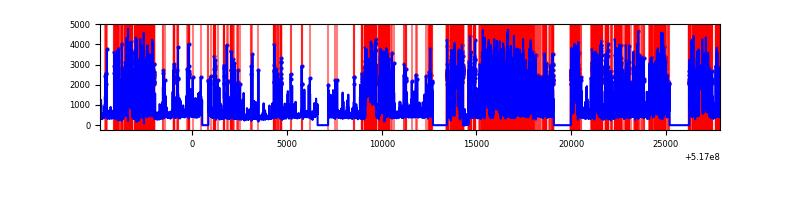 |
Top three noisy pixels from each quadrant. If the there are fewer than three noisy pixels in the level2.evt file, extra rows are filled as -1
| Pixel properties | Quadrant properties | ||||||
|---|---|---|---|---|---|---|---|
| Quadrant | DetID | PixID | Counts | Sigma | Mean | Median | Sigma |
| A | 4 | 249 | 1893888 | 2489.9 | 3085 | 3003 | 759.4 |
| A | 3 | 14 | 327804 | 427.69 | 3085 | 3003 | 759.4 |
| A | 10 | 251 | 232717 | 302.48 | 3085 | 3003 | 759.4 |
| B | 2 | 249 | 1282323 | 1976.74 | 3048 | 2924 | 647.2 |
| B | 0 | 63 | 190516 | 289.84 | 3048 | 2924 | 647.2 |
| B | 7 | 252 | 143935 | 217.87 | 3048 | 2924 | 647.2 |
| C | 15 | 224 | 5471073 | 6835.08 | 2967 | 2933 | 800.0 |
| C | 15 | 198 | 237299 | 292.95 | 2967 | 2933 | 800.0 |
| C | 14 | 245 | 237104 | 292.71 | 2967 | 2933 | 800.0 |
| D | 15 | 142 | 11572353 | 15013.08 | 2726 | 2604 | 770.6 |
| D | 15 | 94 | 1973447 | 2557.4 | 2726 | 2604 | 770.6 |
| D | 2 | 249 | 1105252 | 1430.81 | 2726 | 2604 | 770.6 |
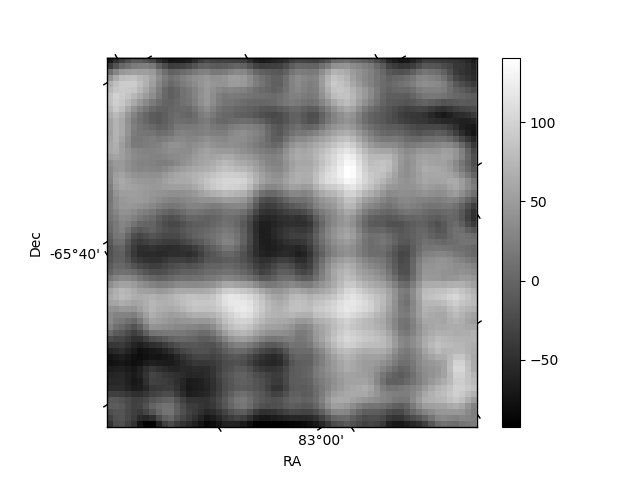
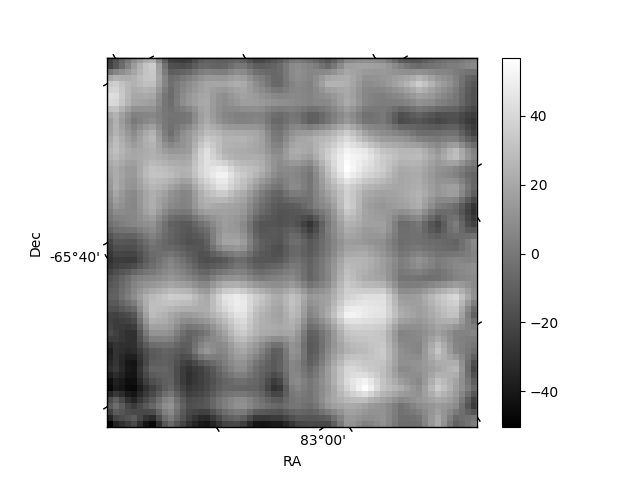
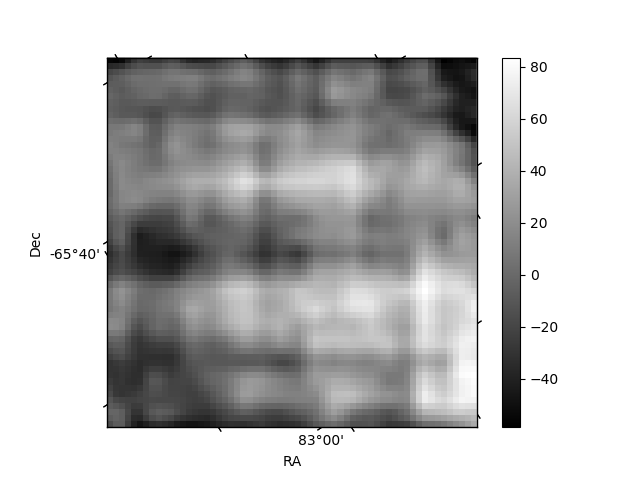
Histogram calculated using DETX and DETY for each event in the final _common_clean file
| Quadrant A | 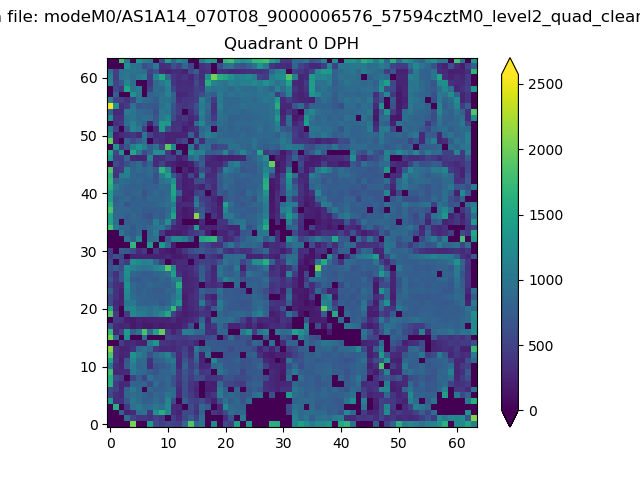 |
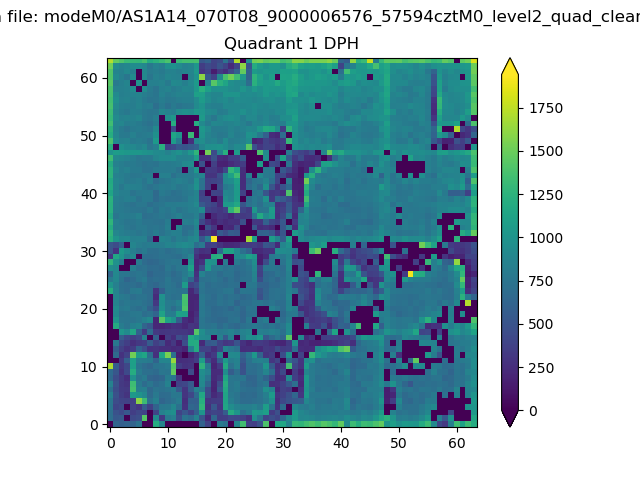 |
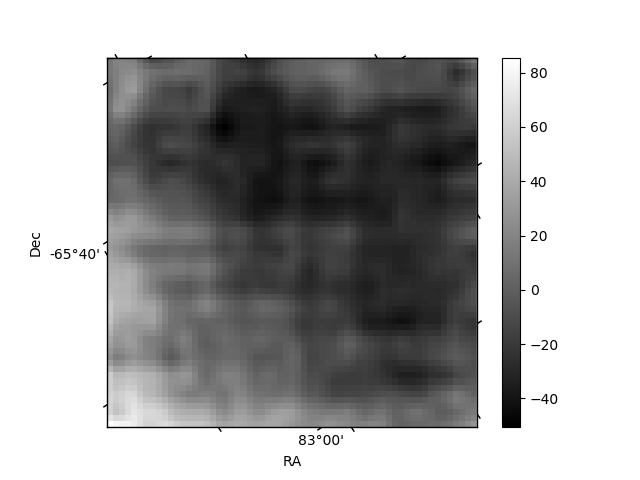
Quadrant B |
|---|---|---|---|
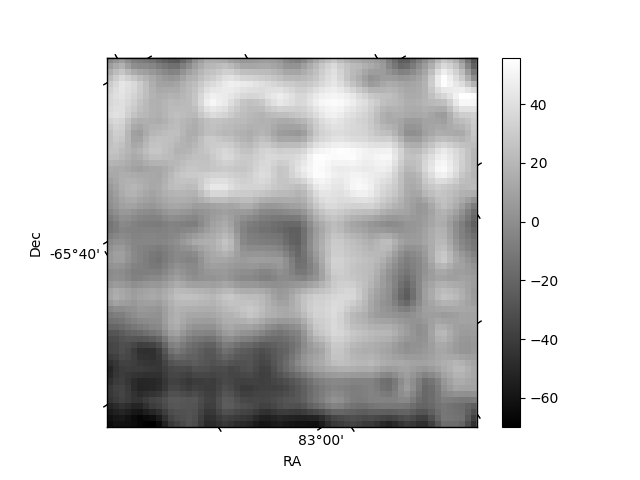
| Quadrant D | 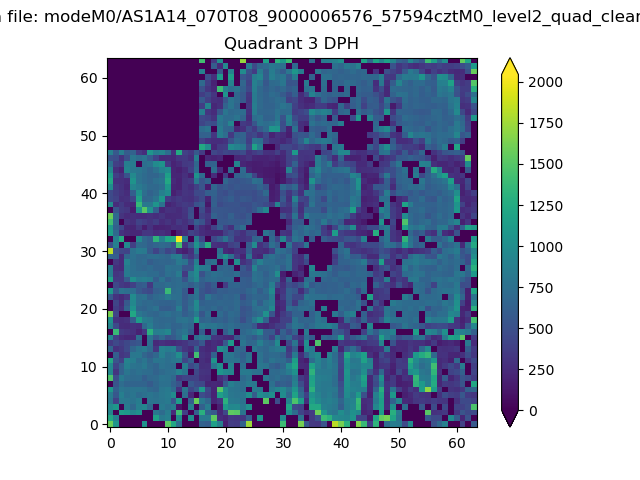 |
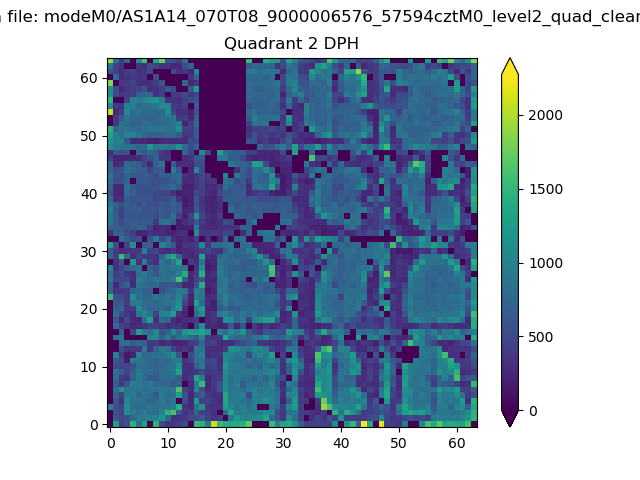 |
Quadrant C |
| Plot type | Count rate plots | Images |
|---|---|---|
| Comparison with Poisson distribution Blue bars denote a histogram of data divided into 1 sec bins. Red curve is a Poisson curve with rate = median count rate of data. |
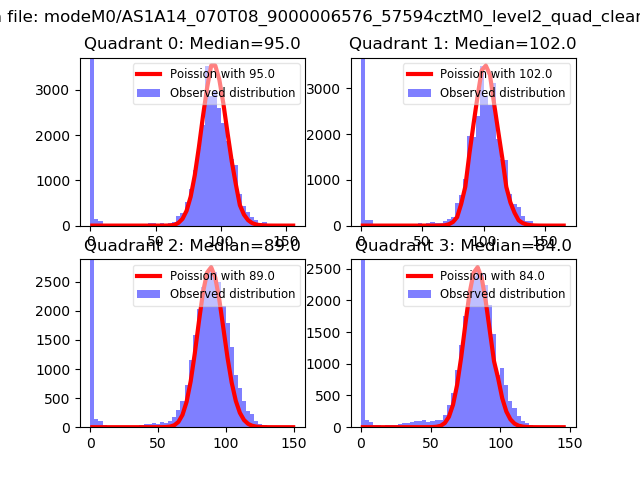 |
 |
| Quadrant-wise count rates Data is divided into 100 sec bins |
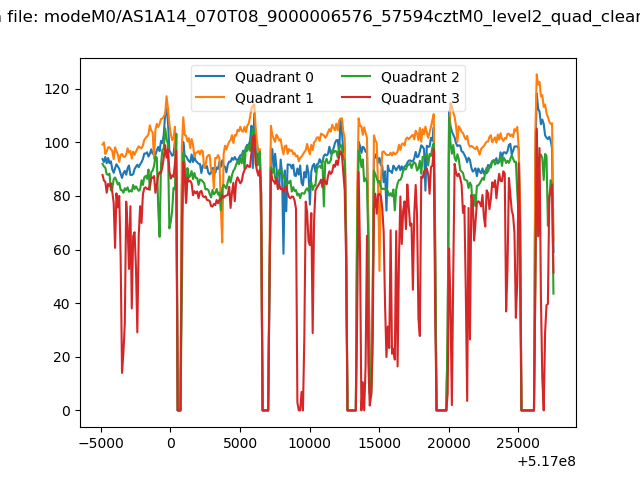 |
|
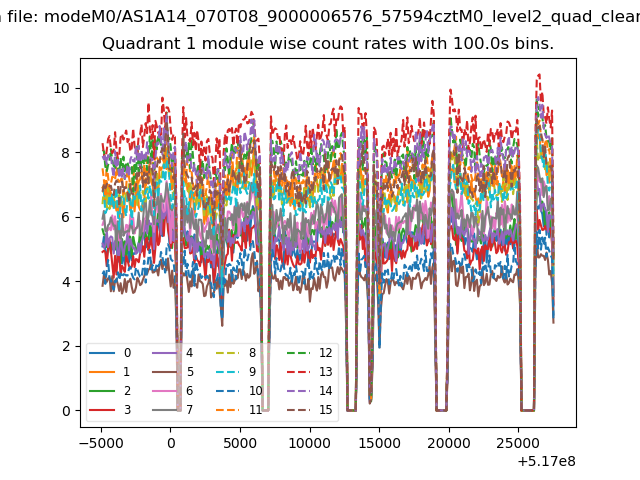
| Module-wise count rates for Quadrant A Data is divided into 100 sec bins |
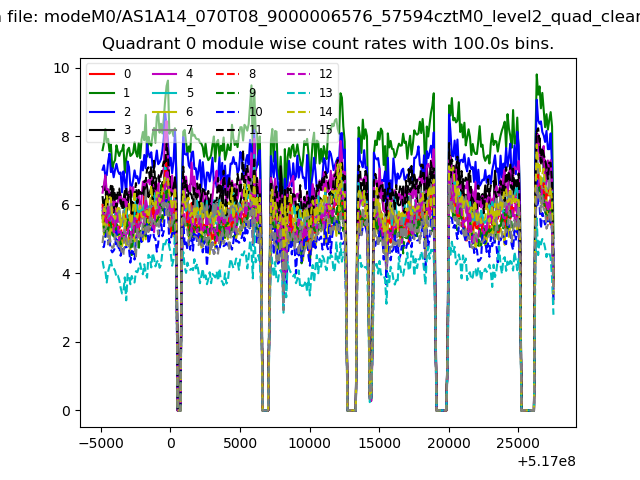 |
 |
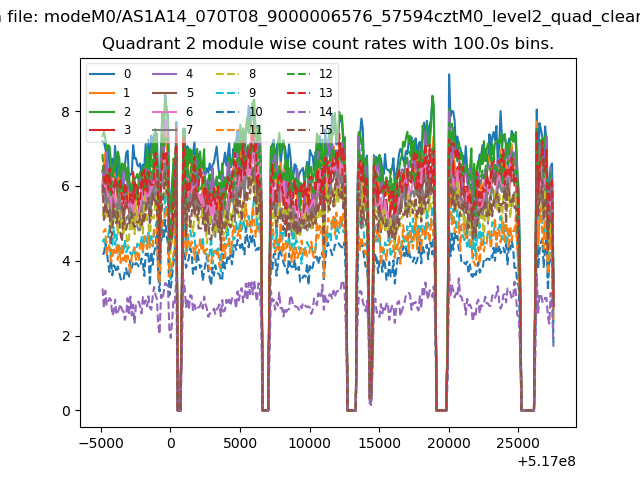
| Module-wise count rates for Quadrant B Data is divided into 100 sec bins |
 |
 |
| Module-wise count rates for Quadrant C Data is divided into 100 sec bins |
 |
 |
| Module-wise count rates for Quadrant D Data is divided into 100 sec bins |
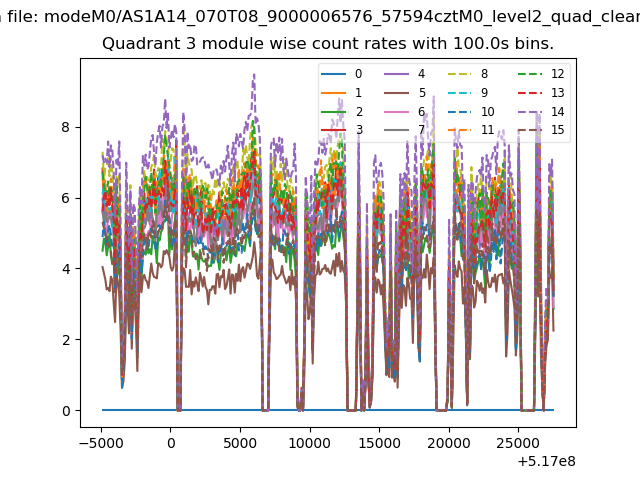 |
 |
| Parameter | Plot |
|---|---|
| CZT HV Monitor | 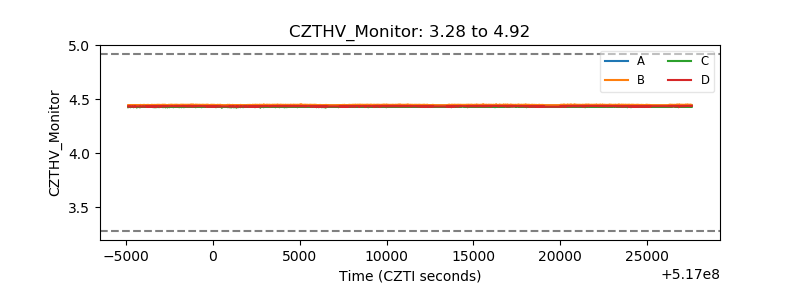 |
| D_VDD | 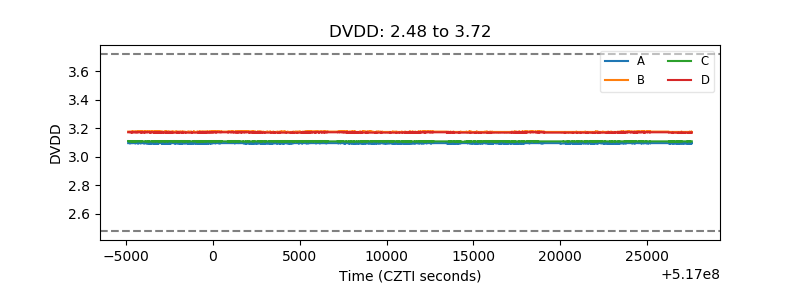 |
| Temperature 1 | 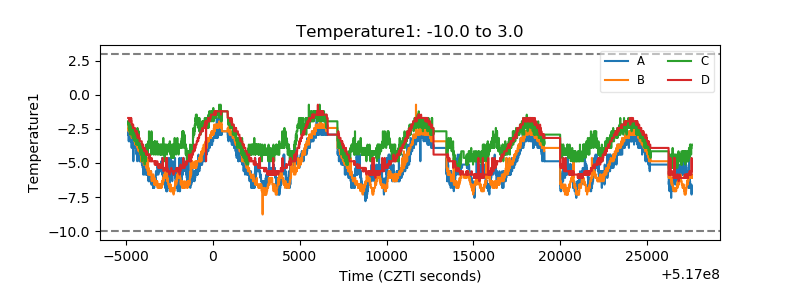 |
| Veto HV Monitor | 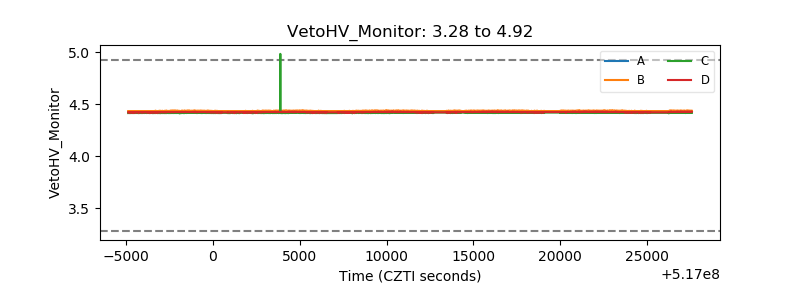 |
| Veto LLD | 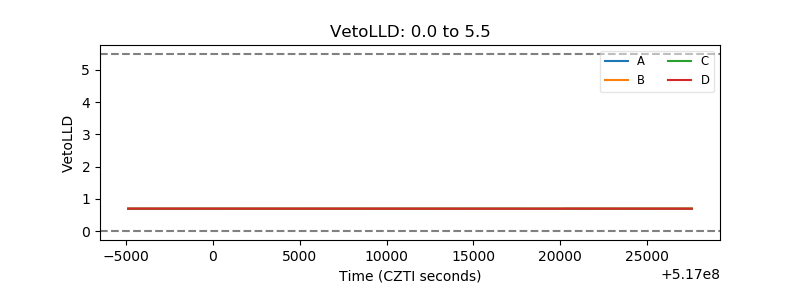 |
| Alpha Counter | 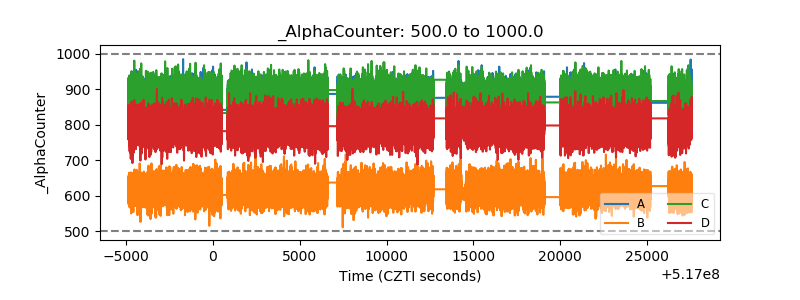 |
| _CPM_Rate | 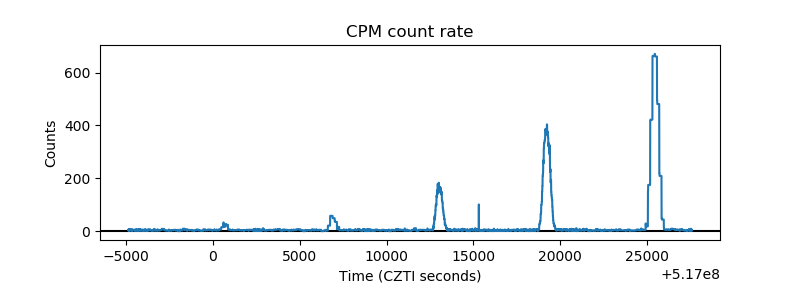 |
| CZT Counter | 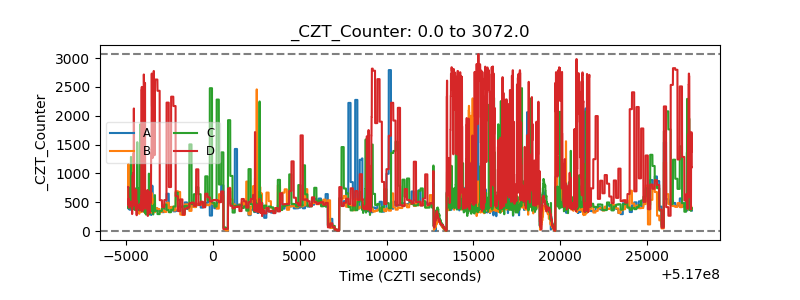 |
| +2.5 Volts monitor | 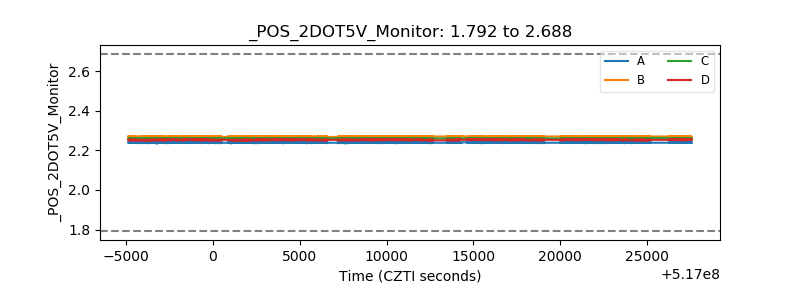 |
| +5 Volts monitor | 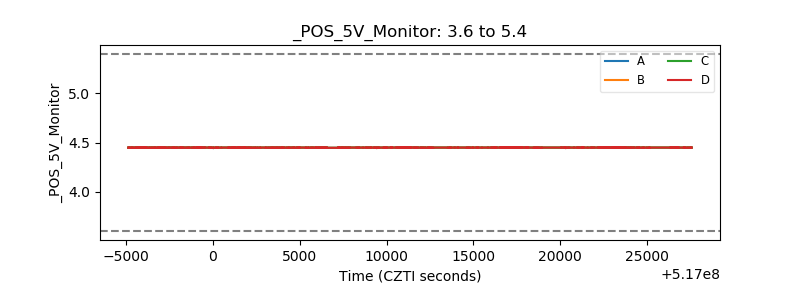 |
| _ROLL_ROT | 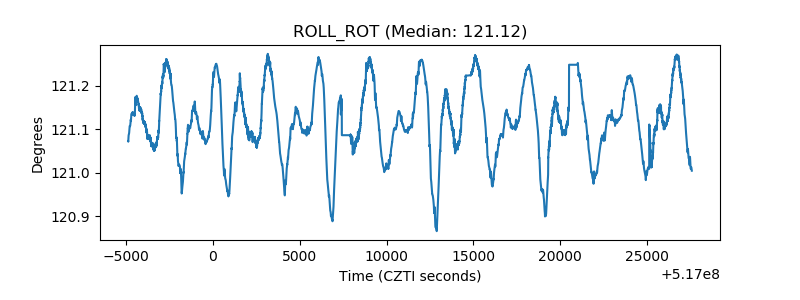 |
| _Roll_DEC | 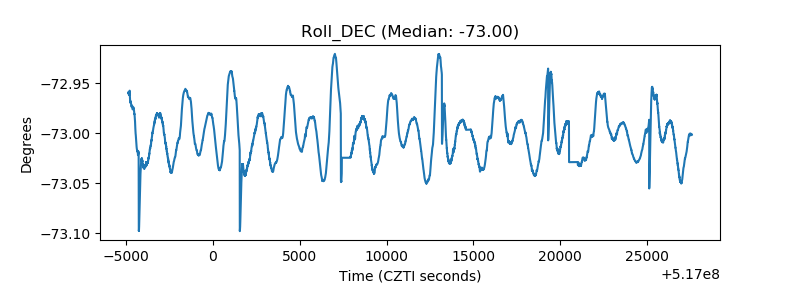 |
| _Roll_RA | 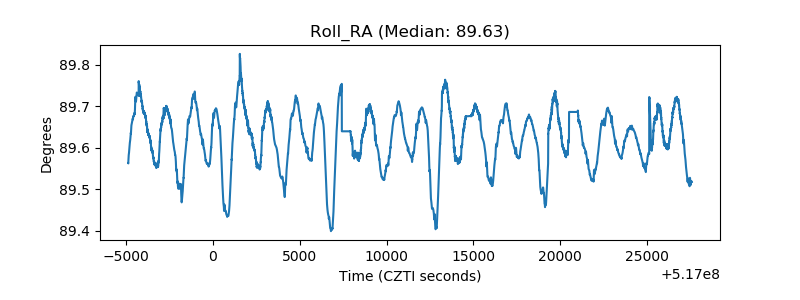 |
| Veto Counter | 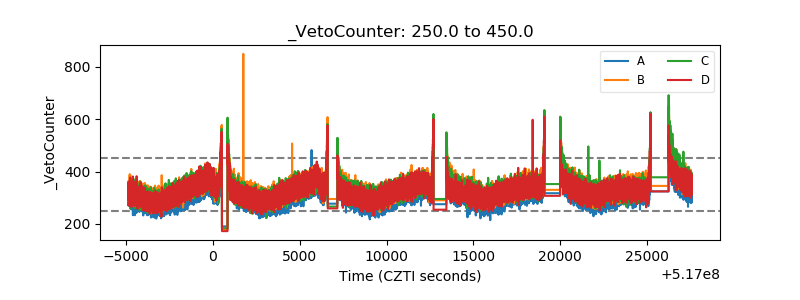 |