| Param | Original file | Final file |
|---|---|---|
| Filename | modeM0/AS1A14_070T08_9000006576_57595cztM0_level2.fits | modeM0/AS1A14_070T08_9000006576_57595cztM0_level2_quad_clean.evt |
| Size (bytes) | 562,043,520 | 96,148,800 |
| Size | 536.0 MB | 91.7 MB |
| Events in quadrant A | 3,071,155 | 670,325 |
| Events in quadrant B | 3,144,644 | 723,078 |
| Events in quadrant C | 6,387,264 | 585,767 |
| Events in quadrant D | 7,687,793 | 471,150 |
| Mode M0 | |||
|---|---|---|---|
| Quadrant | BADHDUFLAG | Total packets | Discarded packets |
| A | 0 | 13681 | 2 |
| B | 0 | 13975 | 2 |
| C | 0 | 23592 | 2 |
| D | 0 | 27428 | 2 |
| Mode M9 | |||
|---|---|---|---|
| Quadrant | BADHDUFLAG | Total packets | Discarded packets |
| A | 0 | 16 | 0 |
| B | 0 | 17 | 0 |
| C | 0 | 17 | 0 |
| D | 0 | 17 | 0 |
| Mode SS | |||
|---|---|---|---|
| Quadrant | BADHDUFLAG | Total packets | Discarded packets |
| A | 0 | 132 | 0 |
| B | 0 | 132 | 0 |
| C | 0 | 132 | 0 |
| D | 0 | 132 | 0 |
| Quadrant | Total seconds | Saturated seconds | Saturation percentage |
|---|---|---|---|
| A | 6621 | 39 | 0.589035% |
| B | 6621 | 54 | 0.815587% |
| C | 6621 | 795 | 12.007250% |
| D | 6621 | 1560 | 23.561396% |
Noise dominated data is calculated using 1-second bins in cleaned event files. If a bin has >2000 counts, and if more than 50% of those come from <1% of pixels, then it is considered to be noise-dominated and hence unusable.
| Quadrant | # 1 sec bins | Bins with >0 counts | Bins with >2000 counts | High rate bins dominated by noise | Noise dominated (total time) | Noise dominated (detector-on time) | Marked lightcurve |
|---|---|---|---|---|---|---|---|
| A | 7751 | 6622 | 2 | 2 | 0.03% | 0.03% | 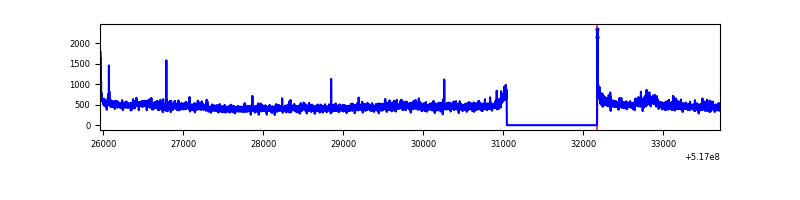 |
| B | 7751 | 6622 | 12 | 12 | 0.15% | 0.18% | 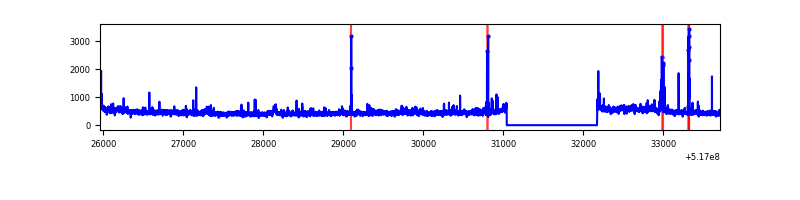 |
| C | 7751 | 6622 | 623 | 623 | 8.04% | 9.41% | 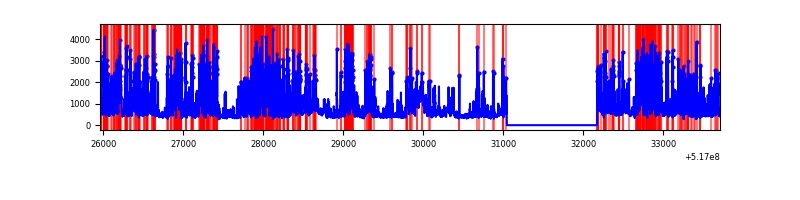 |
| D | 7751 | 6622 | 1524 | 1524 | 19.66% | 23.01% | 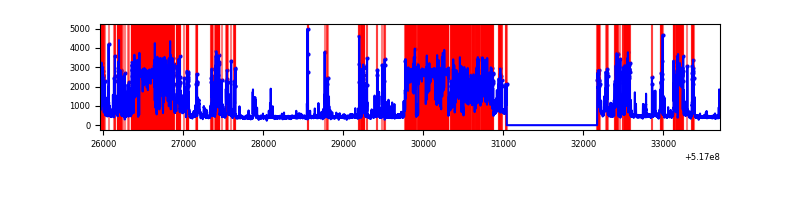 |
Top three noisy pixels from each quadrant. If the there are fewer than three noisy pixels in the level2.evt file, extra rows are filled as -1
| Pixel properties | Quadrant properties | ||||||
|---|---|---|---|---|---|---|---|
| Quadrant | DetID | PixID | Counts | Sigma | Mean | Median | Sigma |
| A | 3 | 14 | 158803 | 876.81 | 730 | 713 | 180.3 |
| A | 3 | 128 | 38989 | 212.29 | 730 | 713 | 180.3 |
| A | 3 | 49 | 36665 | 199.4 | 730 | 713 | 180.3 |
| B | 0 | 63 | 92258 | 595.9 | 724 | 696 | 153.7 |
| B | 10 | 247 | 50654 | 325.13 | 724 | 696 | 153.7 |
| B | 4 | 201 | 26160 | 165.72 | 724 | 696 | 153.7 |
| C | 15 | 224 | 3028026 | 16353.59 | 684 | 677 | 185.1 |
| C | 12 | 2 | 456536 | 2462.53 | 684 | 677 | 185.1 |
| C | 14 | 245 | 98679 | 529.4 | 684 | 677 | 185.1 |
| D | 15 | 142 | 4615123 | 26365.14 | 622 | 592 | 175.0 |
| D | 2 | 249 | 172150 | 980.2 | 622 | 592 | 175.0 |
| D | 8 | 240 | 136503 | 776.53 | 622 | 592 | 175.0 |
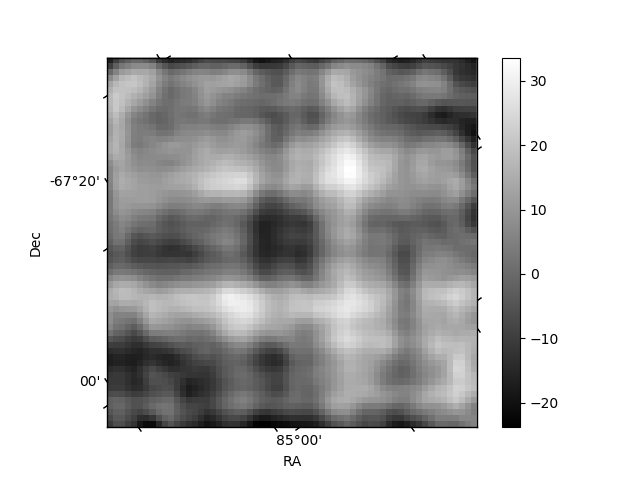
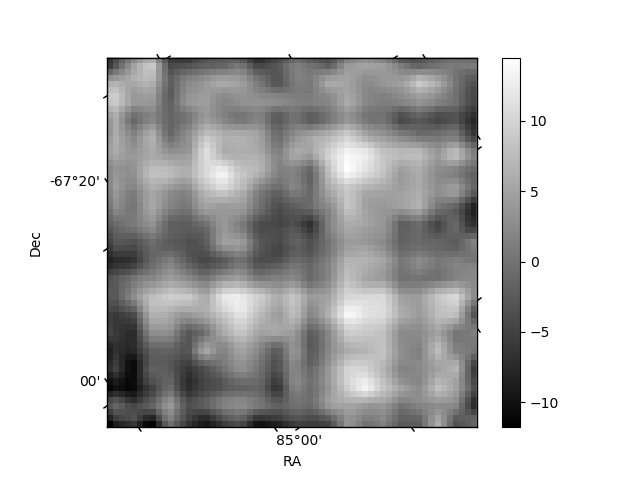
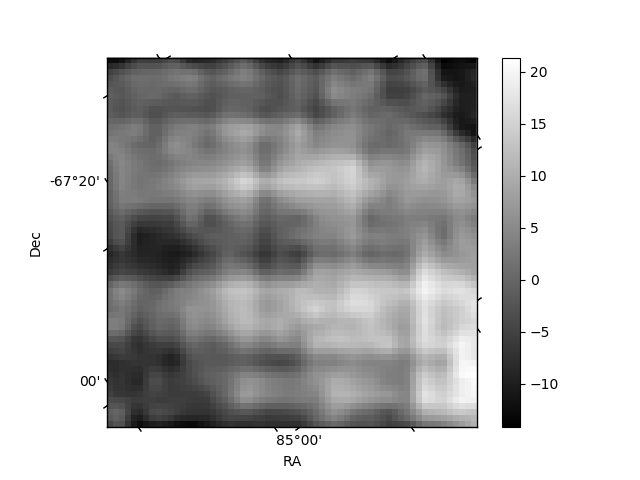
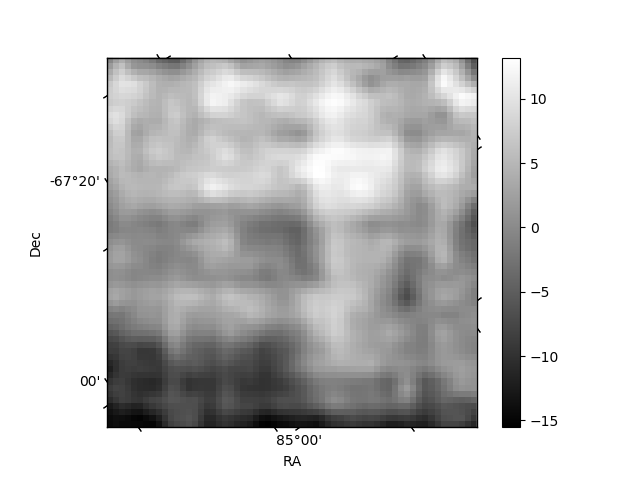
Histogram calculated using DETX and DETY for each event in the final _common_clean file
| Quadrant A | 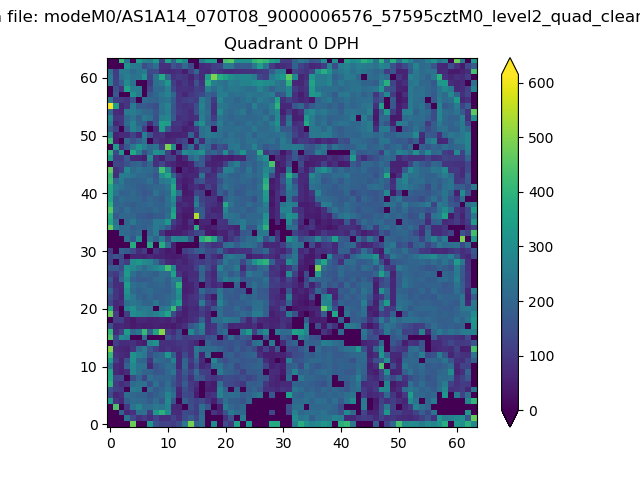 |
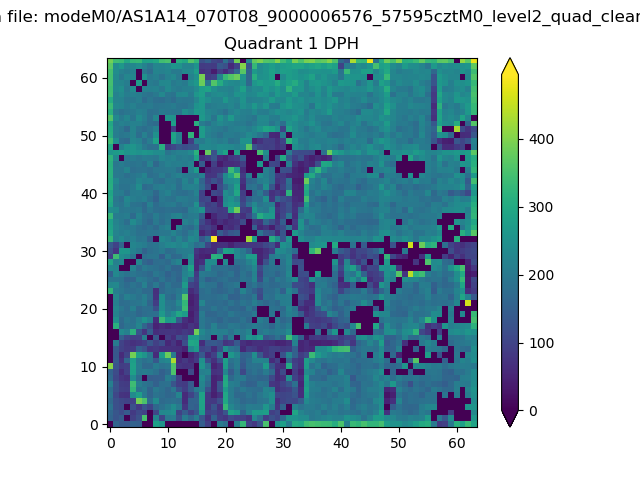 |
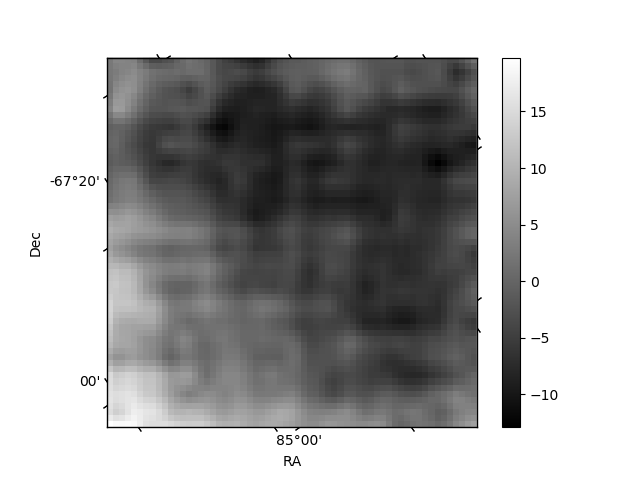
Quadrant B |
|---|---|---|---|
| Quadrant D | 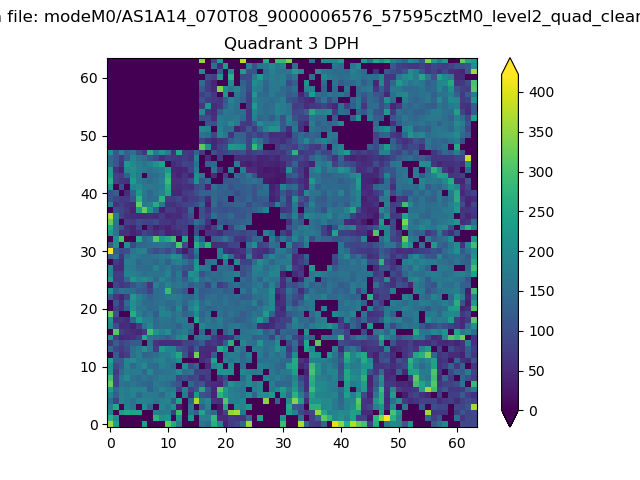 |
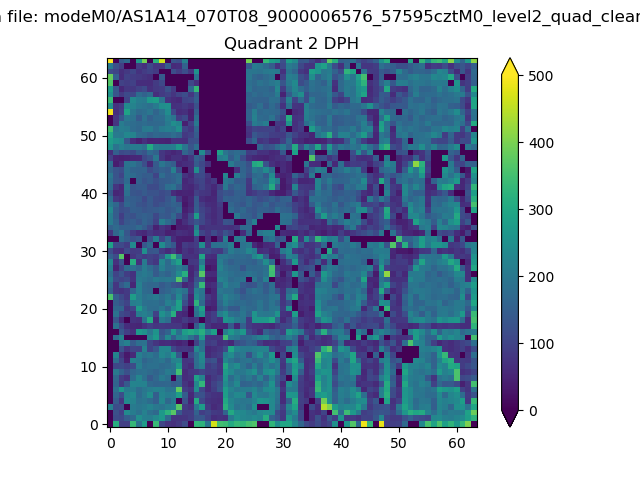 |
Quadrant C |
| Plot type | Count rate plots | Images |
|---|---|---|
| Comparison with Poisson distribution Blue bars denote a histogram of data divided into 1 sec bins. Red curve is a Poisson curve with rate = median count rate of data. |
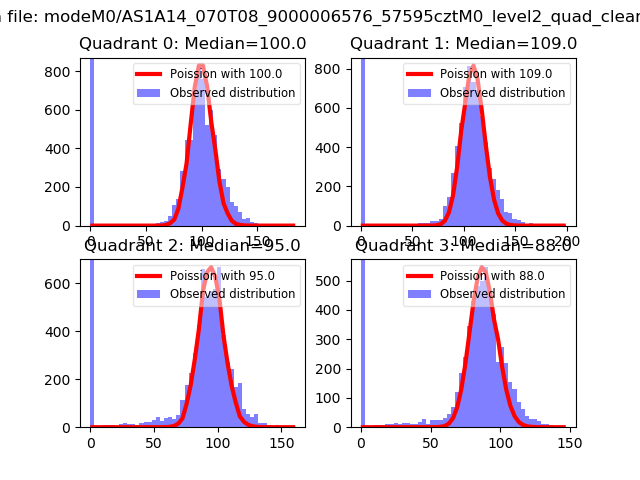 |
 |
| Quadrant-wise count rates Data is divided into 100 sec bins |
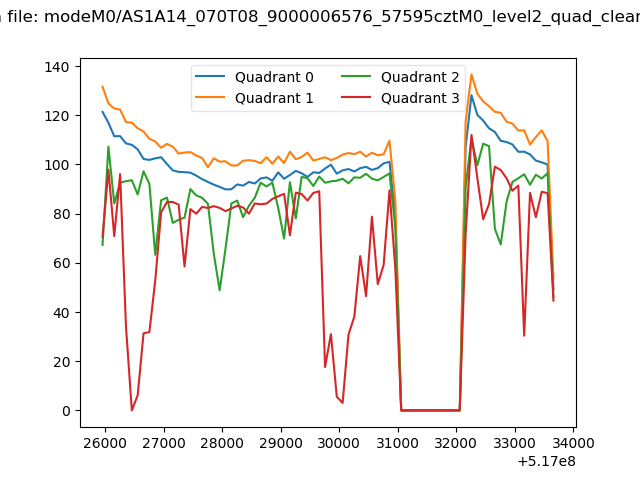 |
|
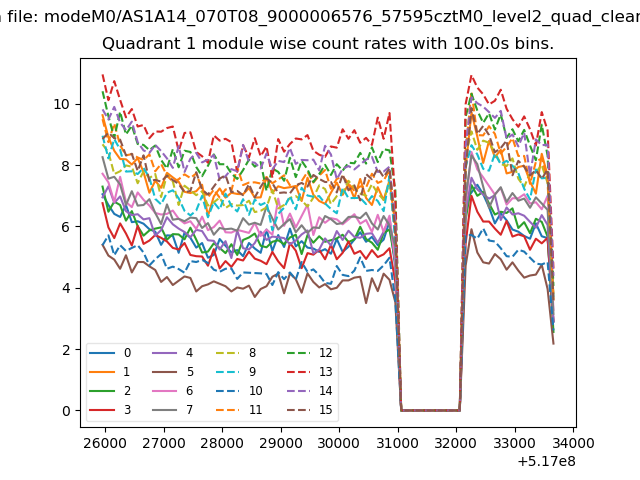
| Module-wise count rates for Quadrant A Data is divided into 100 sec bins |
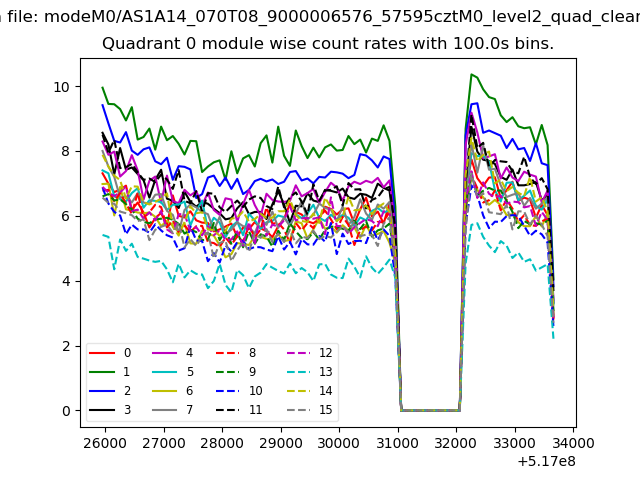 |
 |
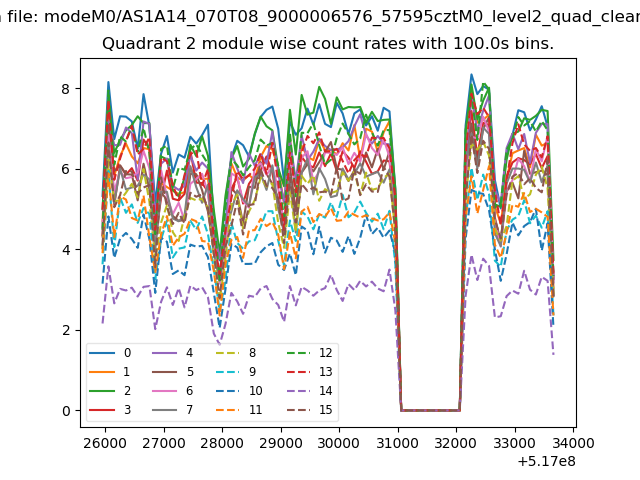
| Module-wise count rates for Quadrant B Data is divided into 100 sec bins |
 |
 |
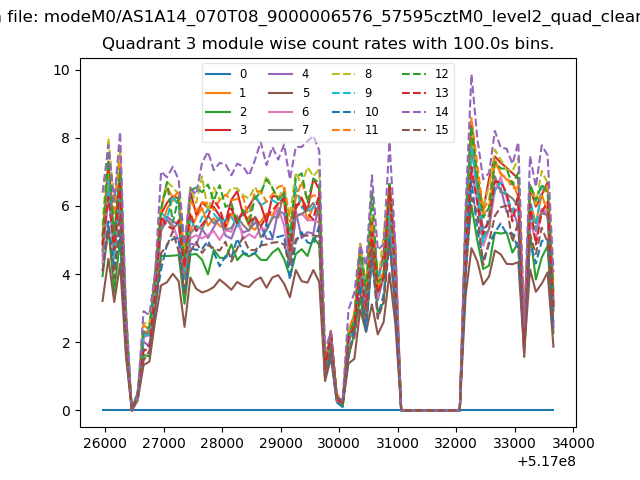
| Module-wise count rates for Quadrant C Data is divided into 100 sec bins |
 |
 |
| Module-wise count rates for Quadrant D Data is divided into 100 sec bins |
 |
 |
| Parameter | Plot |
|---|---|
| CZT HV Monitor | 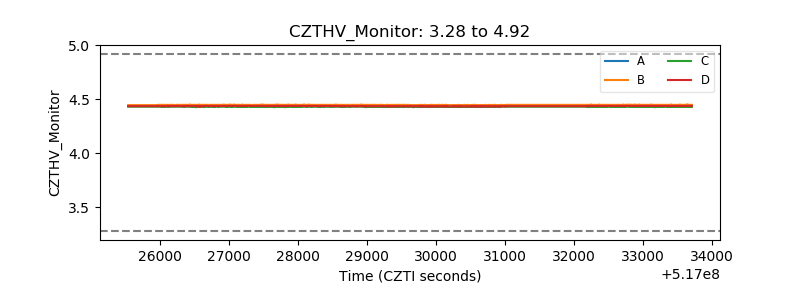 |
| D_VDD | 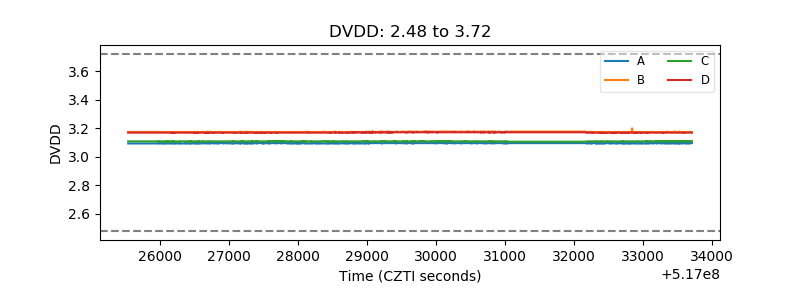 |
| Temperature 1 | 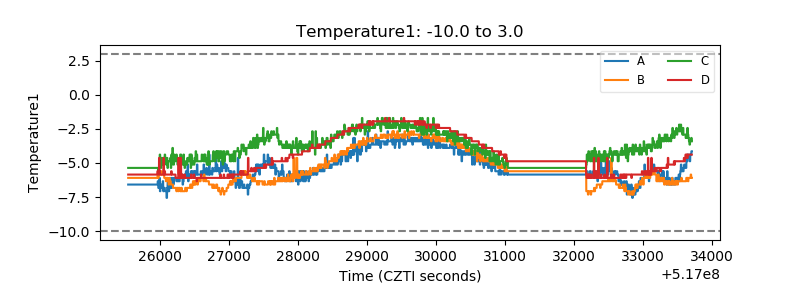 |
| Veto HV Monitor | 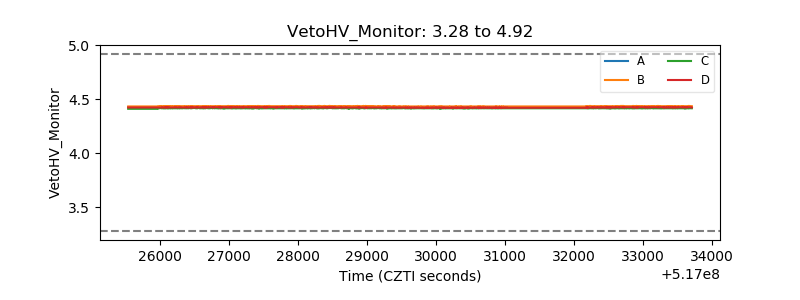 |
| Veto LLD | 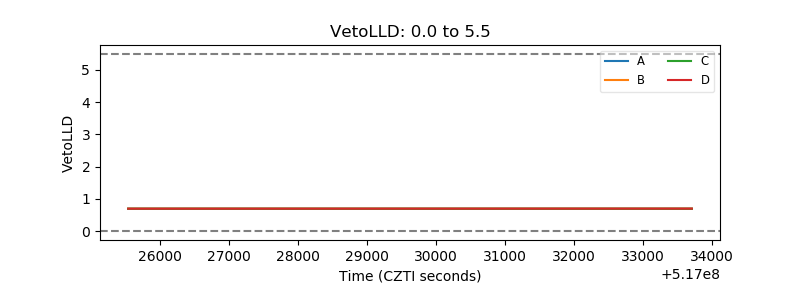 |
| Alpha Counter | 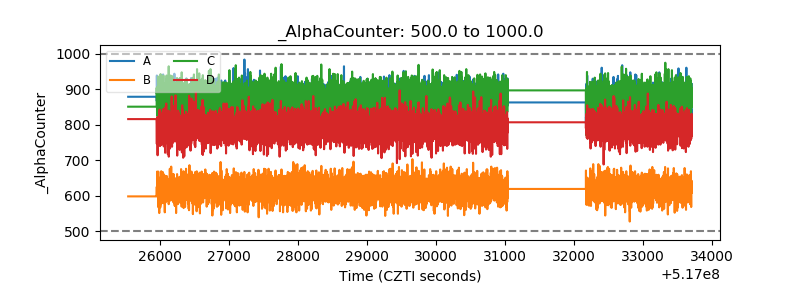 |
| _CPM_Rate | 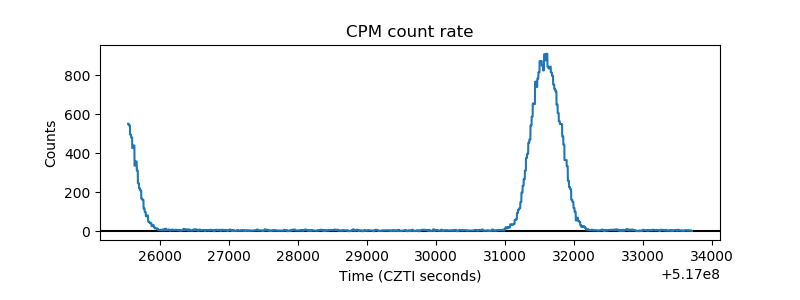 |
| CZT Counter | 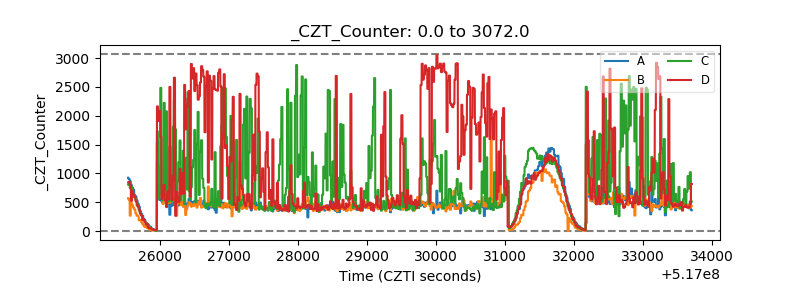 |
| +2.5 Volts monitor | 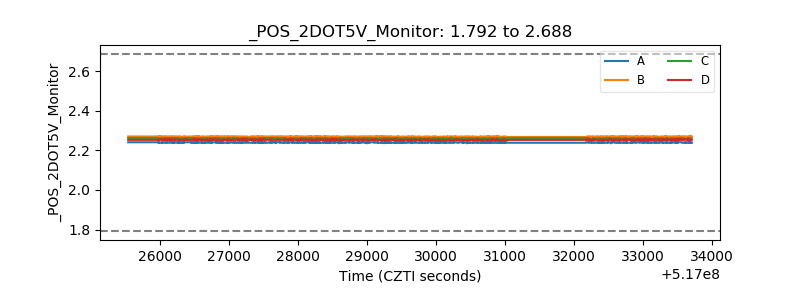 |
| +5 Volts monitor | 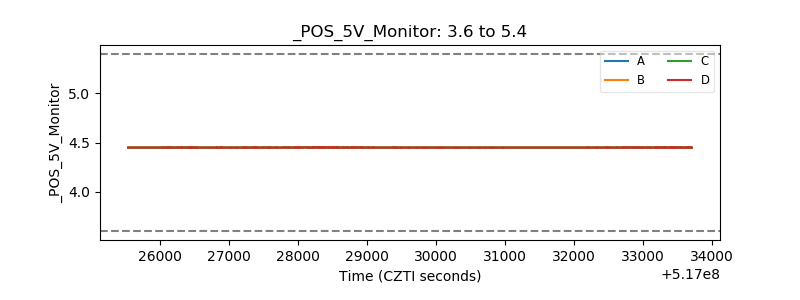 |
| _ROLL_ROT | 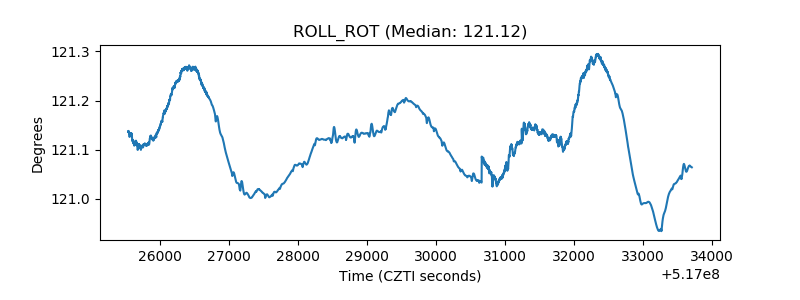 |
| _Roll_DEC | 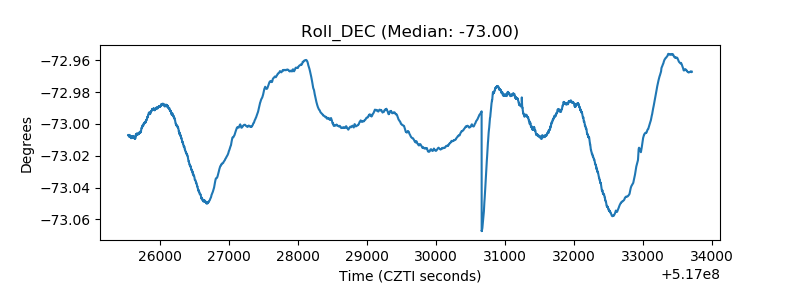 |
| _Roll_RA | 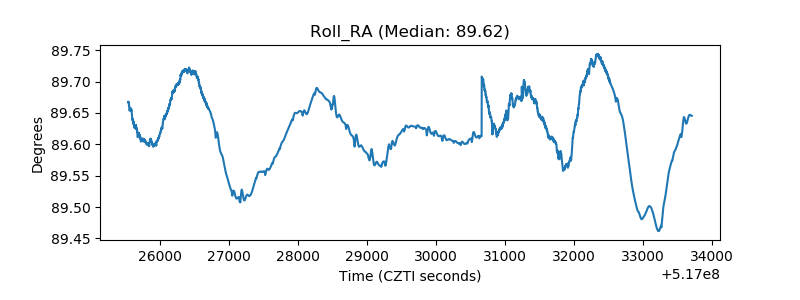 |
| Veto Counter | 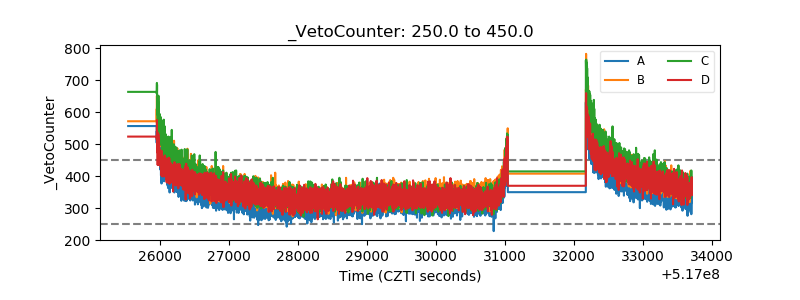 |