| Param | Original file | Final file |
|---|---|---|
| Filename | modeM0/AS1A14_070T08_9000006576_57596cztM0_level2.fits | modeM0/AS1A14_070T08_9000006576_57596cztM0_level2_quad_clean.evt |
| Size (bytes) | 446,696,640 | 98,902,080 |
| Size | 426.0 MB | 94.3 MB |
| Events in quadrant A | 3,472,290 | 660,734 |
| Events in quadrant B | 3,190,648 | 715,211 |
| Events in quadrant C | 4,943,953 | 609,738 |
| Events in quadrant D | 4,431,648 | 563,322 |
| Mode M0 | |||
|---|---|---|---|
| Quadrant | BADHDUFLAG | Total packets | Discarded packets |
| A | 0 | 14472 | 2 |
| B | 0 | 13856 | 2 |
| C | 0 | 19000 | 2 |
| D | 0 | 17570 | 2 |
| Mode M9 | |||
|---|---|---|---|
| Quadrant | BADHDUFLAG | Total packets | Discarded packets |
| A | 0 | 17 | 0 |
| B | 0 | 18 | 0 |
| C | 0 | 18 | 0 |
| D | 0 | 18 | 0 |
| Mode SS | |||
|---|---|---|---|
| Quadrant | BADHDUFLAG | Total packets | Discarded packets |
| A | 0 | 130 | 0 |
| B | 0 | 130 | 0 |
| C | 0 | 130 | 0 |
| D | 0 | 130 | 0 |
| Quadrant | Total seconds | Saturated seconds | Saturation percentage |
|---|---|---|---|
| A | 6391 | 49 | 0.766703% |
| B | 6391 | 62 | 0.970114% |
| C | 6391 | 420 | 6.571742% |
| D | 6391 | 404 | 6.321389% |
Noise dominated data is calculated using 1-second bins in cleaned event files. If a bin has >2000 counts, and if more than 50% of those come from <1% of pixels, then it is considered to be noise-dominated and hence unusable.
| Quadrant | # 1 sec bins | Bins with >0 counts | Bins with >2000 counts | High rate bins dominated by noise | Noise dominated (total time) | Noise dominated (detector-on time) | Marked lightcurve |
|---|---|---|---|---|---|---|---|
| A | 7601 | 6392 | 9 | 9 | 0.12% | 0.14% | 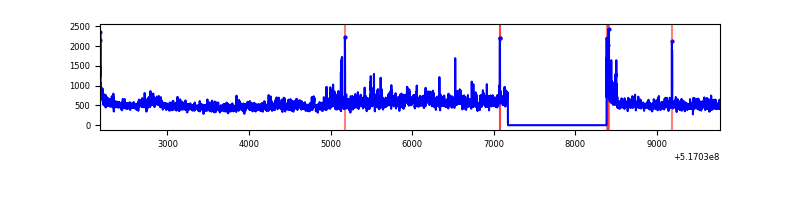 |
| B | 7601 | 6392 | 21 | 21 | 0.28% | 0.33% | 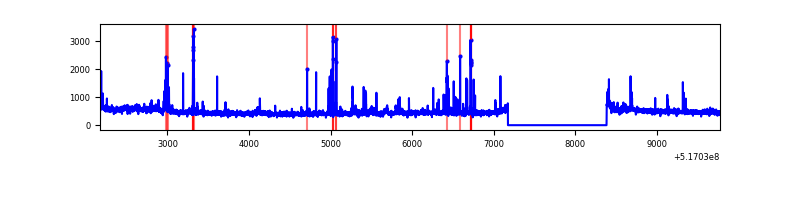 |
| C | 7601 | 6392 | 324 | 324 | 4.26% | 5.07% | 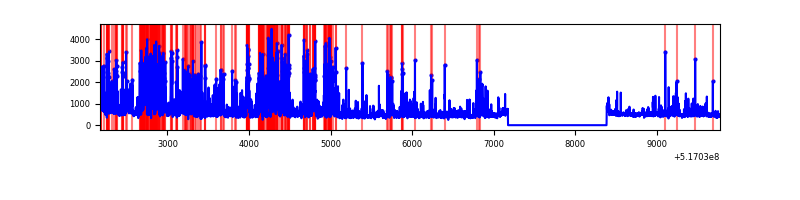 |
| D | 7601 | 6392 | 351 | 351 | 4.62% | 5.49% | 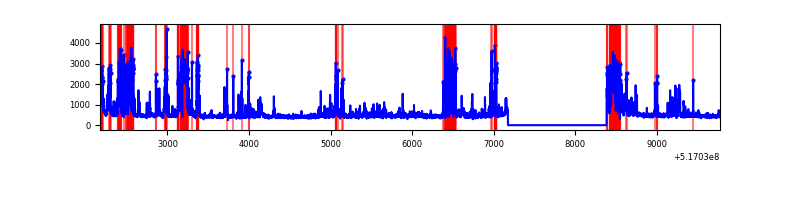 |
Top three noisy pixels from each quadrant. If the there are fewer than three noisy pixels in the level2.evt file, extra rows are filled as -1
| Pixel properties | Quadrant properties | ||||||
|---|---|---|---|---|---|---|---|
| Quadrant | DetID | PixID | Counts | Sigma | Mean | Median | Sigma |
| A | 3 | 14 | 575818 | 3243.44 | 717 | 700 | 177.3 |
| A | 7 | 160 | 35325 | 195.27 | 717 | 700 | 177.3 |
| A | 10 | 251 | 31554 | 174.0 | 717 | 700 | 177.3 |
| B | 0 | 63 | 111500 | 739.33 | 710 | 684 | 149.9 |
| B | 10 | 247 | 47579 | 312.87 | 710 | 684 | 149.9 |
| B | 7 | 252 | 35097 | 229.59 | 710 | 684 | 149.9 |
| C | 15 | 224 | 1935309 | 10283.24 | 688 | 683 | 188.1 |
| C | 14 | 254 | 162008 | 857.5 | 688 | 683 | 188.1 |
| C | 12 | 252 | 64575 | 339.61 | 688 | 683 | 188.1 |
| D | 15 | 142 | 1223075 | 6387.32 | 677 | 643 | 191.4 |
| D | 8 | 160 | 191707 | 998.33 | 677 | 643 | 191.4 |
| D | 2 | 249 | 123204 | 640.39 | 677 | 643 | 191.4 |
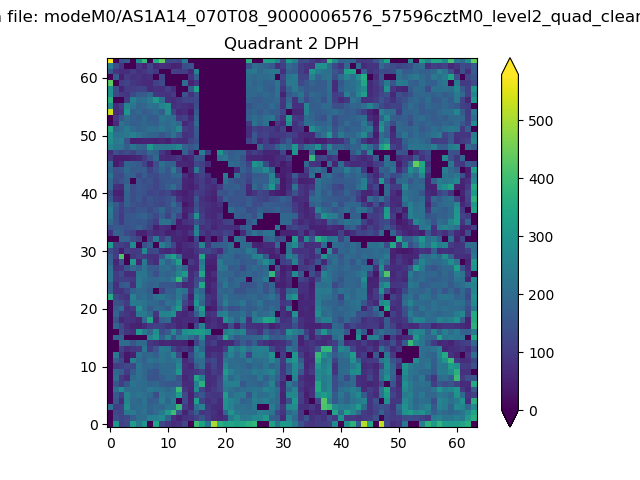
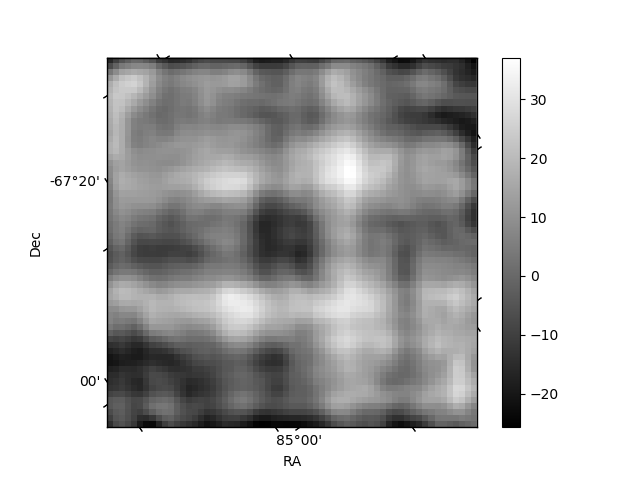
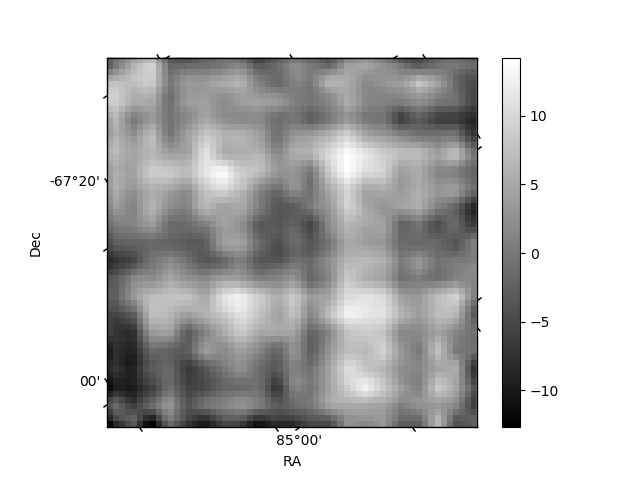
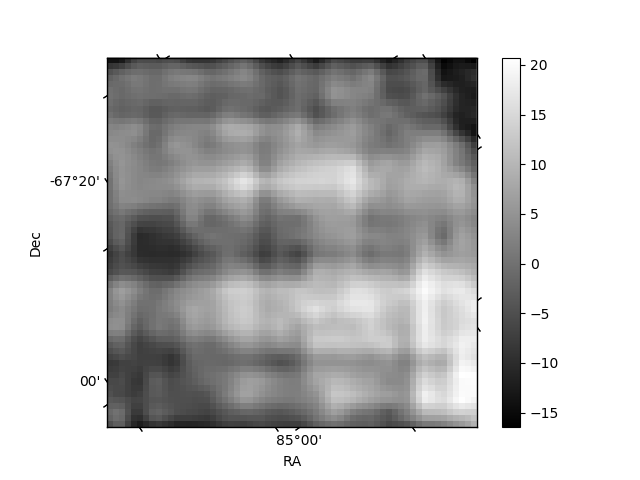
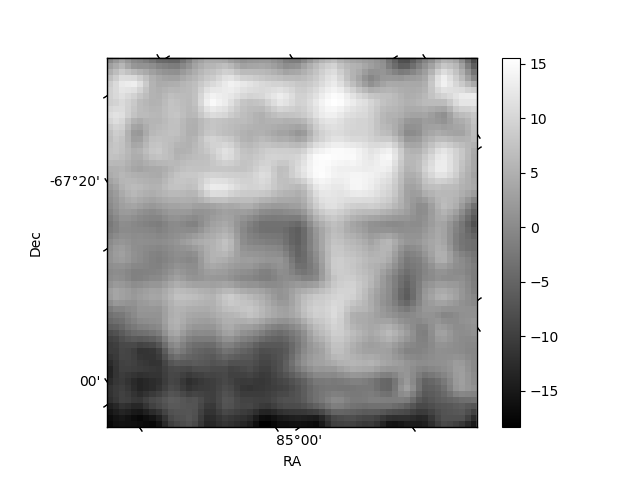
Histogram calculated using DETX and DETY for each event in the final _common_clean file
| Quadrant A | 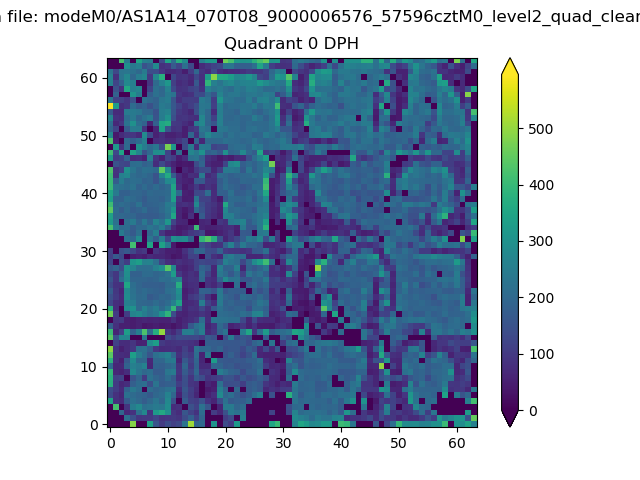 |
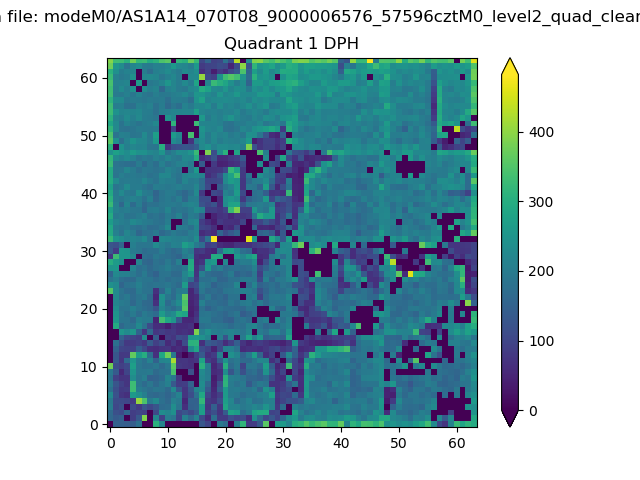 |
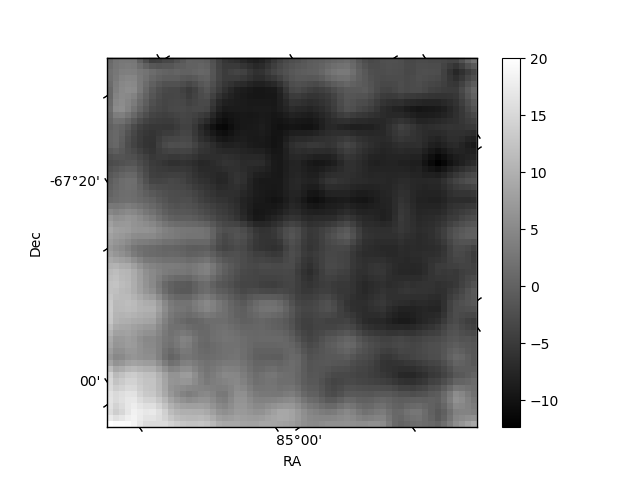
Quadrant B |
|---|---|---|---|
| Quadrant D | 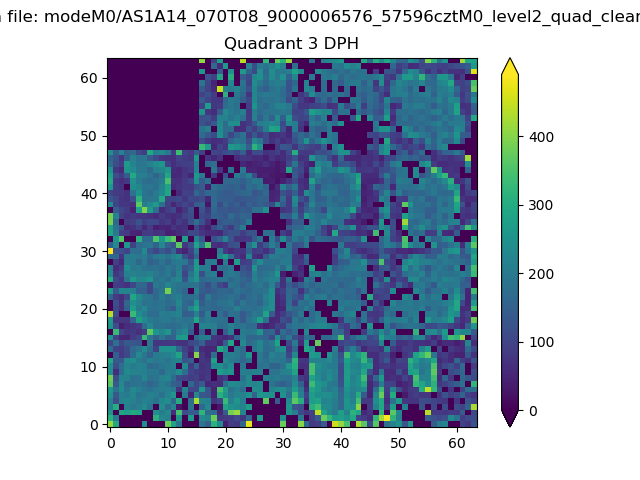 |
 |
Quadrant C |
| Plot type | Count rate plots | Images |
|---|---|---|
| Comparison with Poisson distribution Blue bars denote a histogram of data divided into 1 sec bins. Red curve is a Poisson curve with rate = median count rate of data. |
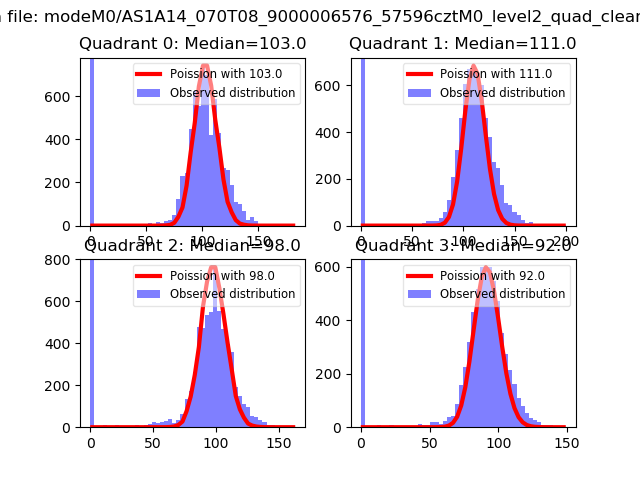 |
 |
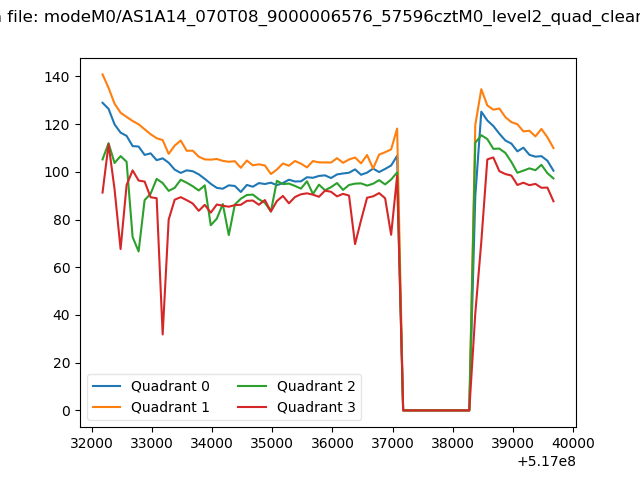
| Quadrant-wise count rates Data is divided into 100 sec bins |
 |
|
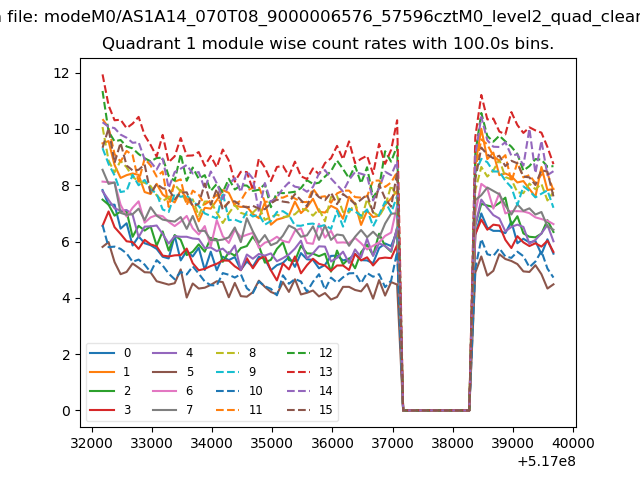
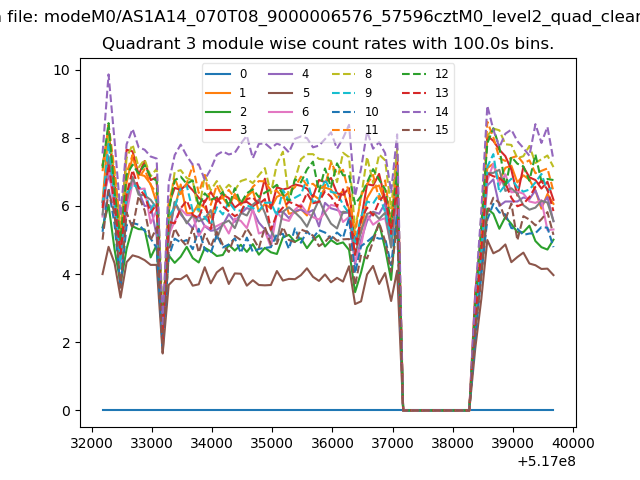
| Module-wise count rates for Quadrant A Data is divided into 100 sec bins |
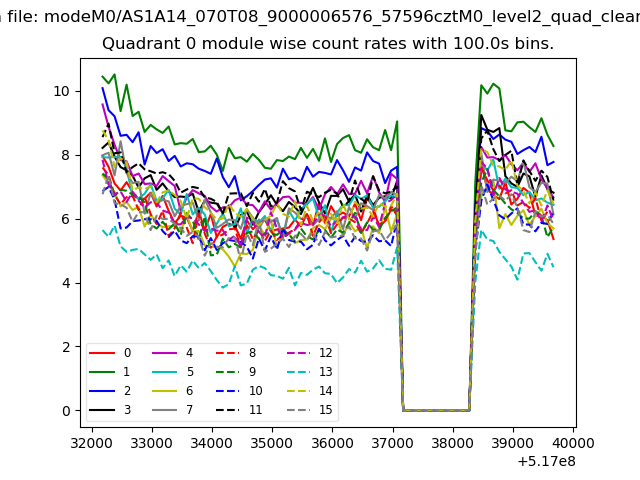 |
 |
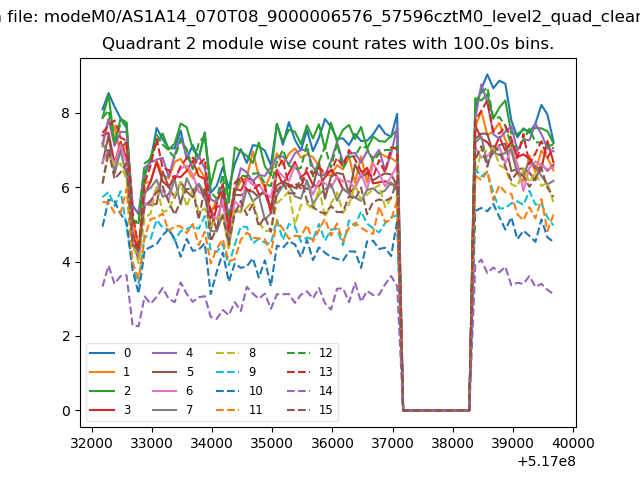
| Module-wise count rates for Quadrant B Data is divided into 100 sec bins |
 |
 |
| Module-wise count rates for Quadrant C Data is divided into 100 sec bins |
 |
 |
| Module-wise count rates for Quadrant D Data is divided into 100 sec bins |
 |
 |
| Parameter | Plot |
|---|---|
| CZT HV Monitor | 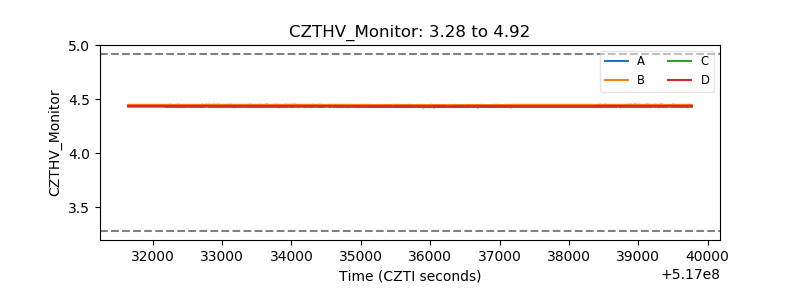 |
| D_VDD | 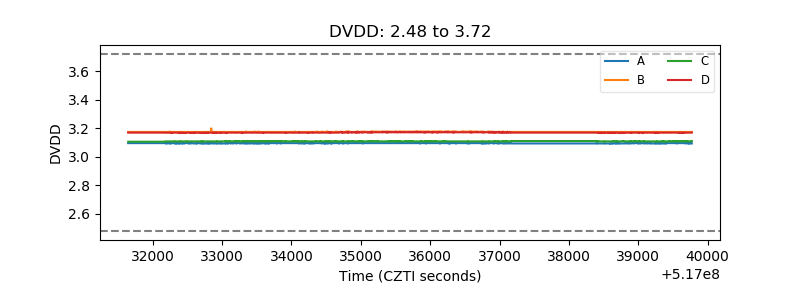 |
| Temperature 1 | 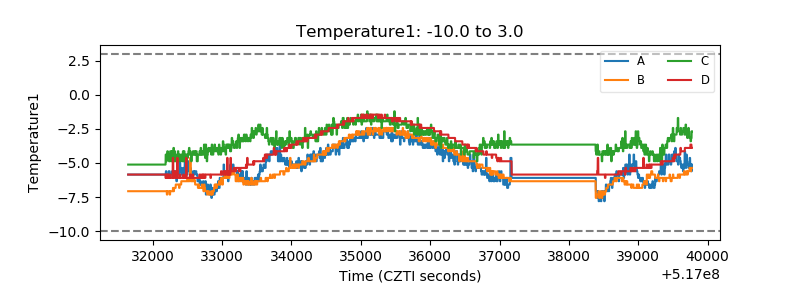 |
| Veto HV Monitor | 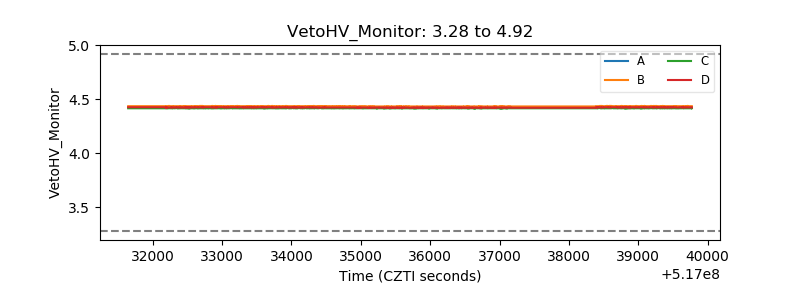 |
| Veto LLD | 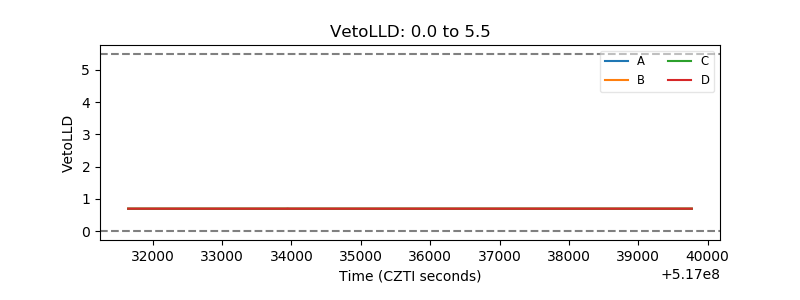 |
| Alpha Counter | 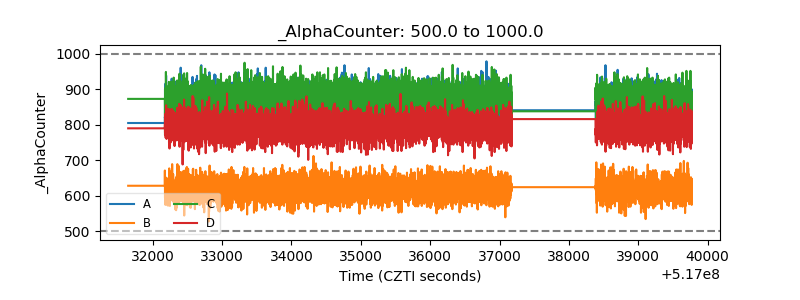 |
| _CPM_Rate | 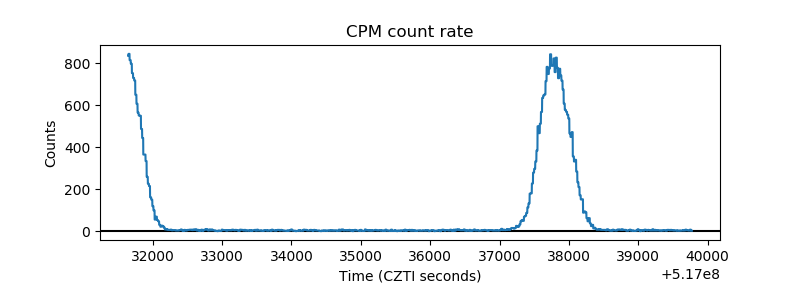 |
| CZT Counter | 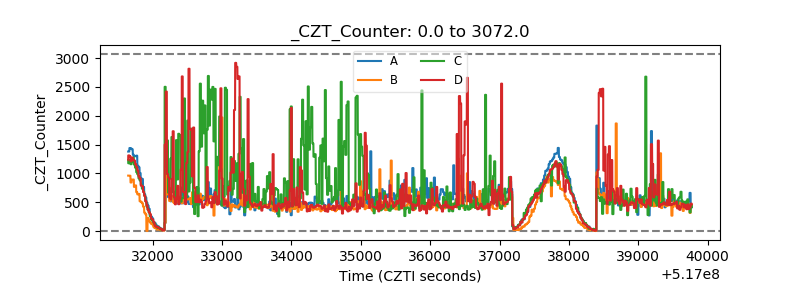 |
| +2.5 Volts monitor |  |
| +5 Volts monitor | 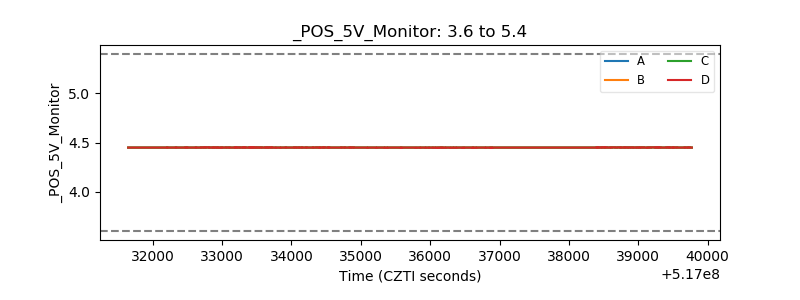 |
| _ROLL_ROT | 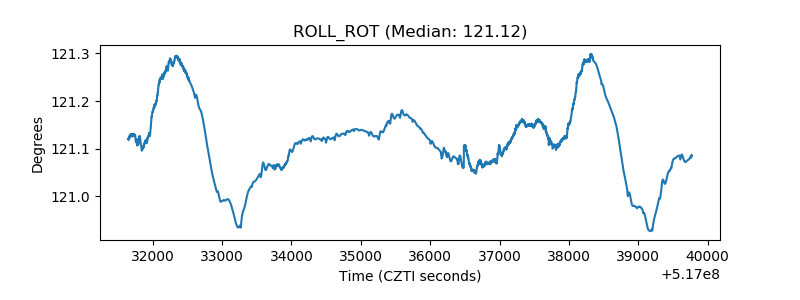 |
| _Roll_DEC | 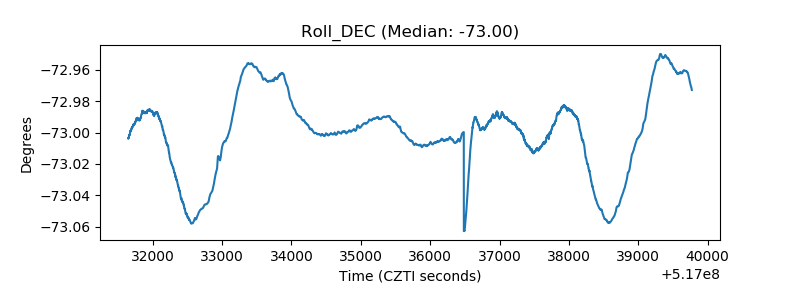 |
| _Roll_RA | 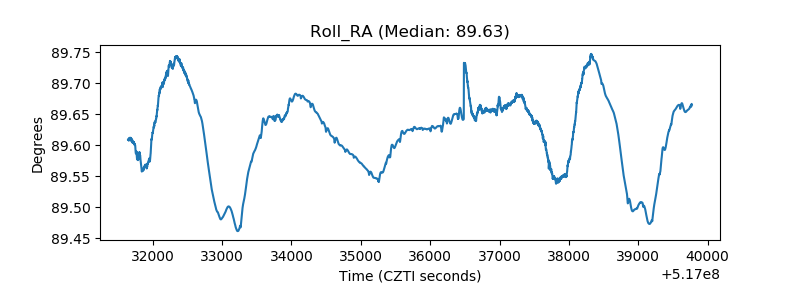 |
| Veto Counter | 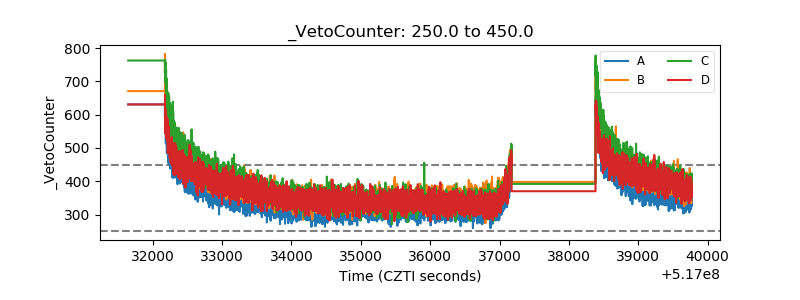 |