| Param | Original file | Final file |
|---|---|---|
| Filename | modeM0/AS1A14_070T08_9000006576_57597cztM0_level2.fits | modeM0/AS1A14_070T08_9000006576_57597cztM0_level2_quad_clean.evt |
| Size (bytes) | 404,461,440 | 100,788,480 |
| Size | 385.7 MB | 96.1 MB |
| Events in quadrant A | 3,244,633 | 666,805 |
| Events in quadrant B | 3,369,092 | 719,312 |
| Events in quadrant C | 3,190,781 | 645,238 |
| Events in quadrant D | 4,660,282 | 566,605 |
| Mode M0 | |||
|---|---|---|---|
| Quadrant | BADHDUFLAG | Total packets | Discarded packets |
| A | 0 | 13968 | 6 |
| B | 0 | 14317 | 2 |
| C | 0 | 14136 | 2 |
| D | 0 | 18401 | 2 |
| Mode M9 | |||
|---|---|---|---|
| Quadrant | BADHDUFLAG | Total packets | Discarded packets |
| A | 0 | 11 | 0 |
| B | 0 | 11 | 0 |
| C | 0 | 11 | 0 |
| D | 0 | 11 | 0 |
| Mode SS | |||
|---|---|---|---|
| Quadrant | BADHDUFLAG | Total packets | Discarded packets |
| A | 0 | 130 | 0 |
| B | 0 | 130 | 0 |
| C | 0 | 130 | 0 |
| D | 0 | 130 | 0 |
| Quadrant | Total seconds | Saturated seconds | Saturation percentage |
|---|---|---|---|
| A | 6511 | 124 | 1.904469% |
| B | 6512 | 148 | 2.272727% |
| C | 6512 | 97 | 1.489558% |
| D | 6512 | 509 | 7.816339% |
Noise dominated data is calculated using 1-second bins in cleaned event files. If a bin has >2000 counts, and if more than 50% of those come from <1% of pixels, then it is considered to be noise-dominated and hence unusable.
| Quadrant | # 1 sec bins | Bins with >0 counts | Bins with >2000 counts | High rate bins dominated by noise | Noise dominated (total time) | Noise dominated (detector-on time) | Marked lightcurve |
|---|---|---|---|---|---|---|---|
| A | 7636 | 6512 | 16 | 16 | 0.21% | 0.25% | 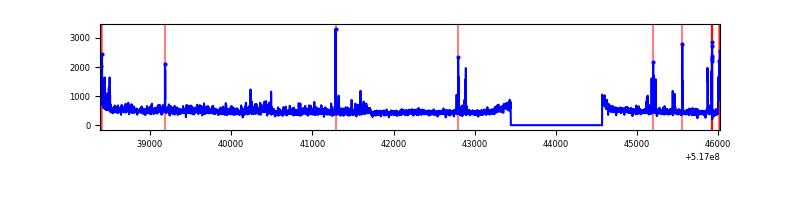 |
| B | 7637 | 6513 | 10 | 10 | 0.13% | 0.15% | 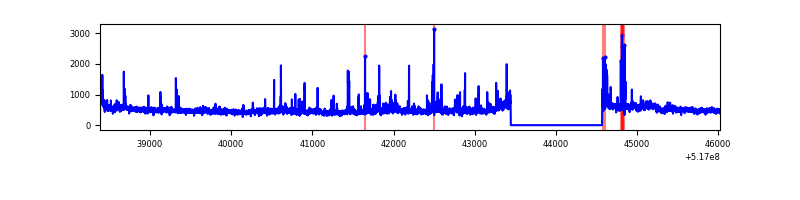 |
| C | 7637 | 6513 | 19 | 19 | 0.25% | 0.29% | 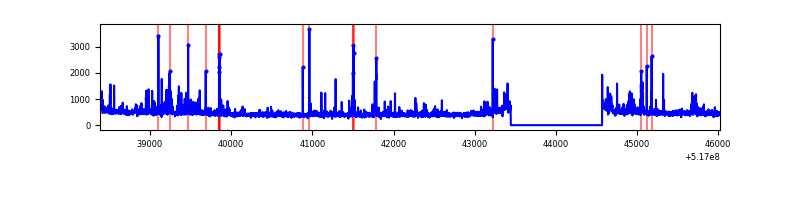 |
| D | 7637 | 6512 | 364 | 364 | 4.77% | 5.59% | 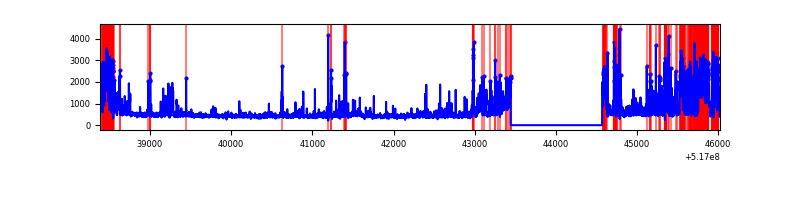 |
Top three noisy pixels from each quadrant. If the there are fewer than three noisy pixels in the level2.evt file, extra rows are filled as -1
| Pixel properties | Quadrant properties | ||||||
|---|---|---|---|---|---|---|---|
| Quadrant | DetID | PixID | Counts | Sigma | Mean | Median | Sigma |
| A | 3 | 14 | 220716 | 1220.42 | 736 | 719 | 180.3 |
| A | 7 | 160 | 117435 | 647.48 | 736 | 719 | 180.3 |
| A | 3 | 128 | 34084 | 185.09 | 736 | 719 | 180.3 |
| B | 0 | 63 | 224640 | 1475.64 | 722 | 696 | 151.8 |
| B | 7 | 252 | 46387 | 301.07 | 722 | 696 | 151.8 |
| B | 10 | 16 | 36323 | 234.76 | 722 | 696 | 151.8 |
| C | 15 | 224 | 226584 | 1151.68 | 721 | 716 | 196.1 |
| C | 14 | 254 | 89224 | 451.29 | 721 | 716 | 196.1 |
| C | 12 | 2 | 35997 | 179.89 | 721 | 716 | 196.1 |
| D | 8 | 160 | 902474 | 4603.53 | 696 | 666 | 195.9 |
| D | 15 | 142 | 467116 | 2381.13 | 696 | 666 | 195.9 |
| D | 2 | 249 | 223697 | 1138.52 | 696 | 666 | 195.9 |
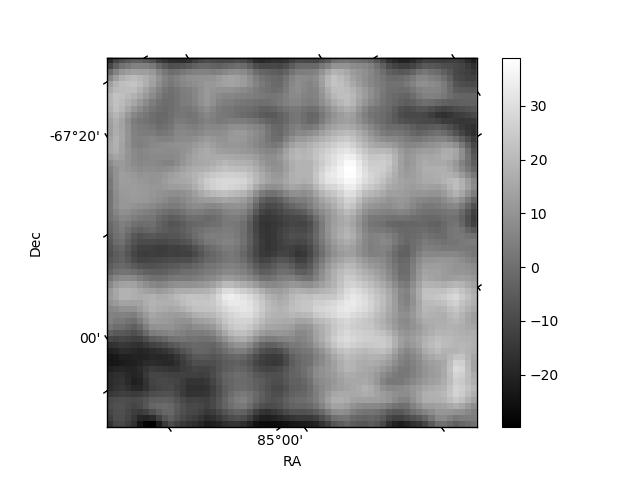
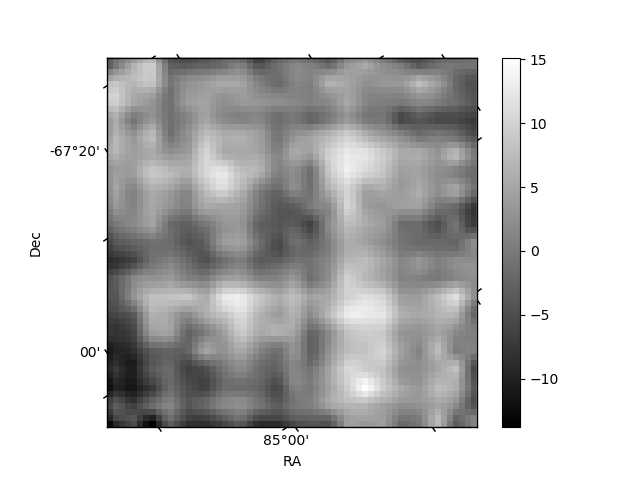
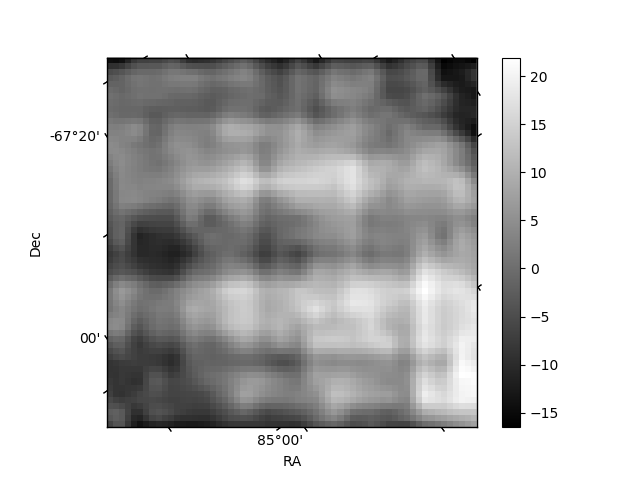
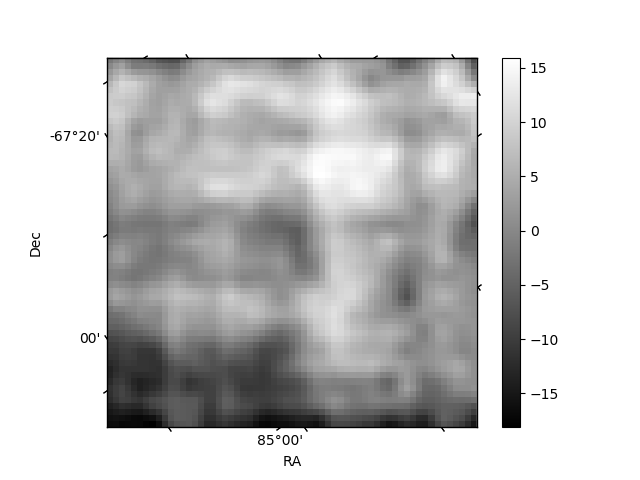
Histogram calculated using DETX and DETY for each event in the final _common_clean file
| Quadrant A | 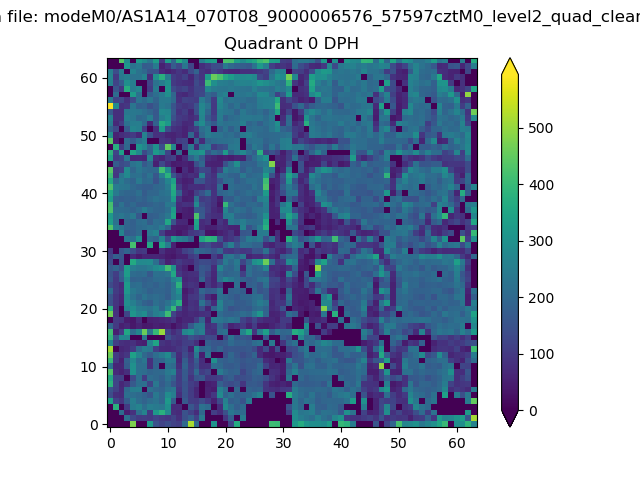 |
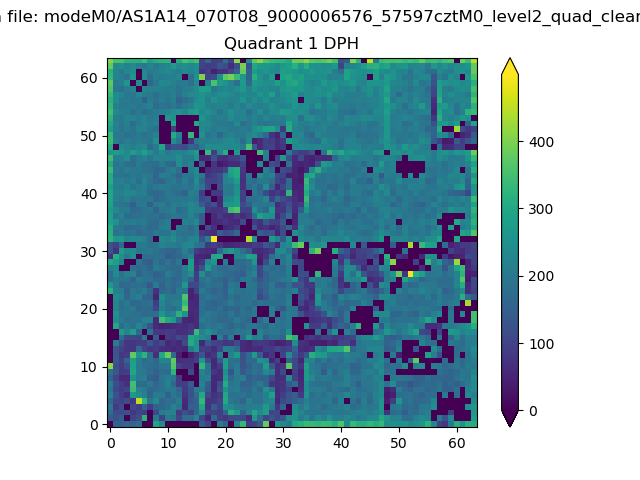 |
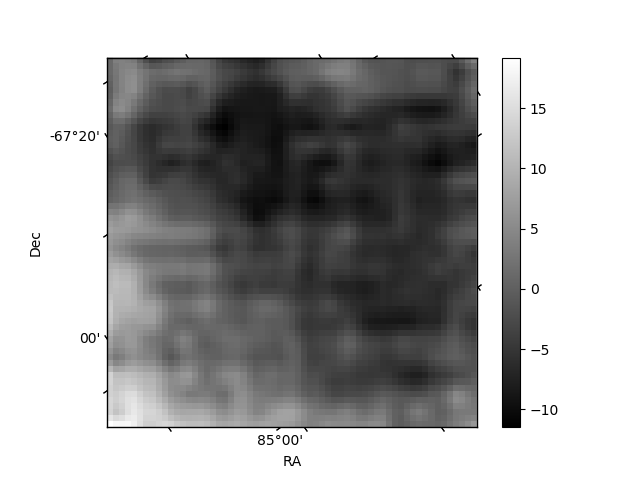
Quadrant B |
|---|---|---|---|
| Quadrant D | 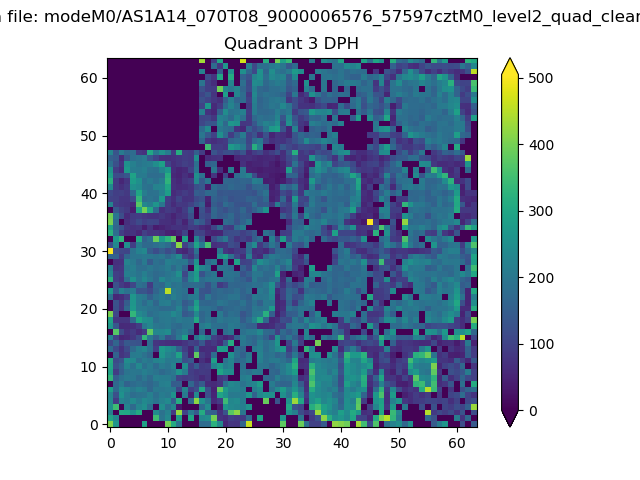 |
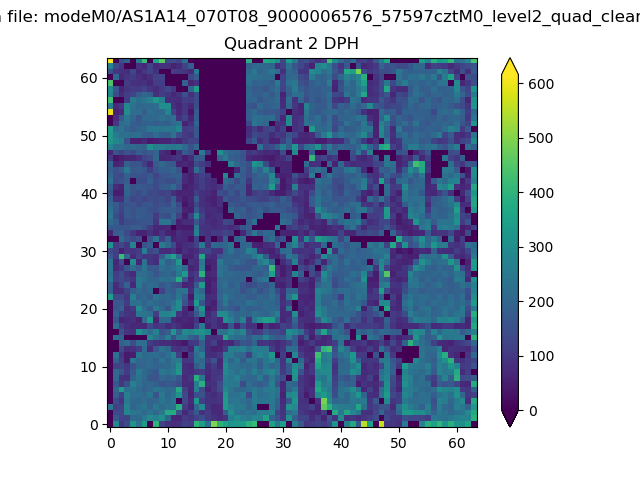 |
Quadrant C |
| Plot type | Count rate plots | Images |
|---|---|---|
| Comparison with Poisson distribution Blue bars denote a histogram of data divided into 1 sec bins. Red curve is a Poisson curve with rate = median count rate of data. |
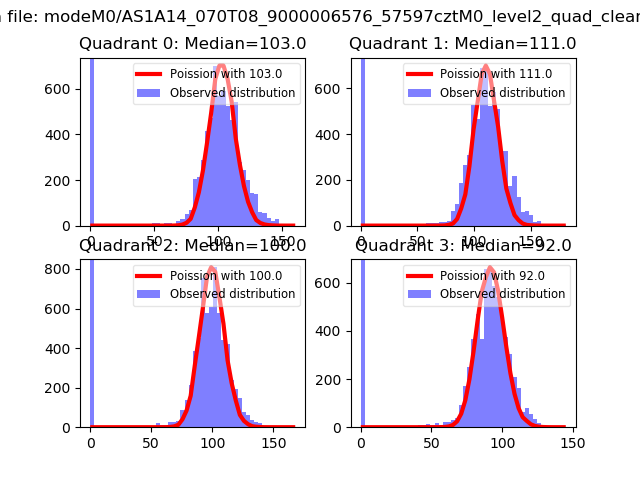 |
 |
| Quadrant-wise count rates Data is divided into 100 sec bins |
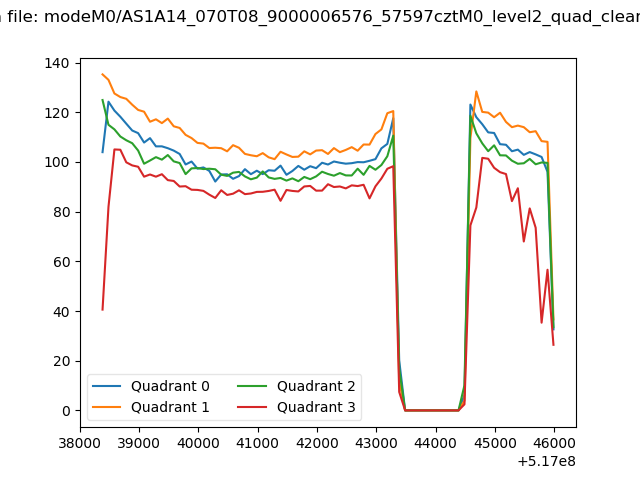 |
|
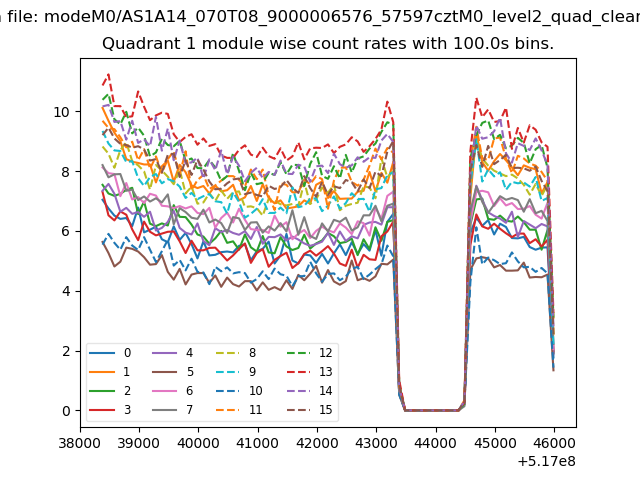
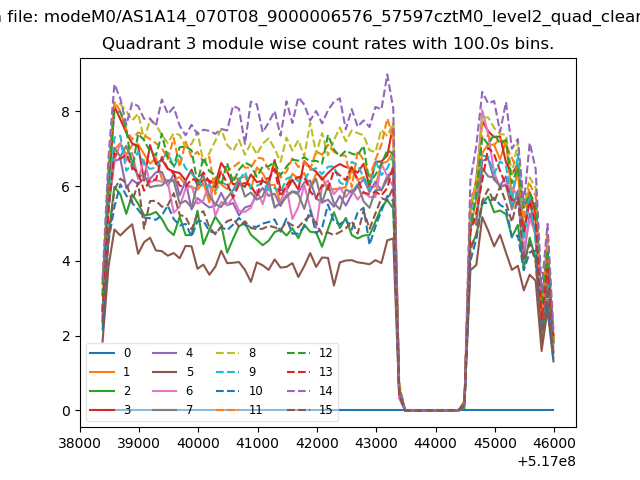
| Module-wise count rates for Quadrant A Data is divided into 100 sec bins |
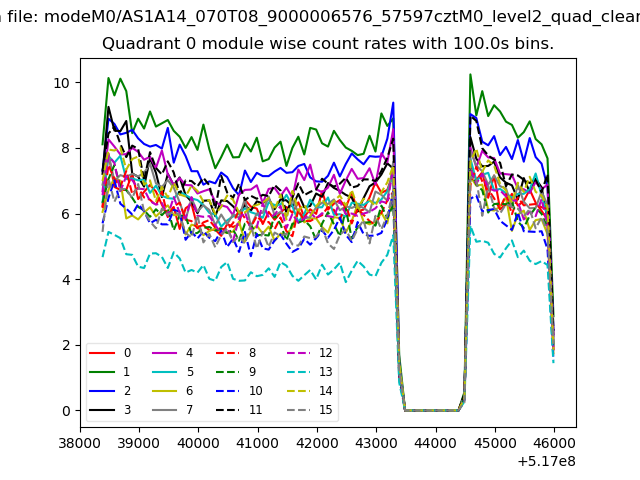 |
 |
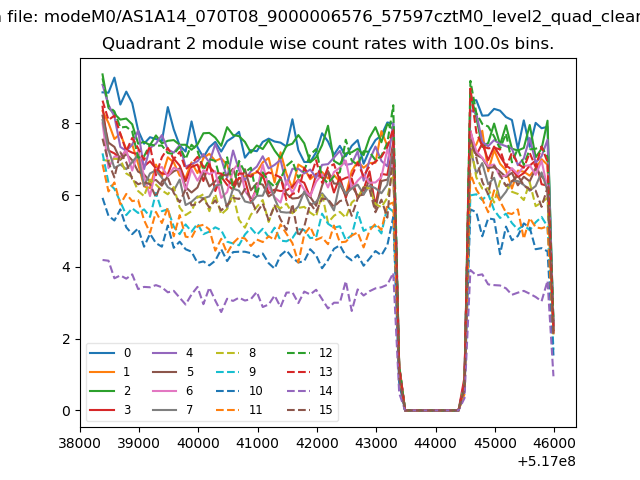
| Module-wise count rates for Quadrant B Data is divided into 100 sec bins |
 |
 |
| Module-wise count rates for Quadrant C Data is divided into 100 sec bins |
 |
 |
| Module-wise count rates for Quadrant D Data is divided into 100 sec bins |
 |
 |
| Parameter | Plot |
|---|---|
| CZT HV Monitor | 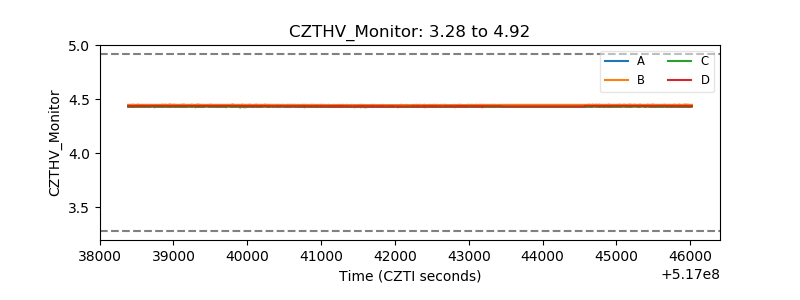 |
| D_VDD | 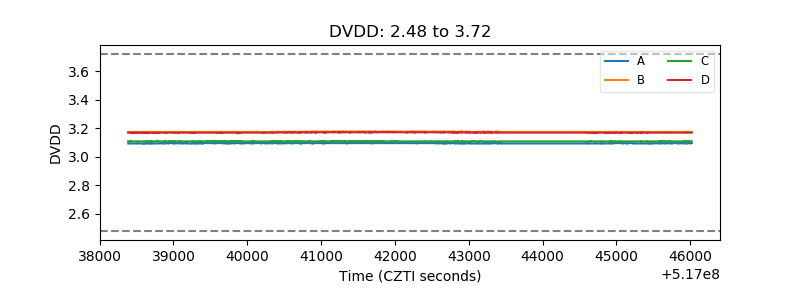 |
| Temperature 1 | 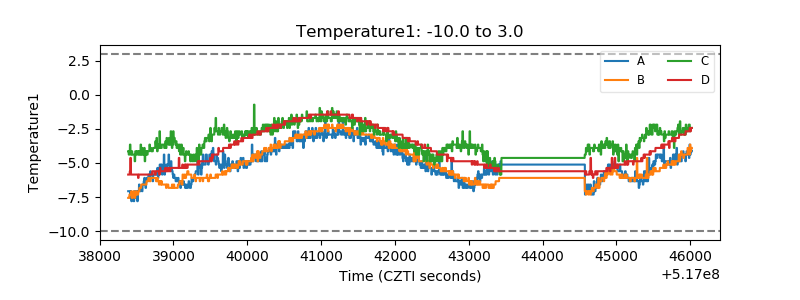 |
| Veto HV Monitor | 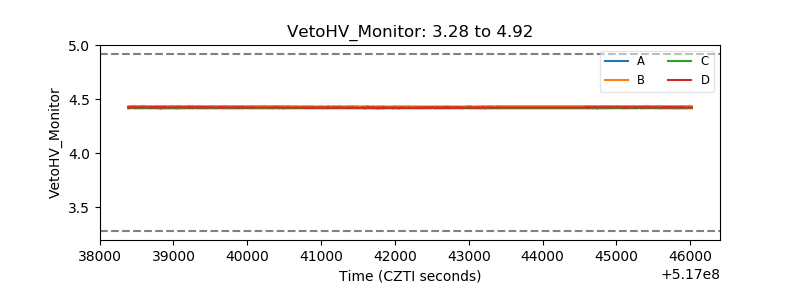 |
| Veto LLD | 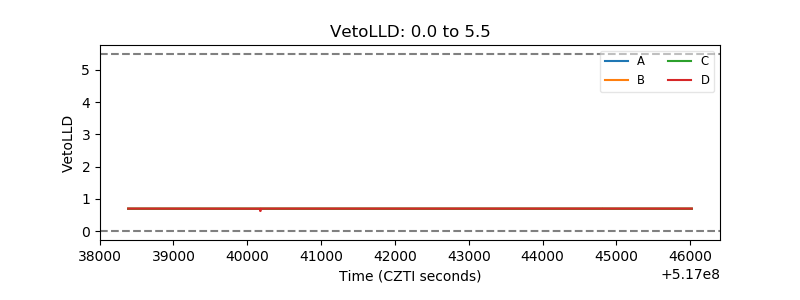 |
| Alpha Counter | 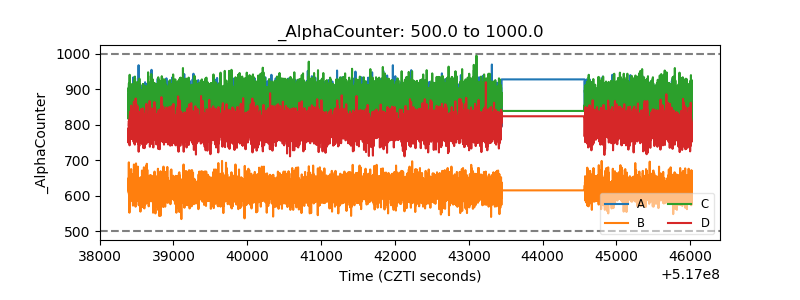 |
| _CPM_Rate | 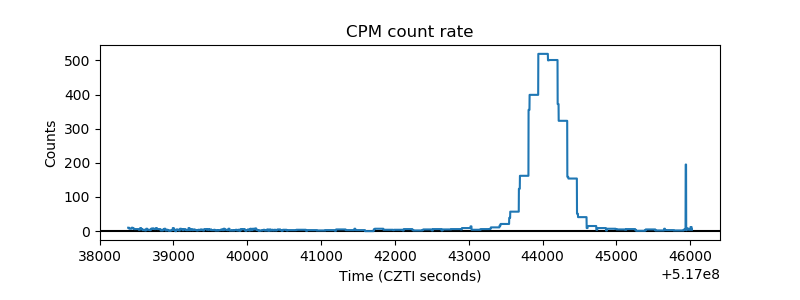 |
| CZT Counter | 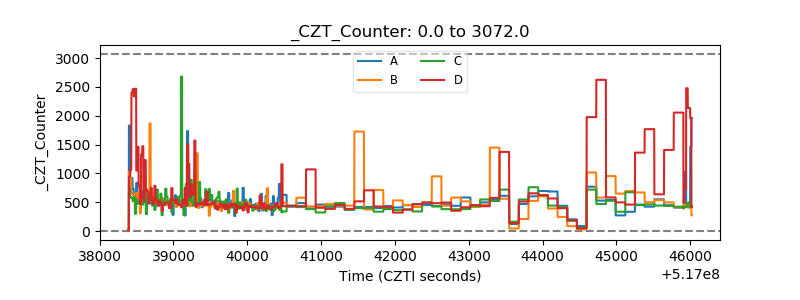 |
| +2.5 Volts monitor | 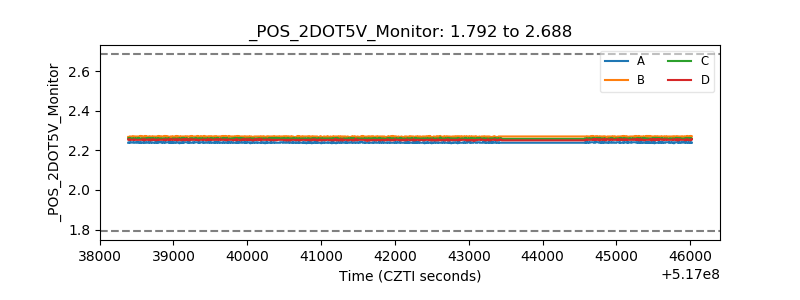 |
| +5 Volts monitor |  |
| _ROLL_ROT | 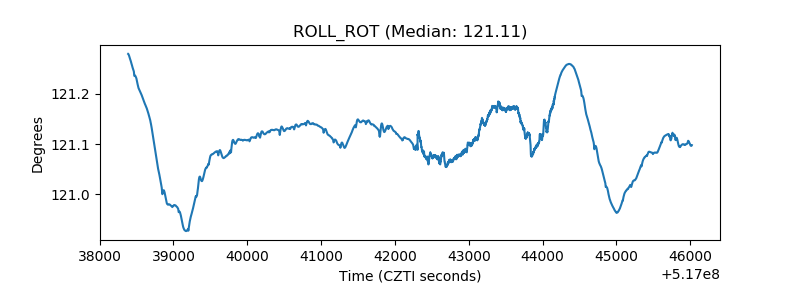 |
| _Roll_DEC | 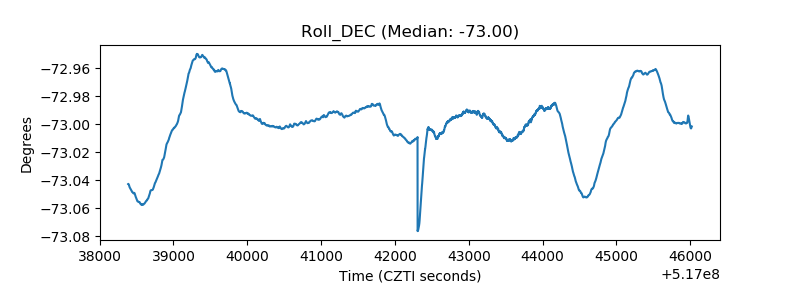 |
| _Roll_RA | 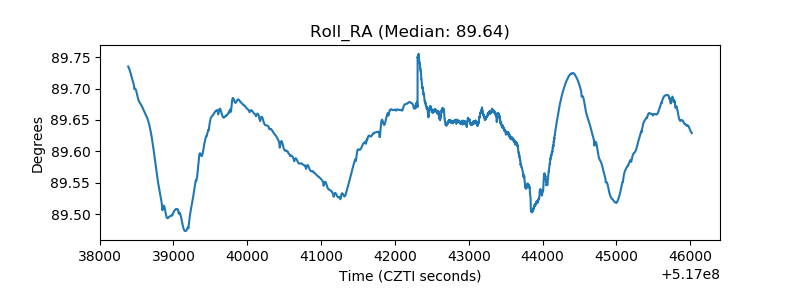 |
| Veto Counter | 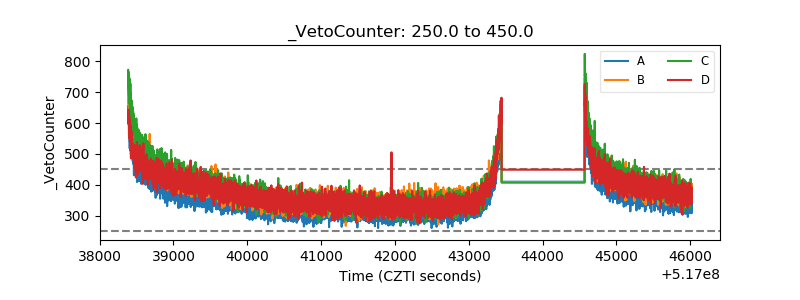 |