| Param | Original file | Final file |
|---|---|---|
| Filename | modeM0/AS1A14_070T08_9000006576_57598cztM0_level2.fits | modeM0/AS1A14_070T08_9000006576_57598cztM0_level2_quad_clean.evt |
| Size (bytes) | 560,617,920 | 86,852,160 |
| Size | 534.6 MB | 82.8 MB |
| Events in quadrant A | 3,283,779 | 622,342 |
| Events in quadrant B | 3,303,718 | 669,128 |
| Events in quadrant C | 8,956,410 | 365,046 |
| Events in quadrant D | 4,720,931 | 536,241 |
| Mode M0 | |||
|---|---|---|---|
| Quadrant | BADHDUFLAG | Total packets | Discarded packets |
| A | 0 | 14256 | 1 |
| B | 0 | 13905 | 2 |
| C | 0 | 30769 | 1 |
| D | 0 | 18441 | 1 |
| Mode M9 | |||
|---|---|---|---|
| Quadrant | BADHDUFLAG | Total packets | Discarded packets |
| A | 0 | 11 | 0 |
| B | 0 | 11 | 0 |
| C | 0 | 11 | 0 |
| D | 0 | 11 | 0 |
| Mode SS | |||
|---|---|---|---|
| Quadrant | BADHDUFLAG | Total packets | Discarded packets |
| A | 0 | 126 | 0 |
| B | 0 | 126 | 0 |
| C | 0 | 126 | 0 |
| D | 0 | 126 | 0 |
| Quadrant | Total seconds | Saturated seconds | Saturation percentage |
|---|---|---|---|
| A | 6269 | 138 | 2.201308% |
| B | 6269 | 87 | 1.387781% |
| C | 6269 | 2523 | 40.245653% |
| D | 6269 | 439 | 7.002712% |
Noise dominated data is calculated using 1-second bins in cleaned event files. If a bin has >2000 counts, and if more than 50% of those come from <1% of pixels, then it is considered to be noise-dominated and hence unusable.
| Quadrant | # 1 sec bins | Bins with >0 counts | Bins with >2000 counts | High rate bins dominated by noise | Noise dominated (total time) | Noise dominated (detector-on time) | Marked lightcurve |
|---|---|---|---|---|---|---|---|
| A | 7379 | 6270 | 81 | 81 | 1.10% | 1.29% | 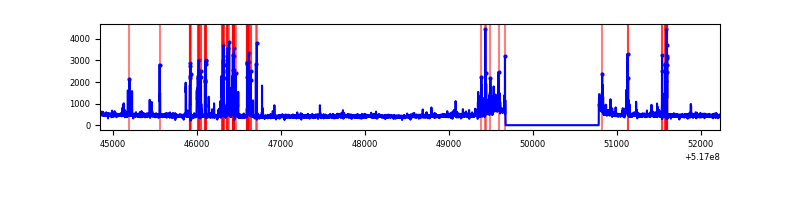 |
| B | 7379 | 6270 | 29 | 29 | 0.39% | 0.46% | 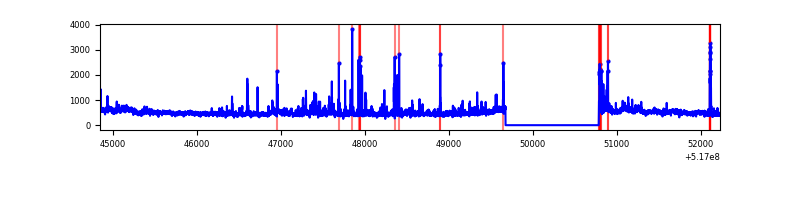 |
| C | 7378 | 6268 | 2434 | 2434 | 32.99% | 38.83% | 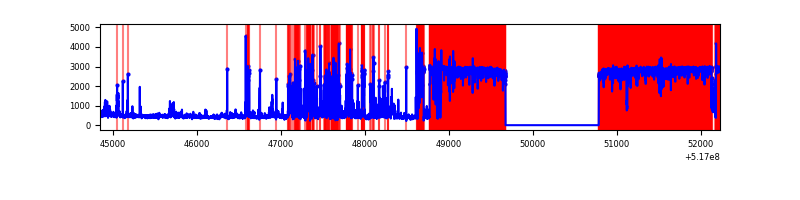 |
| D | 7379 | 6269 | 375 | 375 | 5.08% | 5.98% | 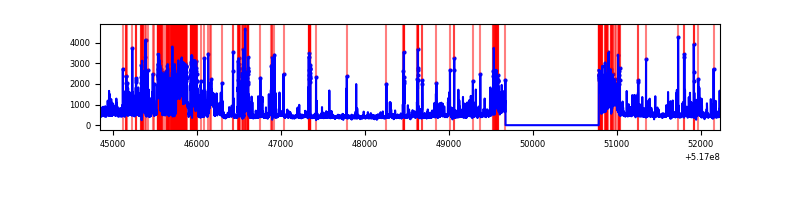 |
Top three noisy pixels from each quadrant. If the there are fewer than three noisy pixels in the level2.evt file, extra rows are filled as -1
| Pixel properties | Quadrant properties | ||||||
|---|---|---|---|---|---|---|---|
| Quadrant | DetID | PixID | Counts | Sigma | Mean | Median | Sigma |
| A | 7 | 160 | 547435 | 3251.8 | 685 | 670 | 168.1 |
| A | 3 | 14 | 56500 | 332.04 | 685 | 670 | 168.1 |
| A | 4 | 3 | 21523 | 124.02 | 685 | 670 | 168.1 |
| B | 0 | 63 | 285625 | 1994.17 | 673 | 650 | 142.9 |
| B | 10 | 247 | 88852 | 617.21 | 673 | 650 | 142.9 |
| B | 10 | 16 | 50509 | 348.9 | 673 | 650 | 142.9 |
| C | 15 | 208 | 6156068 | 48536.91 | 460 | 456 | 126.8 |
| C | 1 | 12 | 454903 | 3583.31 | 460 | 456 | 126.8 |
| C | 15 | 224 | 208894 | 1643.53 | 460 | 456 | 126.8 |
| D | 8 | 160 | 956840 | 5189.4 | 654 | 626 | 184.3 |
| D | 2 | 249 | 319038 | 1728.03 | 654 | 626 | 184.3 |
| D | 15 | 142 | 257674 | 1395.01 | 654 | 626 | 184.3 |
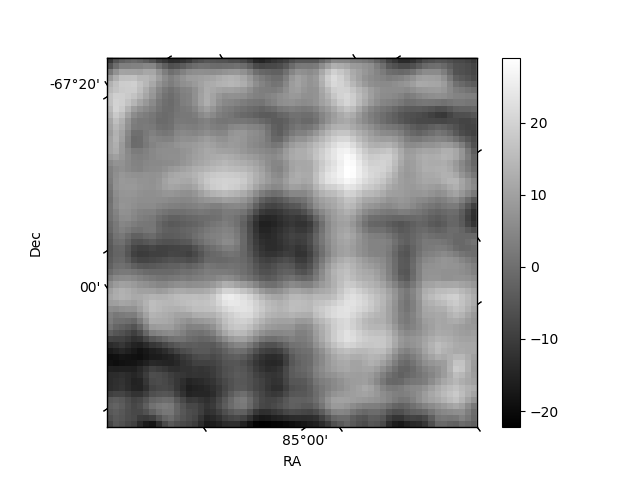
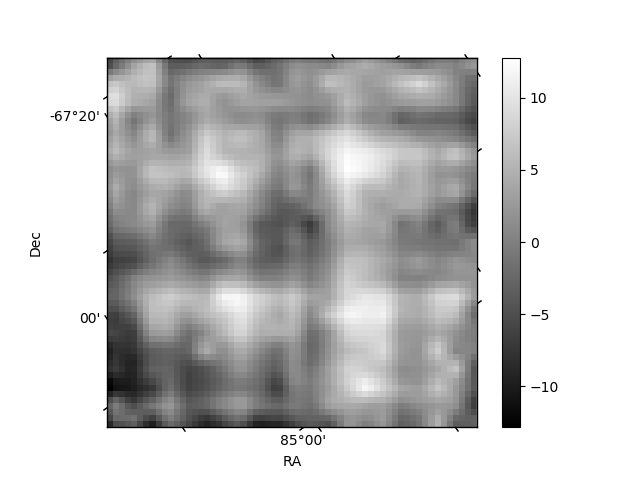
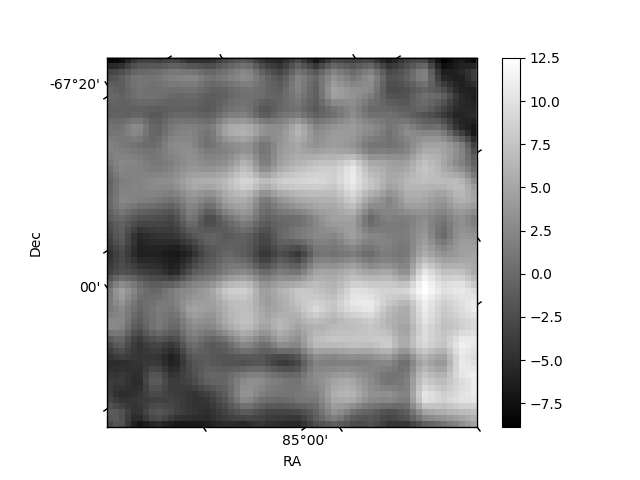
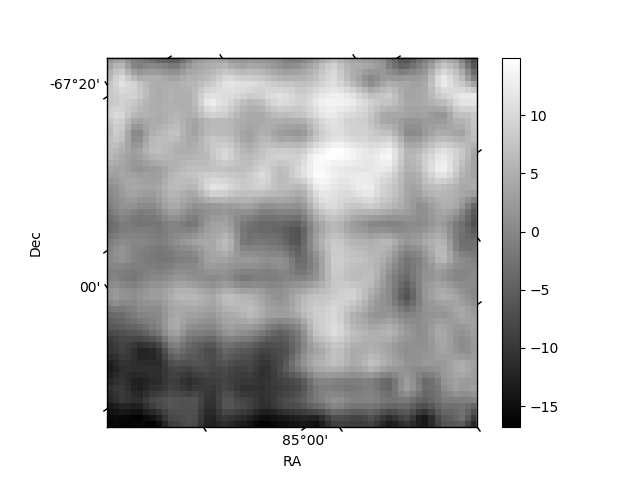
Histogram calculated using DETX and DETY for each event in the final _common_clean file
| Quadrant A | 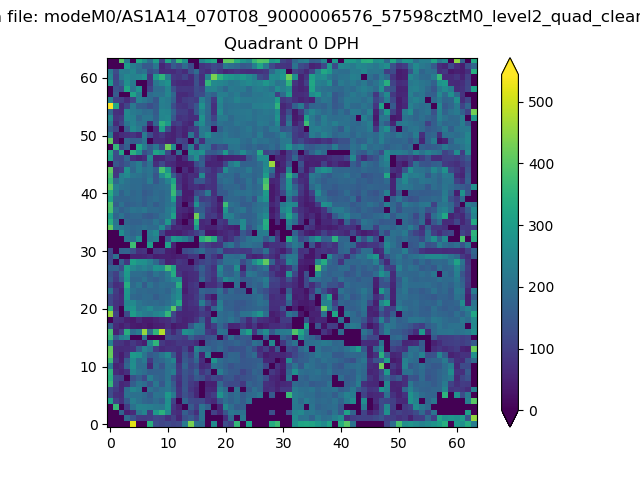 |
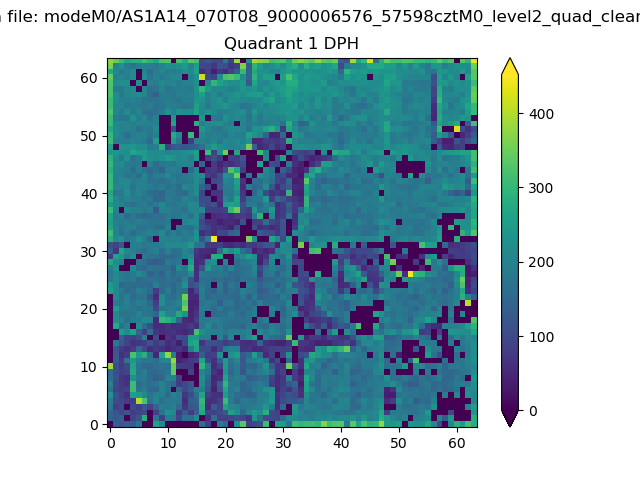 |
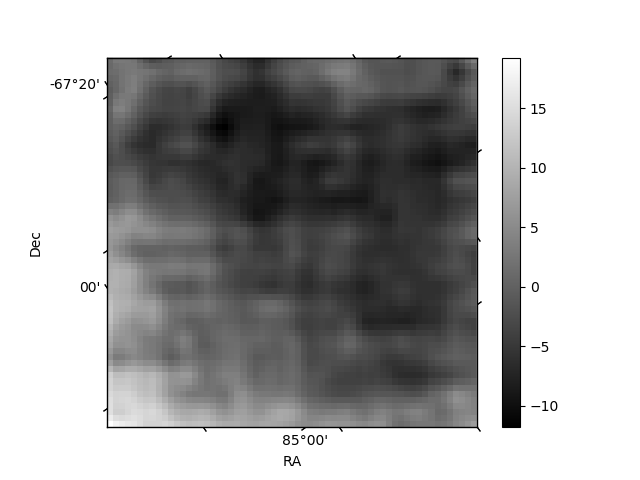
Quadrant B |
|---|---|---|---|
| Quadrant D | 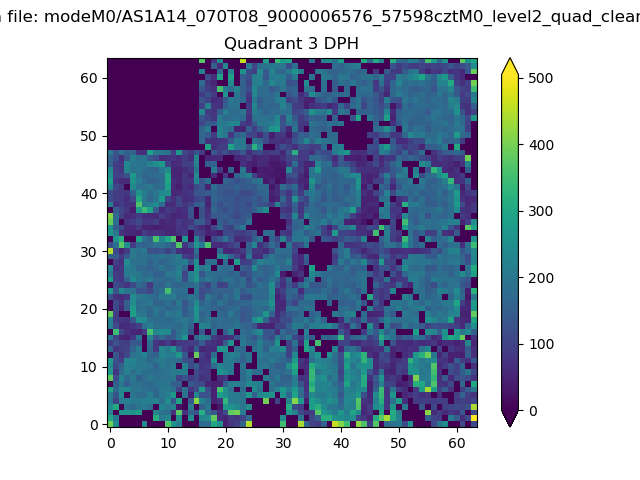 |
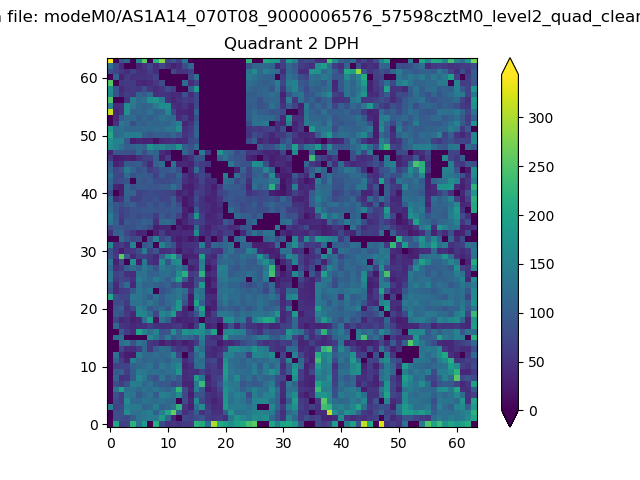 |
Quadrant C |
| Plot type | Count rate plots | Images |
|---|---|---|
| Comparison with Poisson distribution Blue bars denote a histogram of data divided into 1 sec bins. Red curve is a Poisson curve with rate = median count rate of data. |
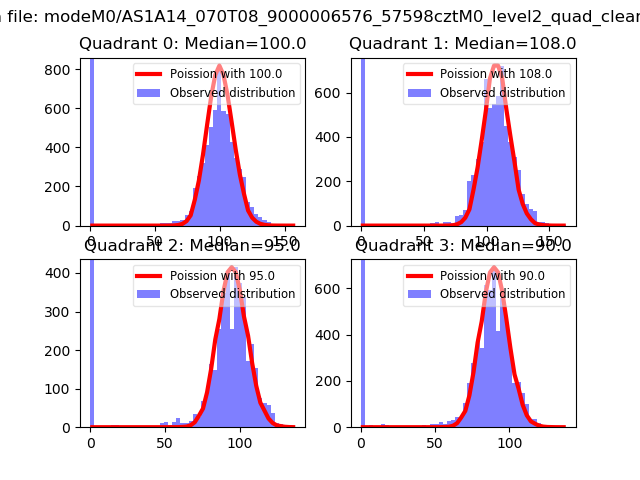 |
 |
| Quadrant-wise count rates Data is divided into 100 sec bins |
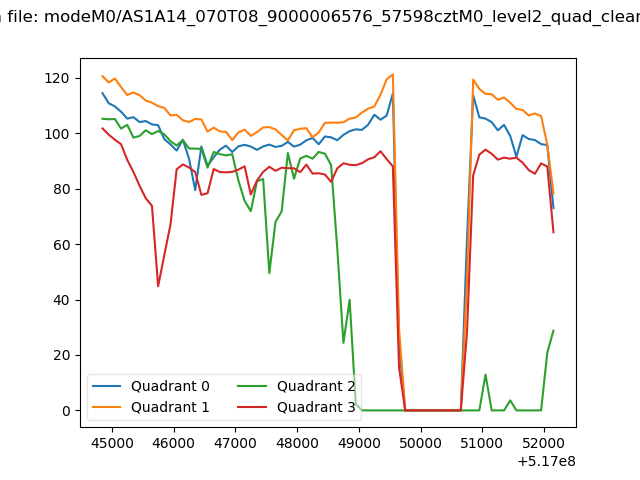 |
|
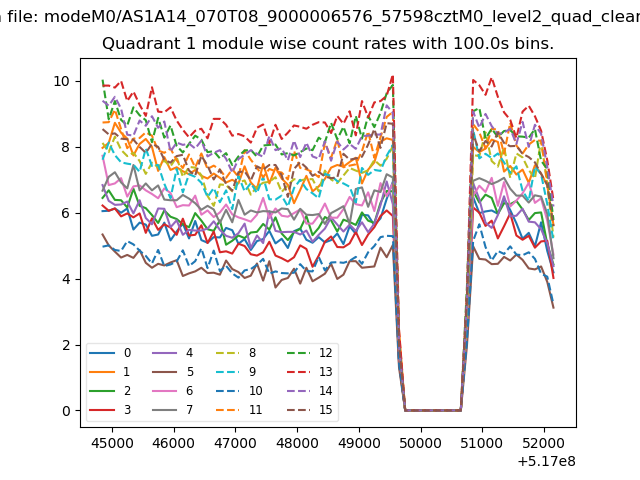
| Module-wise count rates for Quadrant A Data is divided into 100 sec bins |
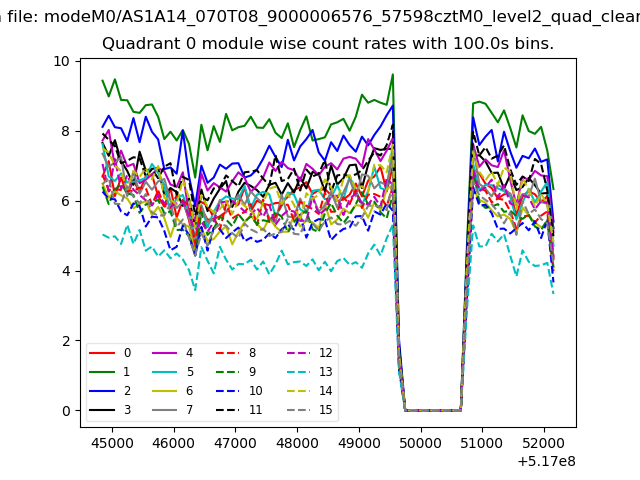 |
 |
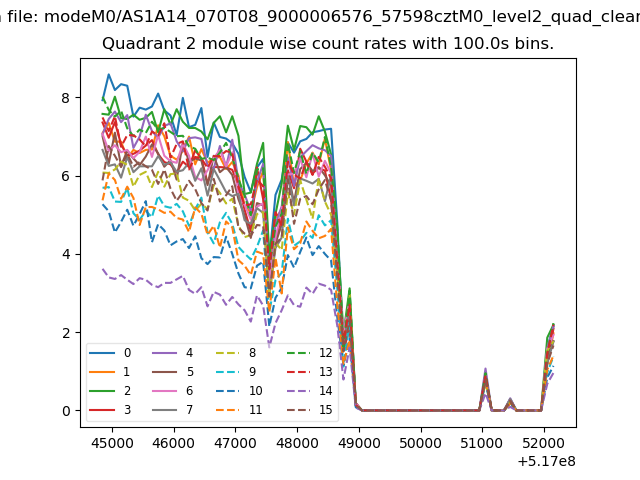
| Module-wise count rates for Quadrant B Data is divided into 100 sec bins |
 |
 |
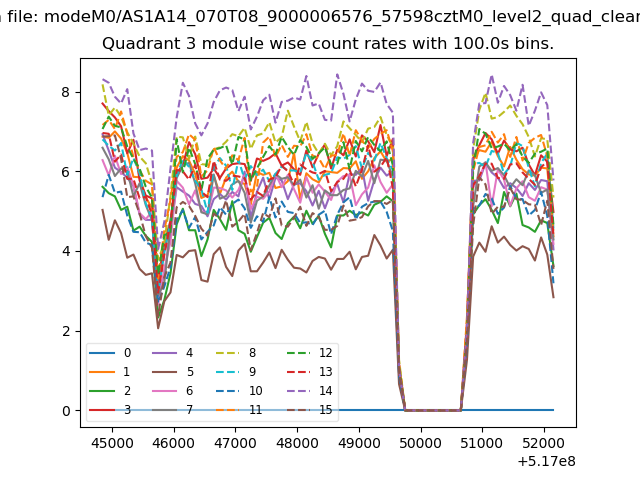
| Module-wise count rates for Quadrant C Data is divided into 100 sec bins |
 |
 |
| Module-wise count rates for Quadrant D Data is divided into 100 sec bins |
 |
 |
| Parameter | Plot |
|---|---|
| CZT HV Monitor | 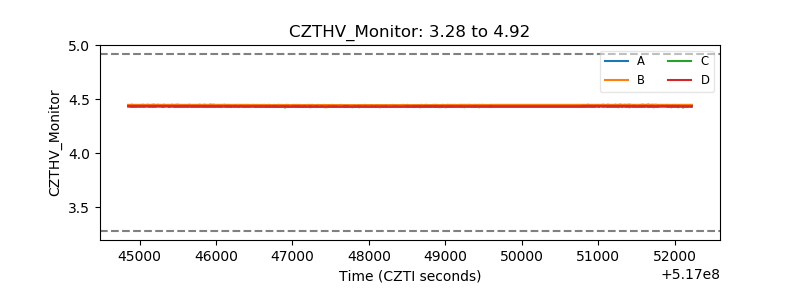 |
| D_VDD | 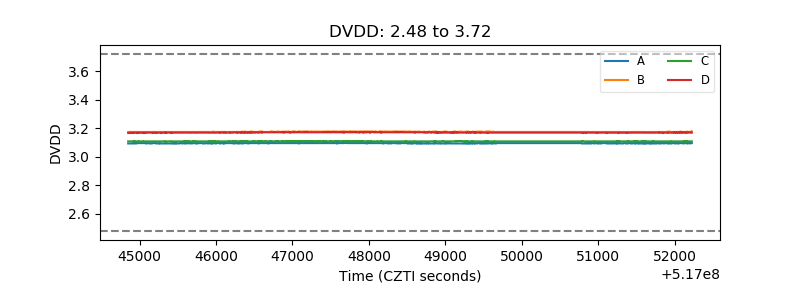 |
| Temperature 1 | 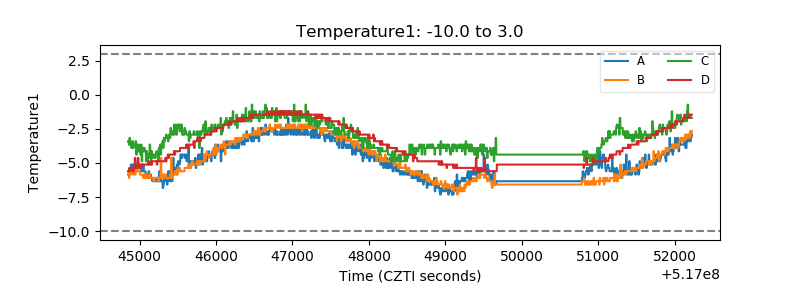 |
| Veto HV Monitor | 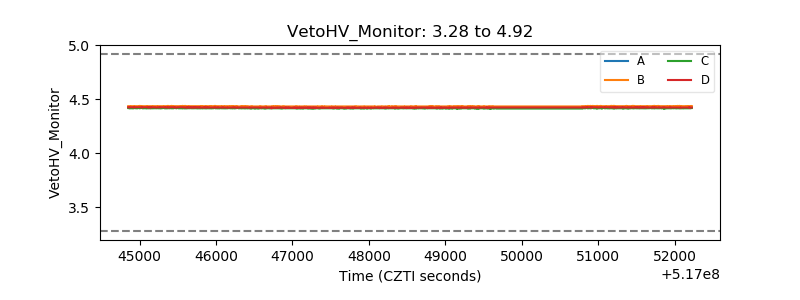 |
| Veto LLD | 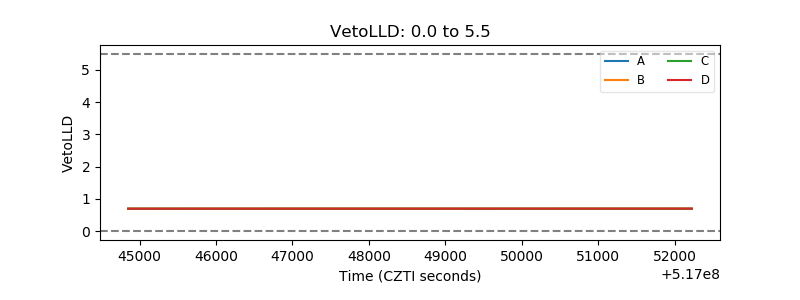 |
| Alpha Counter | 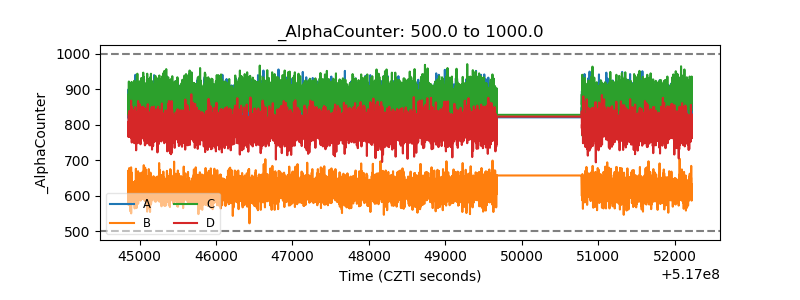 |
| _CPM_Rate | 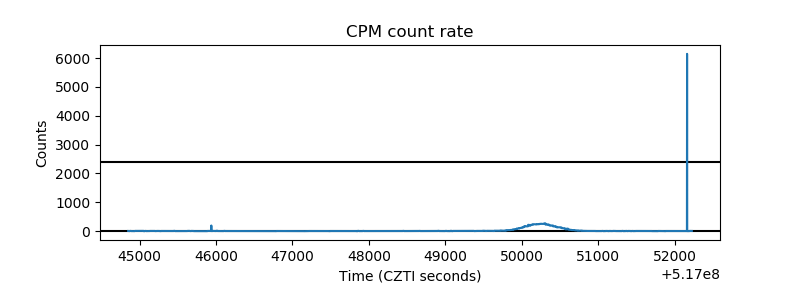 |
| CZT Counter | 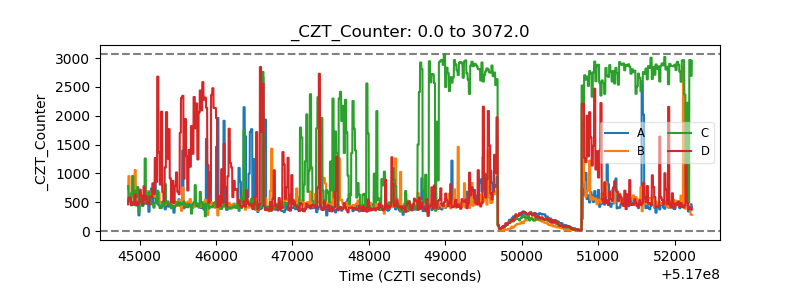 |
| +2.5 Volts monitor | 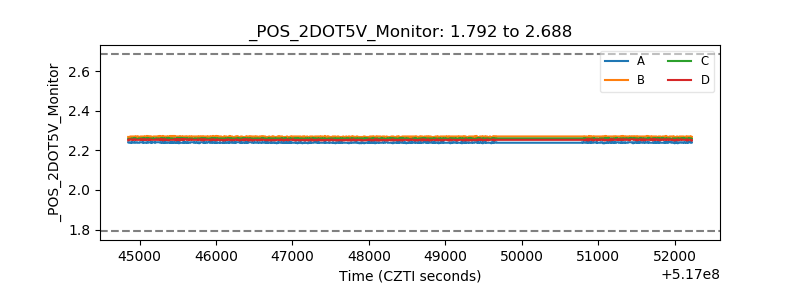 |
| +5 Volts monitor | 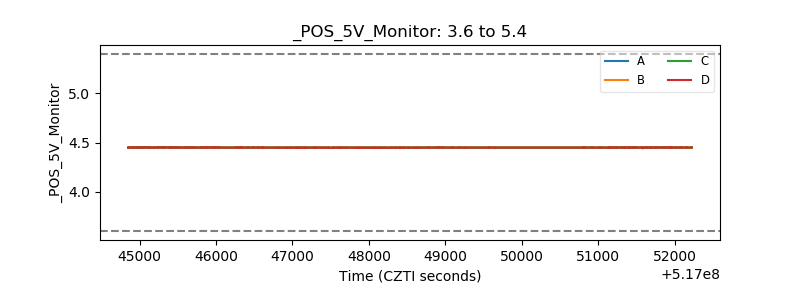 |
| _ROLL_ROT | 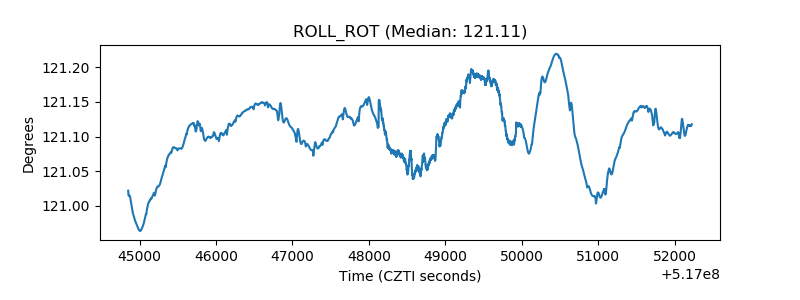 |
| _Roll_DEC | 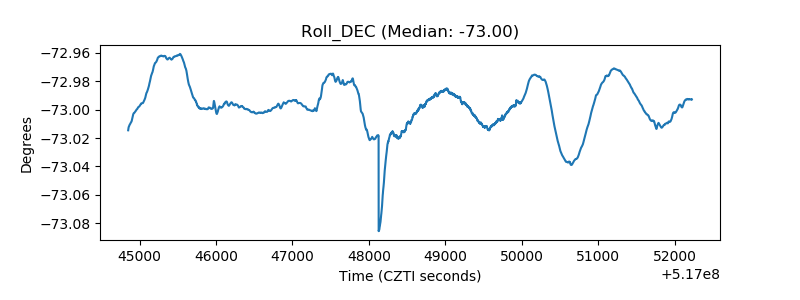 |
| _Roll_RA | 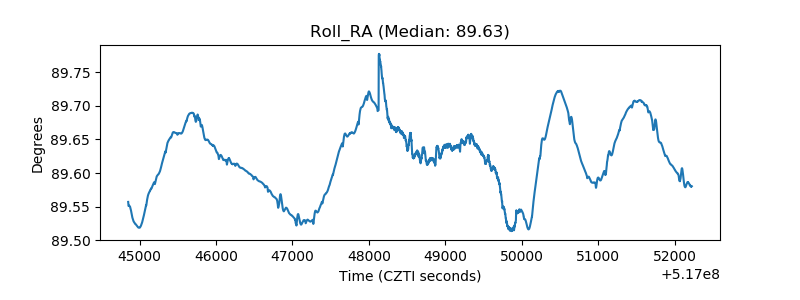 |
| Veto Counter | 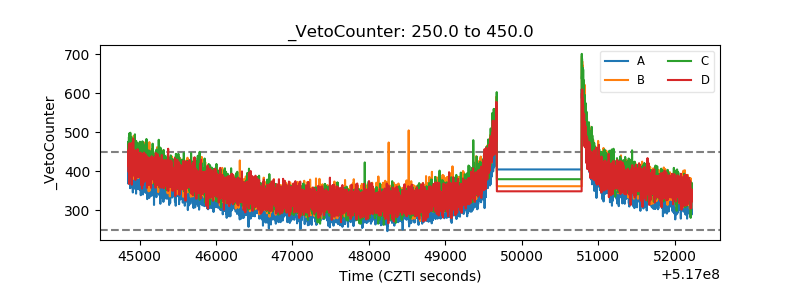 |