| Param | Original file | Final file |
|---|---|---|
| Filename | modeM0/AS1A14_070T08_9000006576_57600cztM0_level2.fits | modeM0/AS1A14_070T08_9000006576_57600cztM0_level2_quad_clean.evt |
| Size (bytes) | 379,232,640 | 97,246,080 |
| Size | 361.7 MB | 92.7 MB |
| Events in quadrant A | 2,906,344 | 632,511 |
| Events in quadrant B | 3,233,450 | 673,230 |
| Events in quadrant C | 3,682,280 | 603,269 |
| Events in quadrant D | 3,693,829 | 568,841 |
| Mode M0 | |||
|---|---|---|---|
| Quadrant | BADHDUFLAG | Total packets | Discarded packets |
| A | 0 | 13765 | 1 |
| B | 0 | 14397 | 1 |
| C | 0 | 15882 | 1 |
| D | 0 | 15789 | 1 |
| Mode M9 | |||
|---|---|---|---|
| Quadrant | BADHDUFLAG | Total packets | Discarded packets |
| A | 0 | 4 | 0 |
| B | 0 | 4 | 0 |
| C | 0 | 4 | 0 |
| D | 0 | 4 | 0 |
| Mode SS | |||
|---|---|---|---|
| Quadrant | BADHDUFLAG | Total packets | Discarded packets |
| A | 0 | 134 | 0 |
| B | 0 | 134 | 0 |
| C | 0 | 134 | 0 |
| D | 0 | 134 | 0 |
| Quadrant | Total seconds | Saturated seconds | Saturation percentage |
|---|---|---|---|
| A | 6700 | 118 | 1.761194% |
| B | 6701 | 165 | 2.462319% |
| C | 6701 | 210 | 3.133861% |
| D | 6701 | 203 | 3.029399% |
Noise dominated data is calculated using 1-second bins in cleaned event files. If a bin has >2000 counts, and if more than 50% of those come from <1% of pixels, then it is considered to be noise-dominated and hence unusable.
| Quadrant | # 1 sec bins | Bins with >0 counts | Bins with >2000 counts | High rate bins dominated by noise | Noise dominated (total time) | Noise dominated (detector-on time) | Marked lightcurve |
|---|---|---|---|---|---|---|---|
| A | 7060 | 6701 | 4 | 4 | 0.06% | 0.06% | 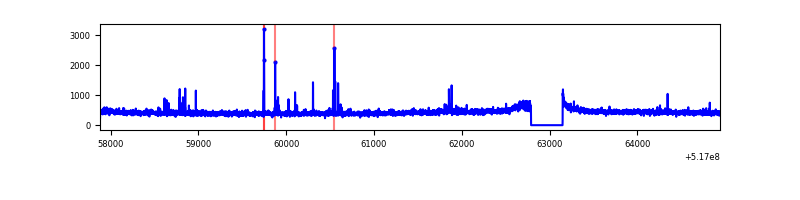 |
| B | 7061 | 6702 | 28 | 28 | 0.40% | 0.42% | 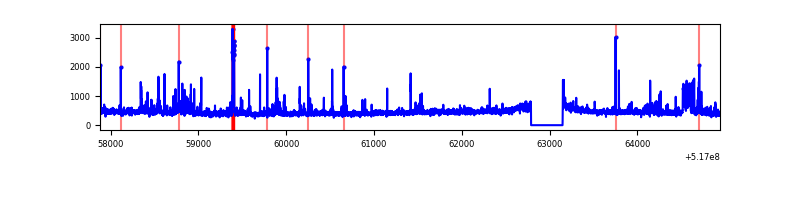 |
| C | 7061 | 6702 | 133 | 133 | 1.88% | 1.98% | 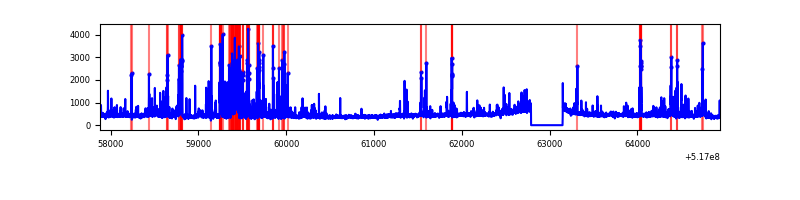 |
| D | 7061 | 6702 | 98 | 98 | 1.39% | 1.46% | 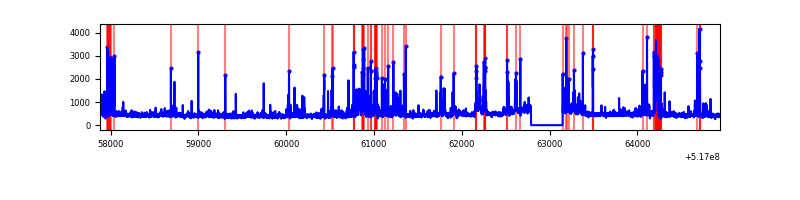 |
Top three noisy pixels from each quadrant. If the there are fewer than three noisy pixels in the level2.evt file, extra rows are filled as -1
| Pixel properties | Quadrant properties | ||||||
|---|---|---|---|---|---|---|---|
| Quadrant | DetID | PixID | Counts | Sigma | Mean | Median | Sigma |
| A | 3 | 14 | 44422 | 248.46 | 720 | 702 | 176.0 |
| A | 7 | 160 | 27884 | 154.47 | 720 | 702 | 176.0 |
| A | 4 | 3 | 16310 | 88.7 | 720 | 702 | 176.0 |
| B | 10 | 247 | 103898 | 689.28 | 706 | 678 | 149.8 |
| B | 5 | 185 | 82590 | 546.99 | 706 | 678 | 149.8 |
| B | 0 | 245 | 57908 | 382.17 | 706 | 678 | 149.8 |
| C | 15 | 224 | 843658 | 4488.56 | 690 | 681 | 187.8 |
| C | 12 | 2 | 45809 | 240.29 | 690 | 681 | 187.8 |
| C | 12 | 252 | 36844 | 192.55 | 690 | 681 | 187.8 |
| D | 15 | 142 | 246736 | 1242.51 | 697 | 662 | 198.0 |
| D | 2 | 249 | 215957 | 1087.09 | 697 | 662 | 198.0 |
| D | 2 | 31 | 130815 | 657.18 | 697 | 662 | 198.0 |
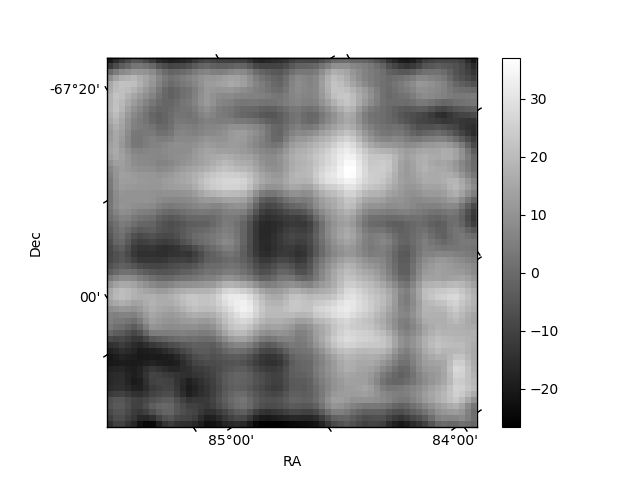
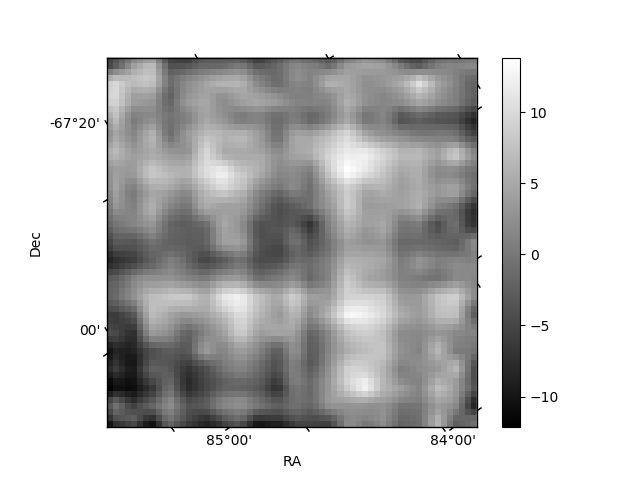
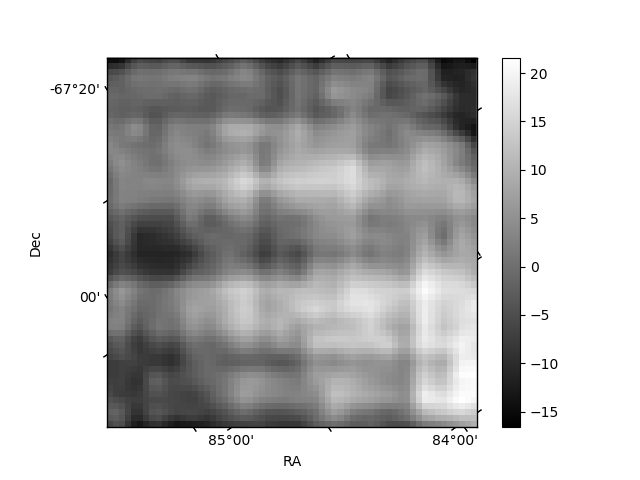
Histogram calculated using DETX and DETY for each event in the final _common_clean file
| Quadrant A | 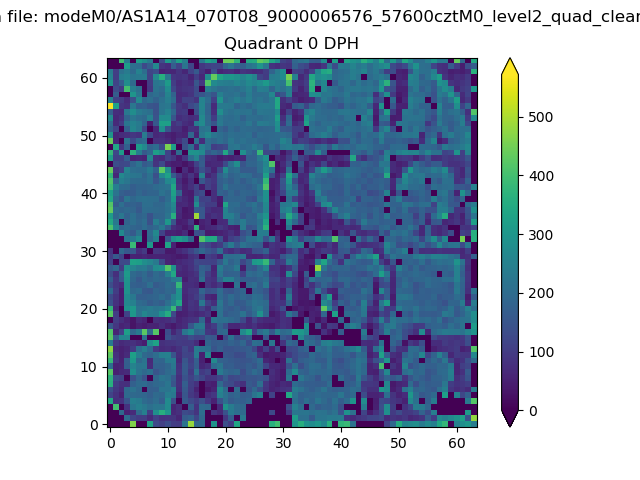 |
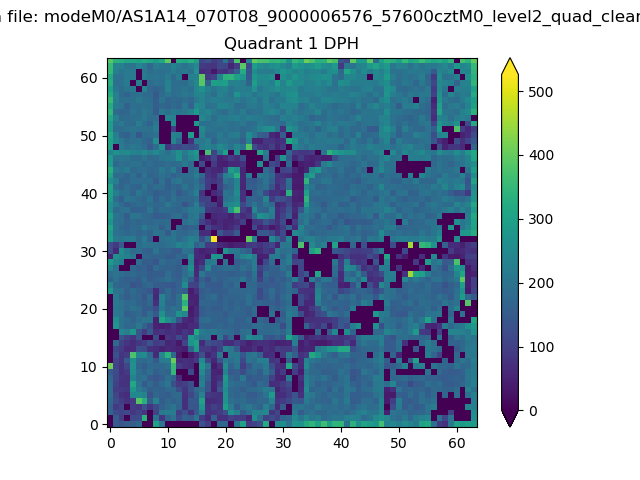 |
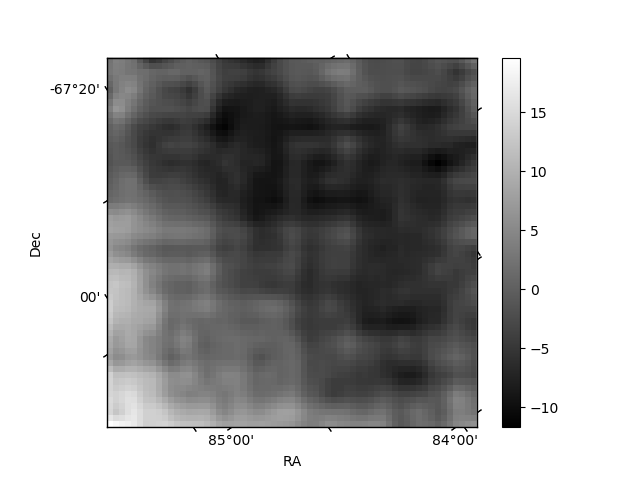
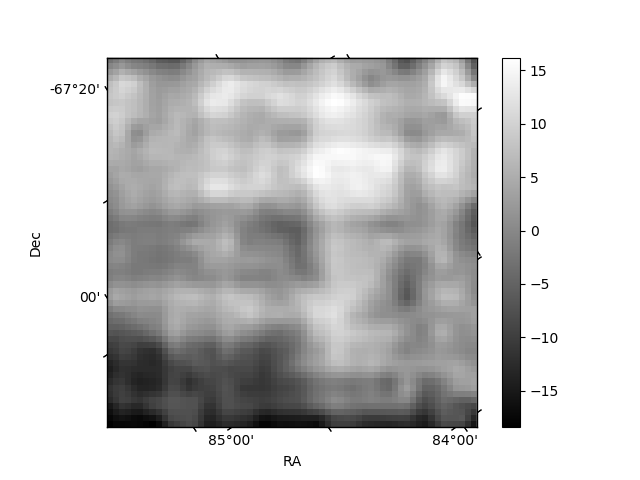
Quadrant B |
|---|---|---|---|
| Quadrant D | 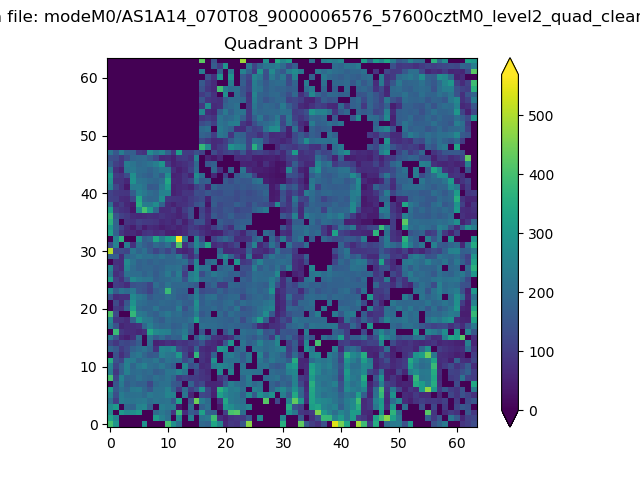 |
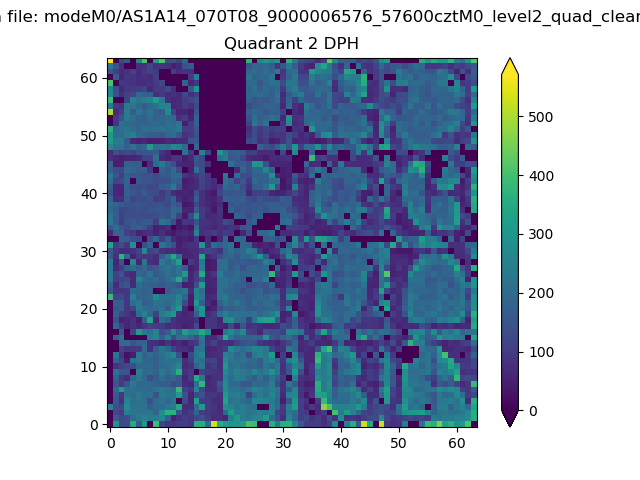 |
Quadrant C |
| Plot type | Count rate plots | Images |
|---|---|---|
| Comparison with Poisson distribution Blue bars denote a histogram of data divided into 1 sec bins. Red curve is a Poisson curve with rate = median count rate of data. |
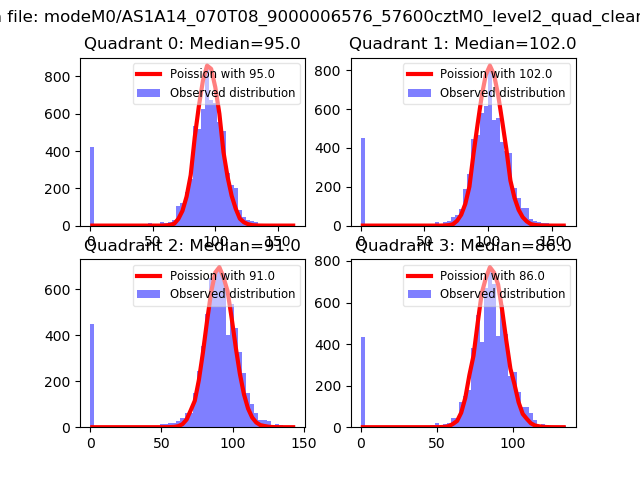 |
 |
| Quadrant-wise count rates Data is divided into 100 sec bins |
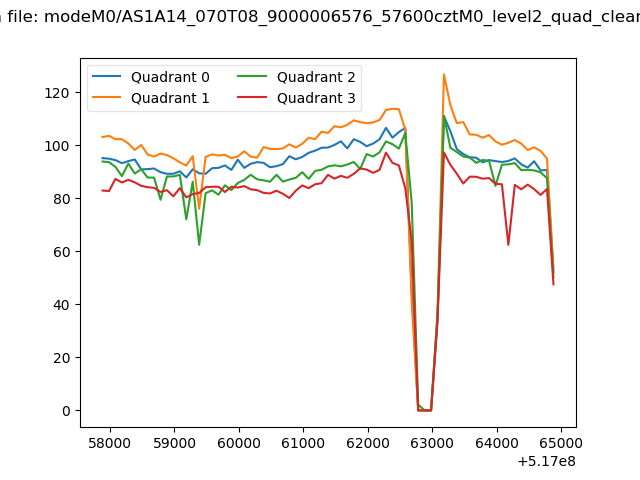 |
|
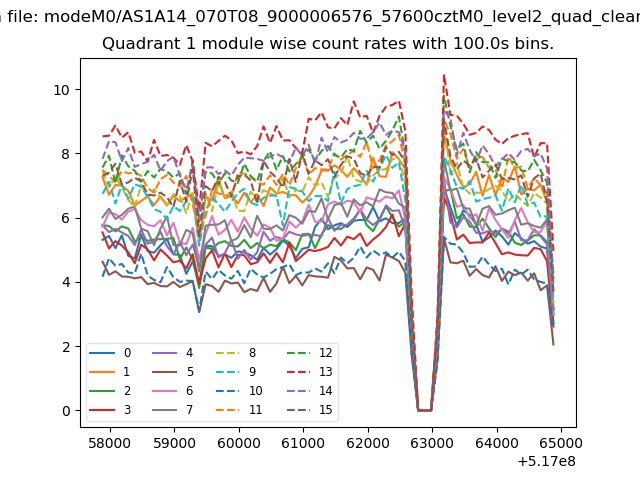
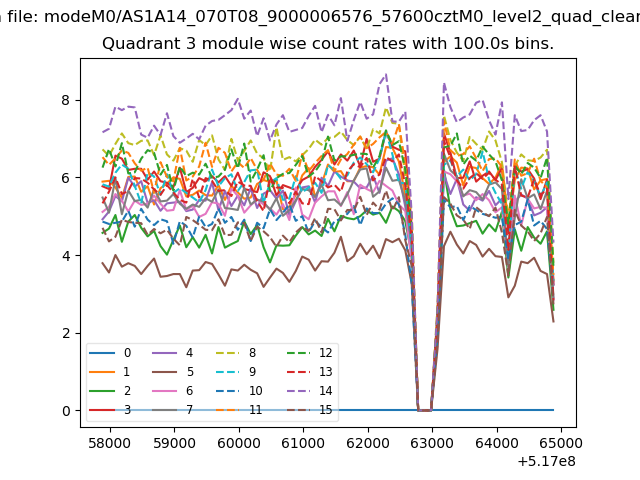
| Module-wise count rates for Quadrant A Data is divided into 100 sec bins |
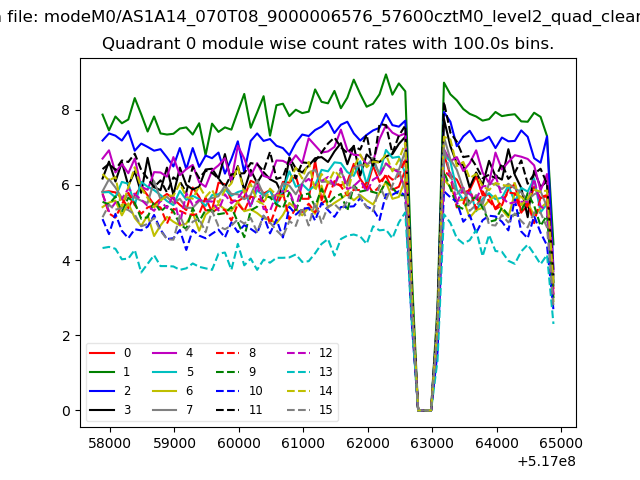 |
 |
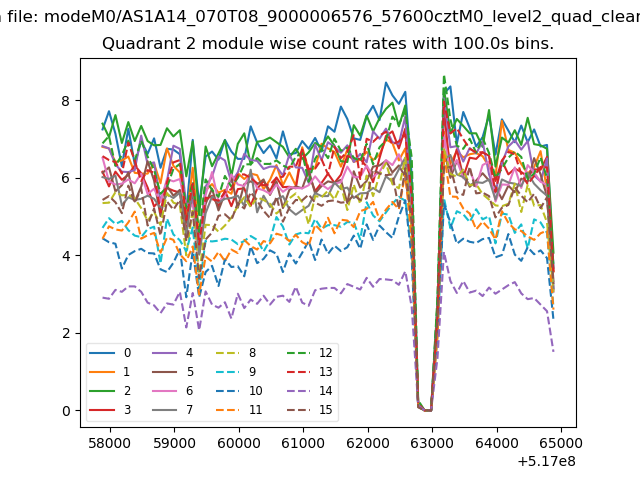
| Module-wise count rates for Quadrant B Data is divided into 100 sec bins |
 |
 |
| Module-wise count rates for Quadrant C Data is divided into 100 sec bins |
 |
 |
| Module-wise count rates for Quadrant D Data is divided into 100 sec bins |
 |
 |
| Parameter | Plot |
|---|---|
| CZT HV Monitor | 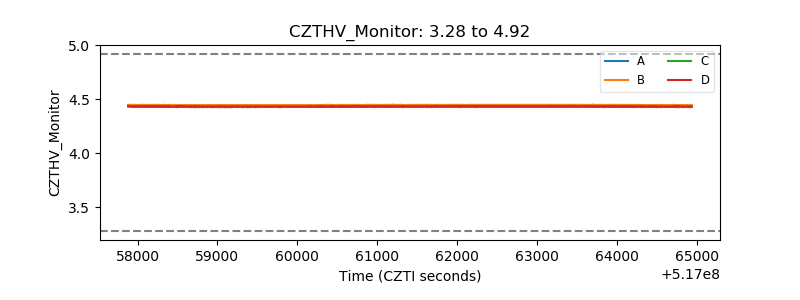 |
| D_VDD | 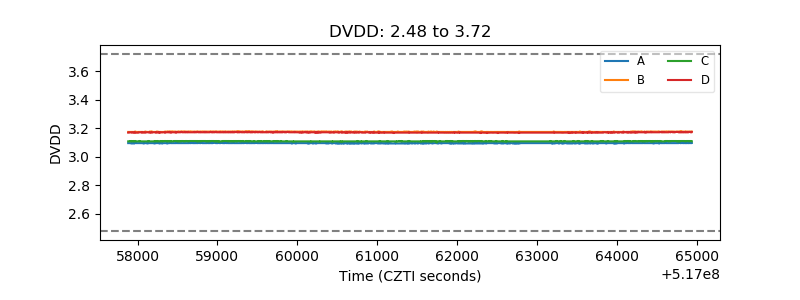 |
| Temperature 1 | 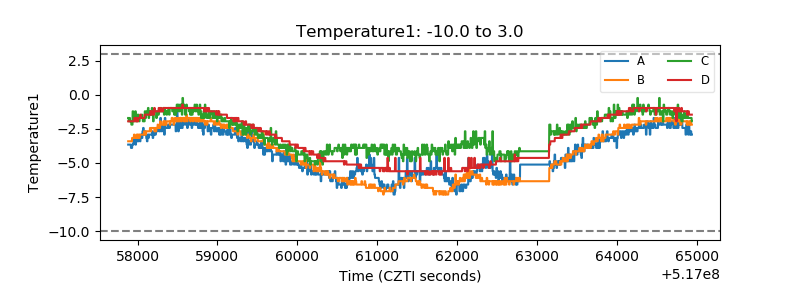 |
| Veto HV Monitor | 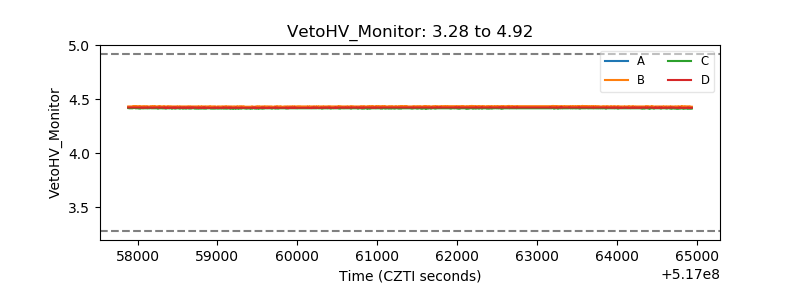 |
| Veto LLD | 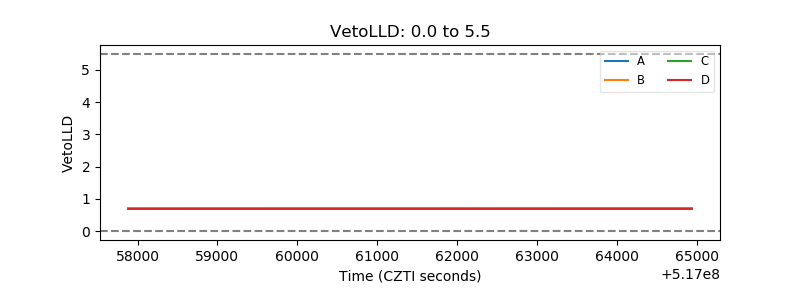 |
| Alpha Counter | 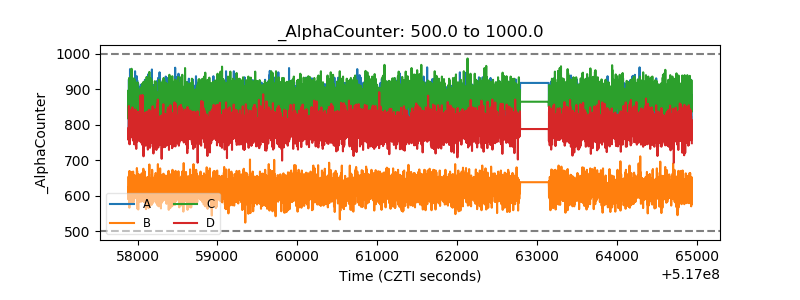 |
| _CPM_Rate | 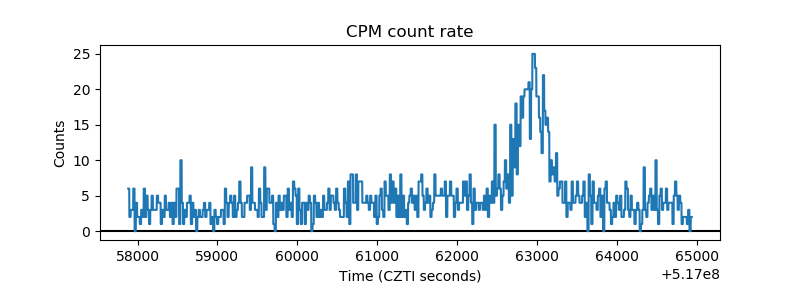 |
| CZT Counter | 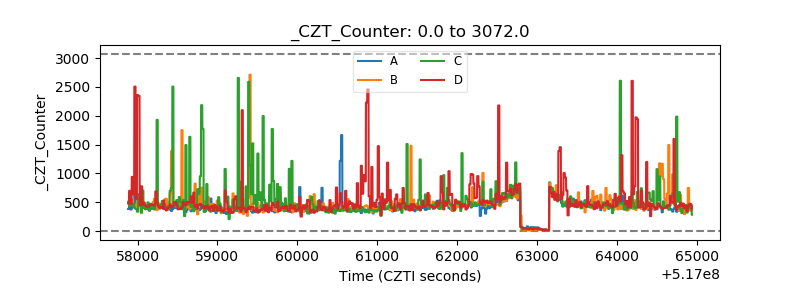 |
| +2.5 Volts monitor | 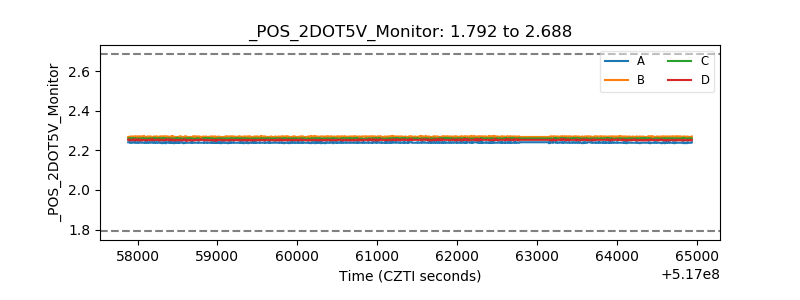 |
| +5 Volts monitor | 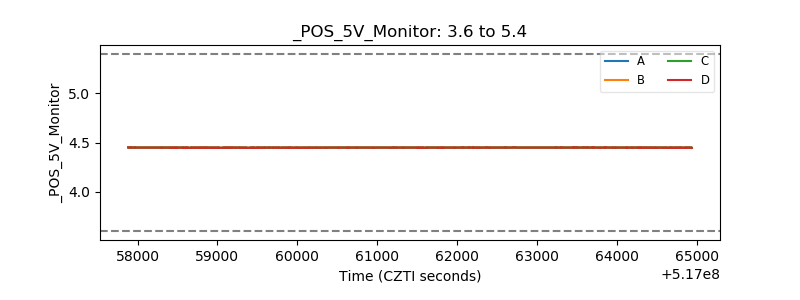 |
| _ROLL_ROT | 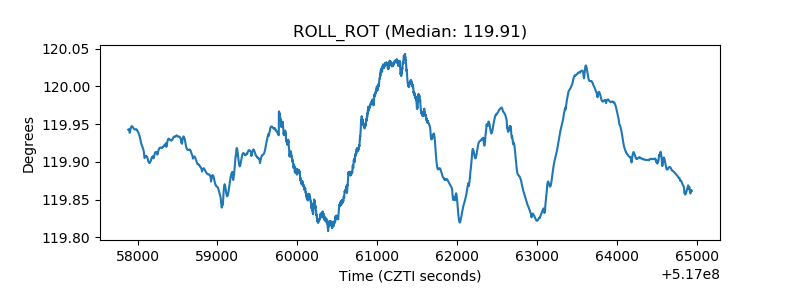 |
| _Roll_DEC | 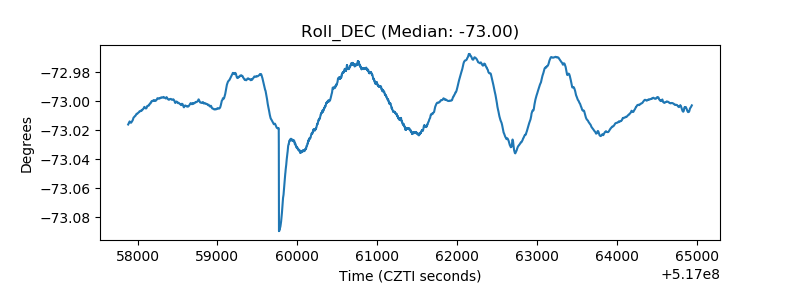 |
| _Roll_RA | 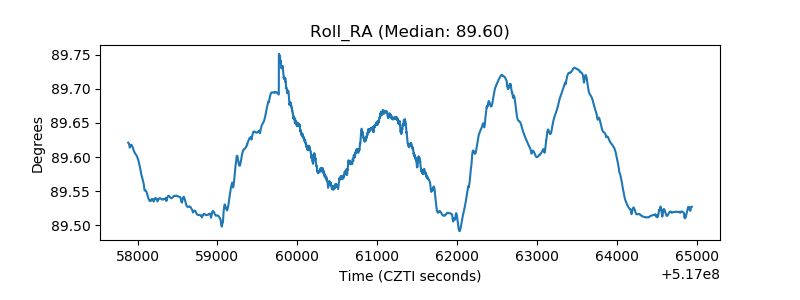 |
| Veto Counter | 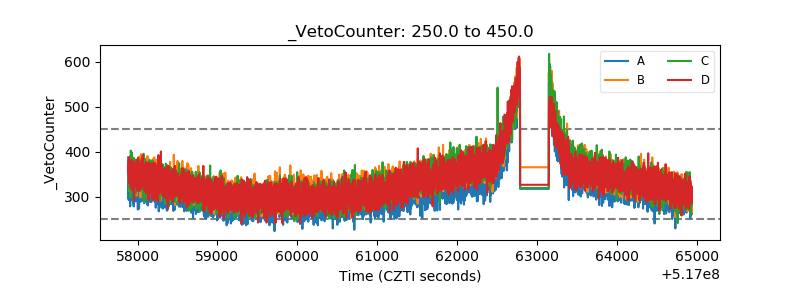 |