| Param | Original file | Final file |
|---|---|---|
| Filename | modeM0/AS1A14_070T08_9000006576_57601cztM0_level2.fits | modeM0/AS1A14_070T08_9000006576_57601cztM0_level2_quad_clean.evt |
| Size (bytes) | 487,782,720 | 109,722,240 |
| Size | 465.2 MB | 104.6 MB |
| Events in quadrant A | 3,391,061 | 730,132 |
| Events in quadrant B | 3,768,900 | 780,673 |
| Events in quadrant C | 3,964,619 | 696,961 |
| Events in quadrant D | 6,336,527 | 582,294 |
| Mode M0 | |||
|---|---|---|---|
| Quadrant | BADHDUFLAG | Total packets | Discarded packets |
| A | 0 | 15644 | 0 |
| B | 0 | 16497 | 0 |
| C | 0 | 17359 | 1 |
| D | 0 | 24286 | 0 |
| Mode SS | |||
|---|---|---|---|
| Quadrant | BADHDUFLAG | Total packets | Discarded packets |
| A | 0 | 152 | 0 |
| B | 0 | 152 | 0 |
| C | 0 | 152 | 0 |
| D | 0 | 152 | 0 |
| Quadrant | Total seconds | Saturated seconds | Saturation percentage |
|---|---|---|---|
| A | 7652 | 10 | 0.130685% |
| B | 7653 | 68 | 0.888540% |
| C | 7652 | 83 | 1.084684% |
| D | 7652 | 997 | 13.029273% |
Noise dominated data is calculated using 1-second bins in cleaned event files. If a bin has >2000 counts, and if more than 50% of those come from <1% of pixels, then it is considered to be noise-dominated and hence unusable.
| Quadrant | # 1 sec bins | Bins with >0 counts | Bins with >2000 counts | High rate bins dominated by noise | Noise dominated (total time) | Noise dominated (detector-on time) | Marked lightcurve |
|---|---|---|---|---|---|---|---|
| A | 7652 | 7652 | 1 | 1 | 0.01% | 0.01% | 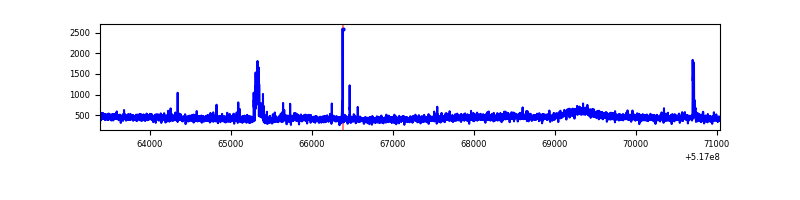 |
| B | 7653 | 7653 | 23 | 23 | 0.30% | 0.30% | 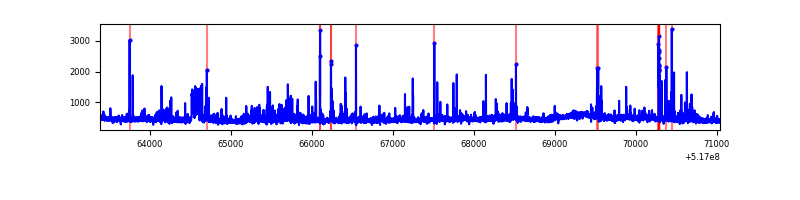 |
| C | 7652 | 7652 | 75 | 75 | 0.98% | 0.98% | 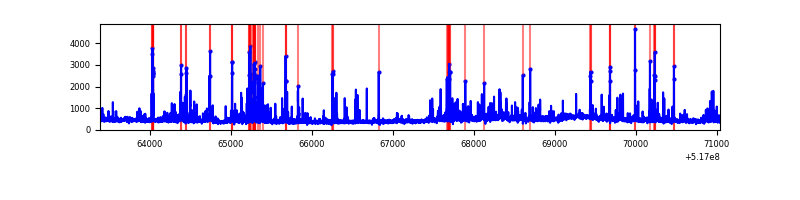 |
| D | 7652 | 7652 | 865 | 865 | 11.30% | 11.30% | 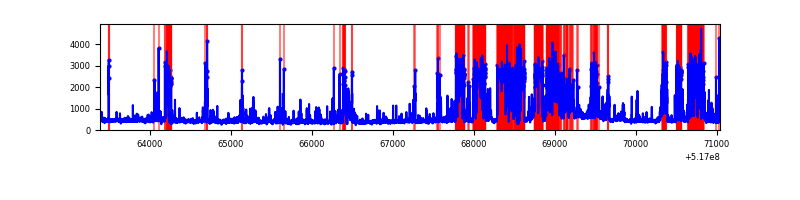 |
Top three noisy pixels from each quadrant. If the there are fewer than three noisy pixels in the level2.evt file, extra rows are filled as -1
| Pixel properties | Quadrant properties | ||||||
|---|---|---|---|---|---|---|---|
| Quadrant | DetID | PixID | Counts | Sigma | Mean | Median | Sigma |
| A | 3 | 14 | 151619 | 743.37 | 826 | 803 | 202.9 |
| A | 7 | 14 | 21145 | 100.26 | 826 | 803 | 202.9 |
| A | 4 | 3 | 12727 | 58.77 | 826 | 803 | 202.9 |
| B | 5 | 185 | 120455 | 691.07 | 813 | 782 | 173.2 |
| B | 10 | 247 | 114192 | 654.9 | 813 | 782 | 173.2 |
| B | 0 | 245 | 82169 | 469.98 | 813 | 782 | 173.2 |
| C | 15 | 224 | 600135 | 2745.06 | 799 | 790 | 218.3 |
| C | 14 | 254 | 84930 | 385.37 | 799 | 790 | 218.3 |
| C | 12 | 2 | 42958 | 193.13 | 799 | 790 | 218.3 |
| D | 15 | 142 | 2015095 | 9363.87 | 753 | 719 | 215.1 |
| D | 8 | 240 | 616536 | 2862.64 | 753 | 719 | 215.1 |
| D | 2 | 249 | 278803 | 1292.68 | 753 | 719 | 215.1 |
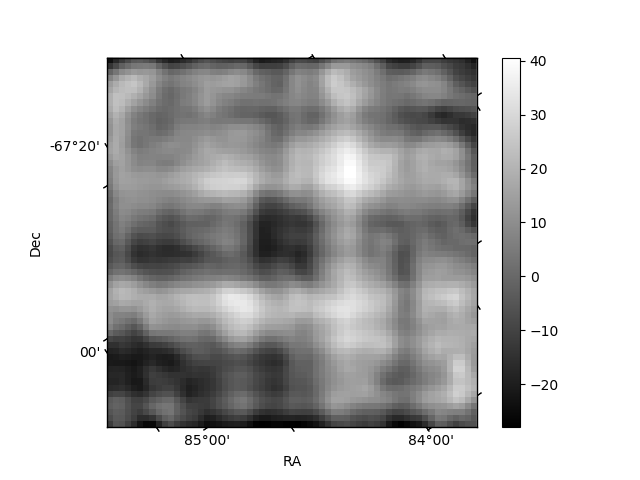
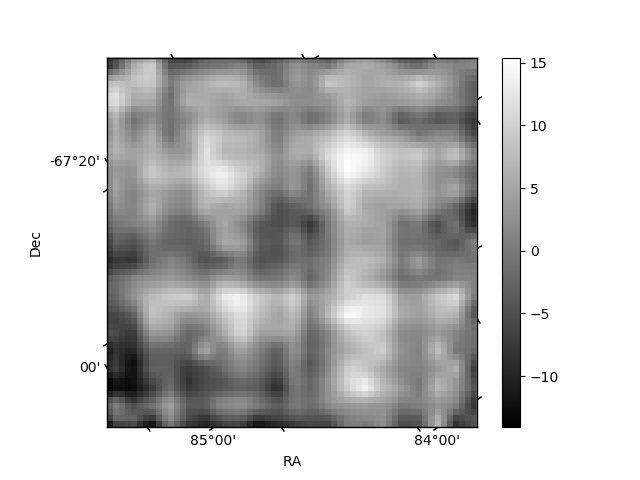
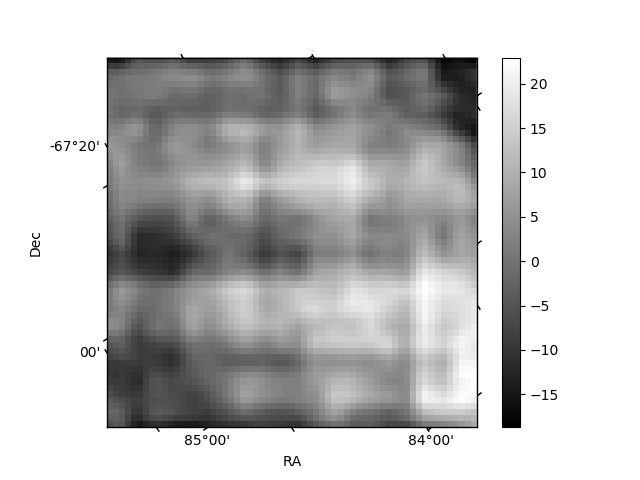
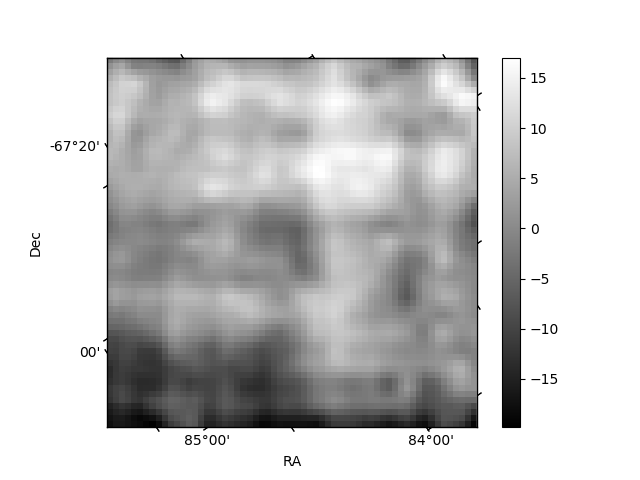
Histogram calculated using DETX and DETY for each event in the final _common_clean file
| Quadrant A | 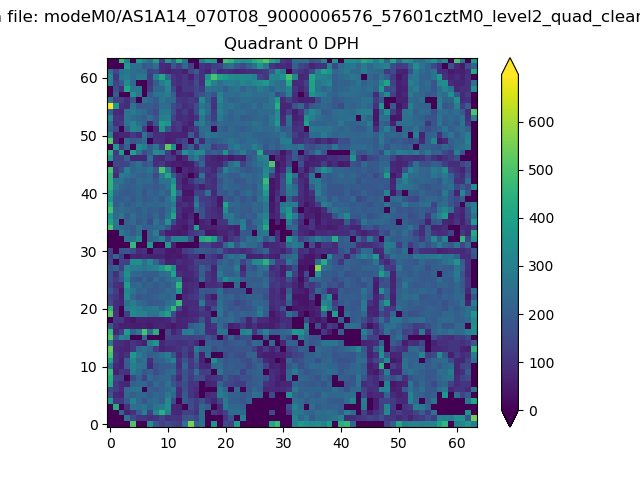 |
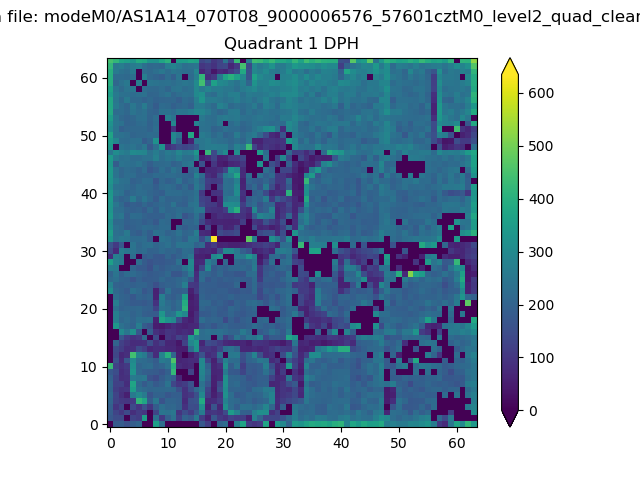 |
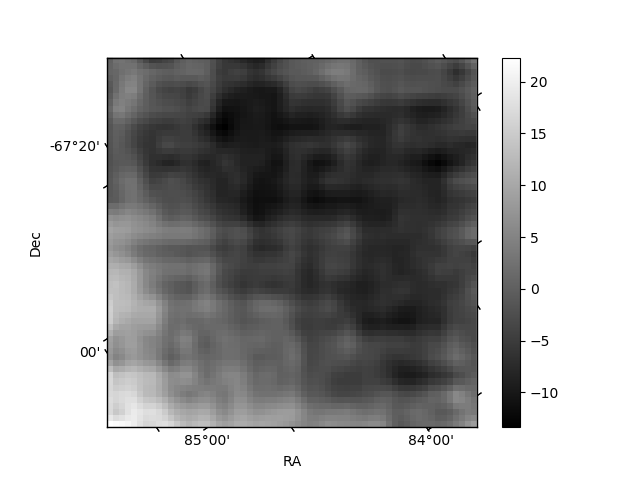
Quadrant B |
|---|---|---|---|
| Quadrant D | 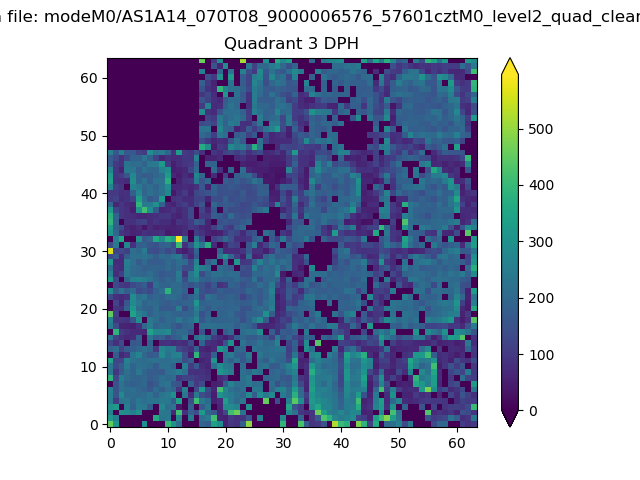 |
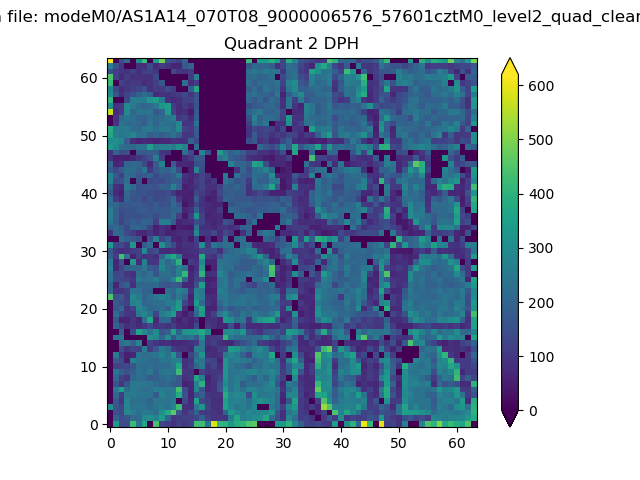 |
Quadrant C |
| Plot type | Count rate plots | Images |
|---|---|---|
| Comparison with Poisson distribution Blue bars denote a histogram of data divided into 1 sec bins. Red curve is a Poisson curve with rate = median count rate of data. |
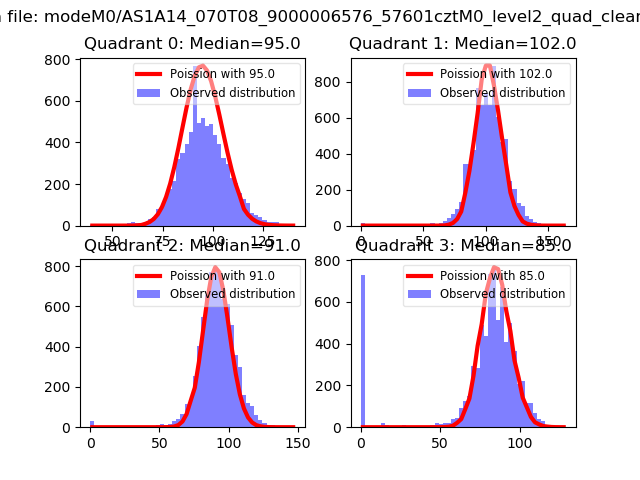 |
 |
| Quadrant-wise count rates Data is divided into 100 sec bins |
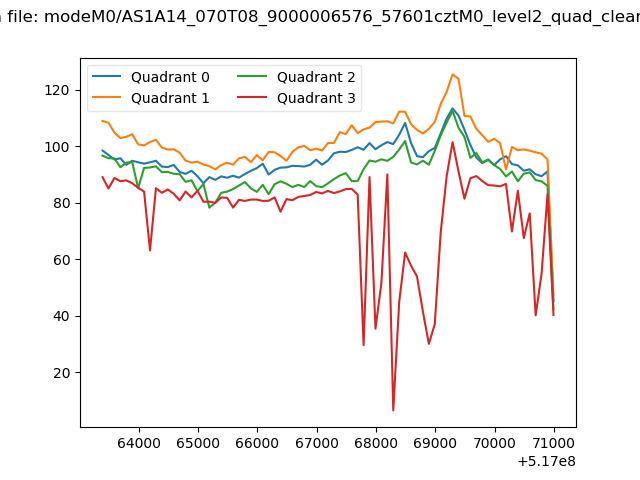 |
|
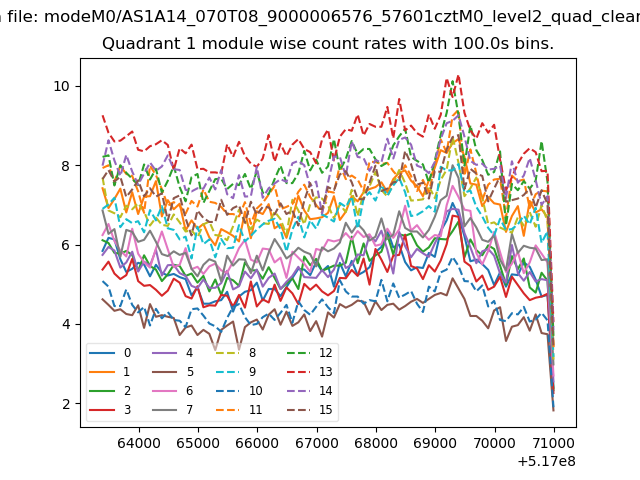
| Module-wise count rates for Quadrant A Data is divided into 100 sec bins |
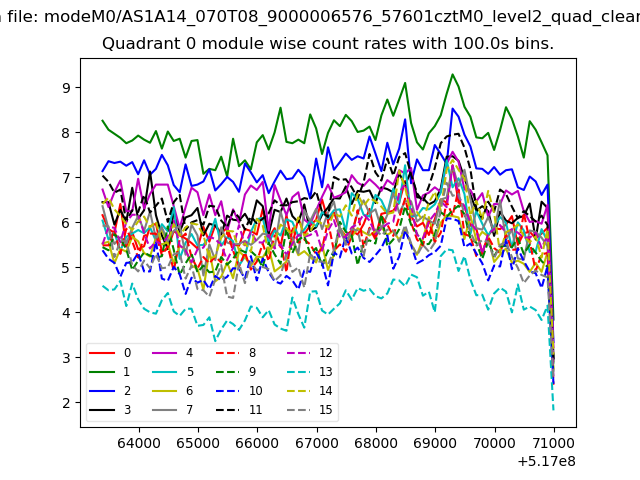 |
 |
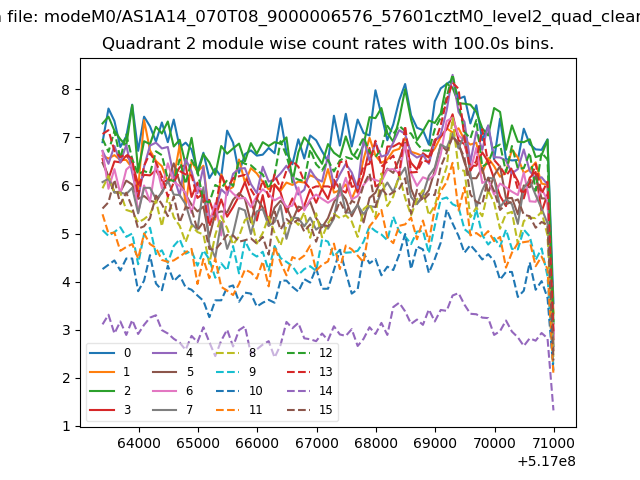
| Module-wise count rates for Quadrant B Data is divided into 100 sec bins |
 |
 |
| Module-wise count rates for Quadrant C Data is divided into 100 sec bins |
 |
 |
| Module-wise count rates for Quadrant D Data is divided into 100 sec bins |
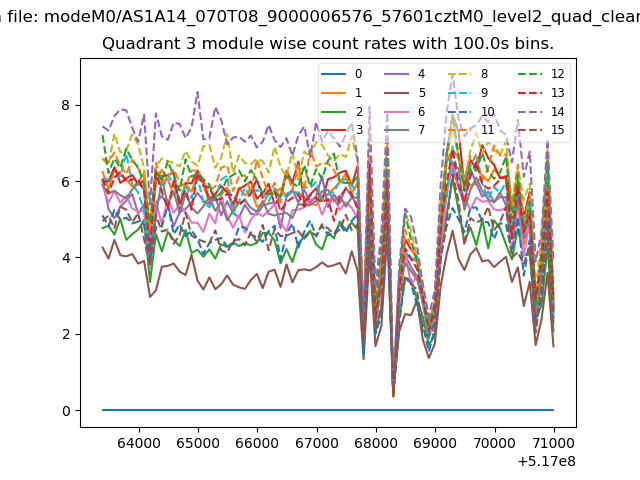 |
 |
| Parameter | Plot |
|---|---|
| CZT HV Monitor | 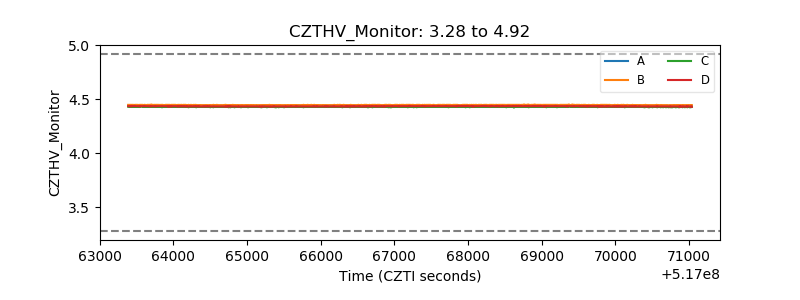 |
| D_VDD | 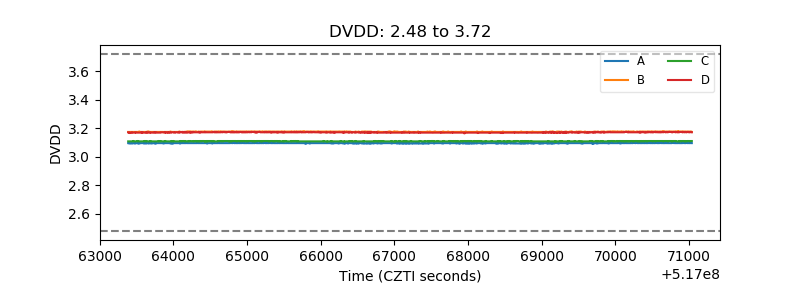 |
| Temperature 1 | 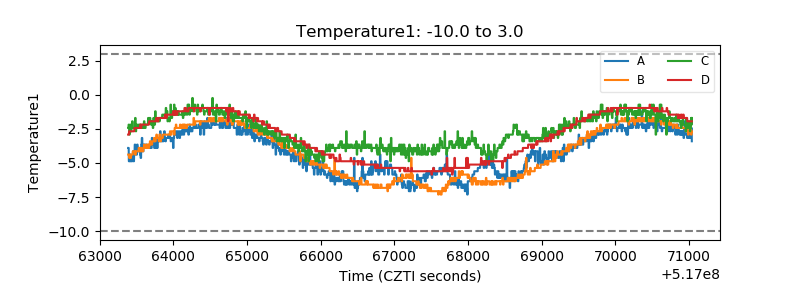 |
| Veto HV Monitor | 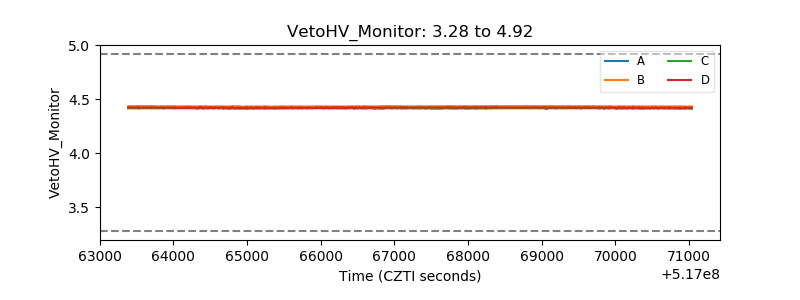 |
| Veto LLD | 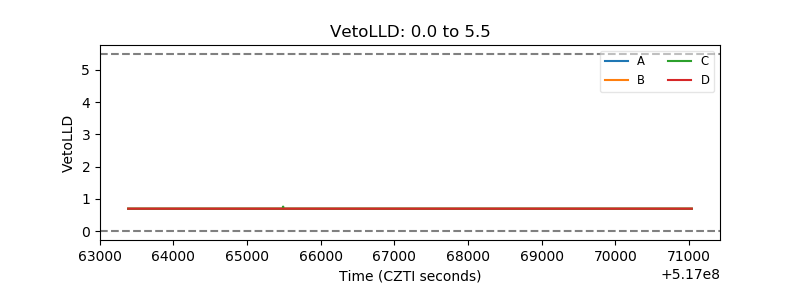 |
| Alpha Counter | 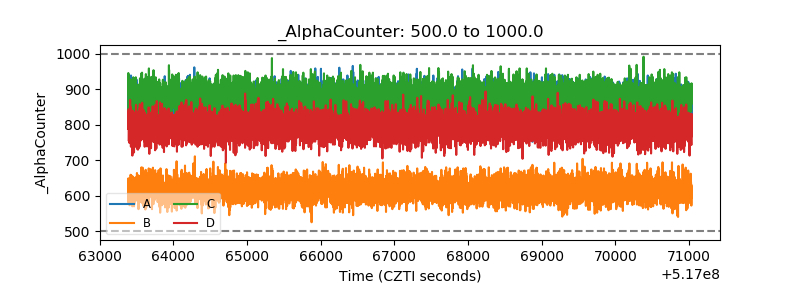 |
| _CPM_Rate | 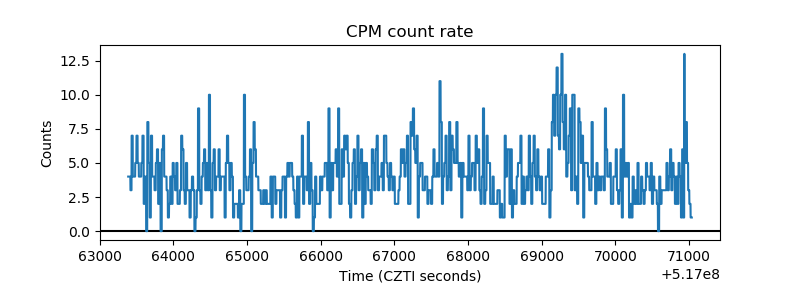 |
| CZT Counter | 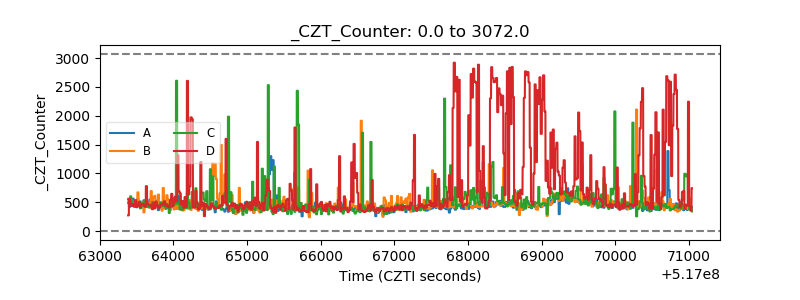 |
| +2.5 Volts monitor | 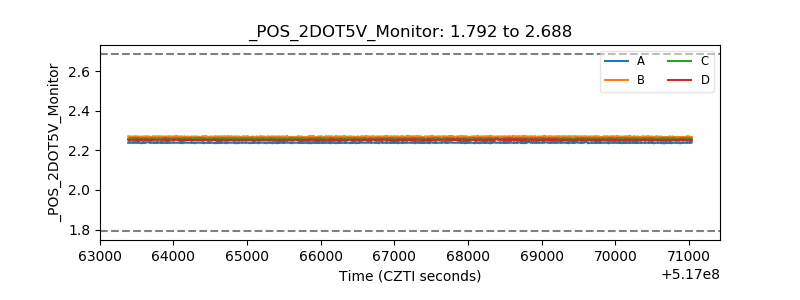 |
| +5 Volts monitor |  |
| _ROLL_ROT | 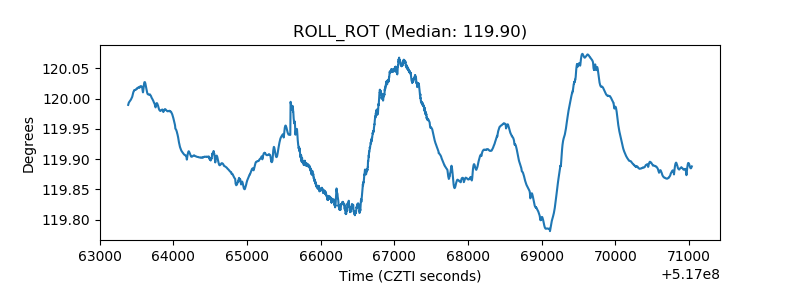 |
| _Roll_DEC | 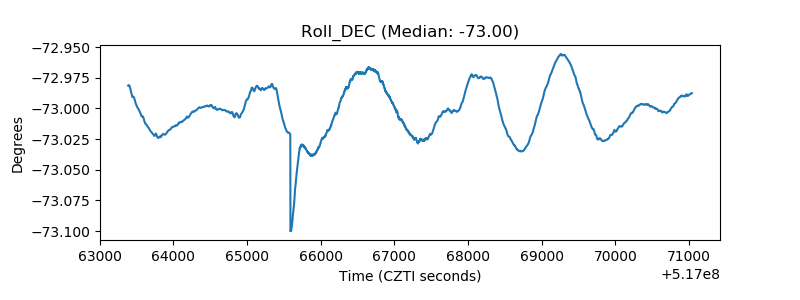 |
| _Roll_RA | 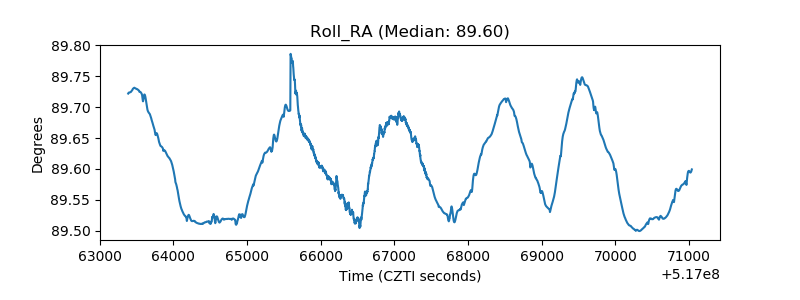 |
| Veto Counter | 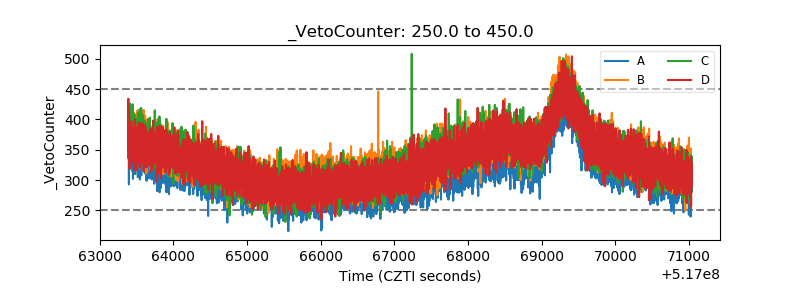 |